


Bitcoin (BTC) has failed to reclaim the $40,000 area and could potentially decrease to complete the final leg of its corrective phase.
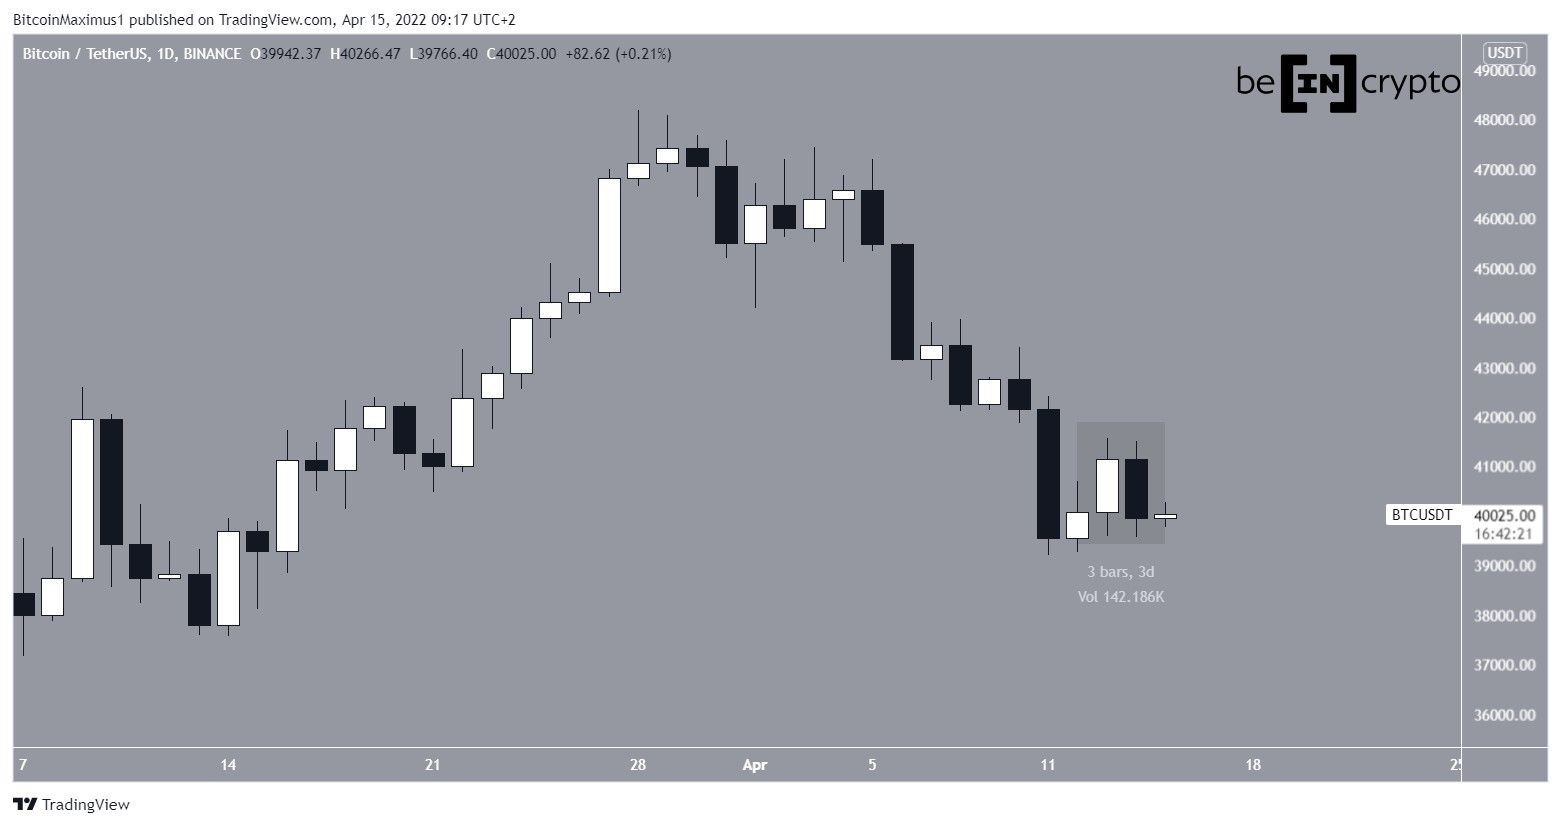
Bitcoin began to increase on April 11 and proceeded to reach a local high of $41,561 on April 13. However, it was rejected and decreased sharply the next day.
This decrease created a bearish engulfing candlestick (highlighted). This is a type of candlestick pattern in which the entire previous increase is negated within one day.
Following the creation of this pattern, further decreases could occur.
Bearish technical indicators
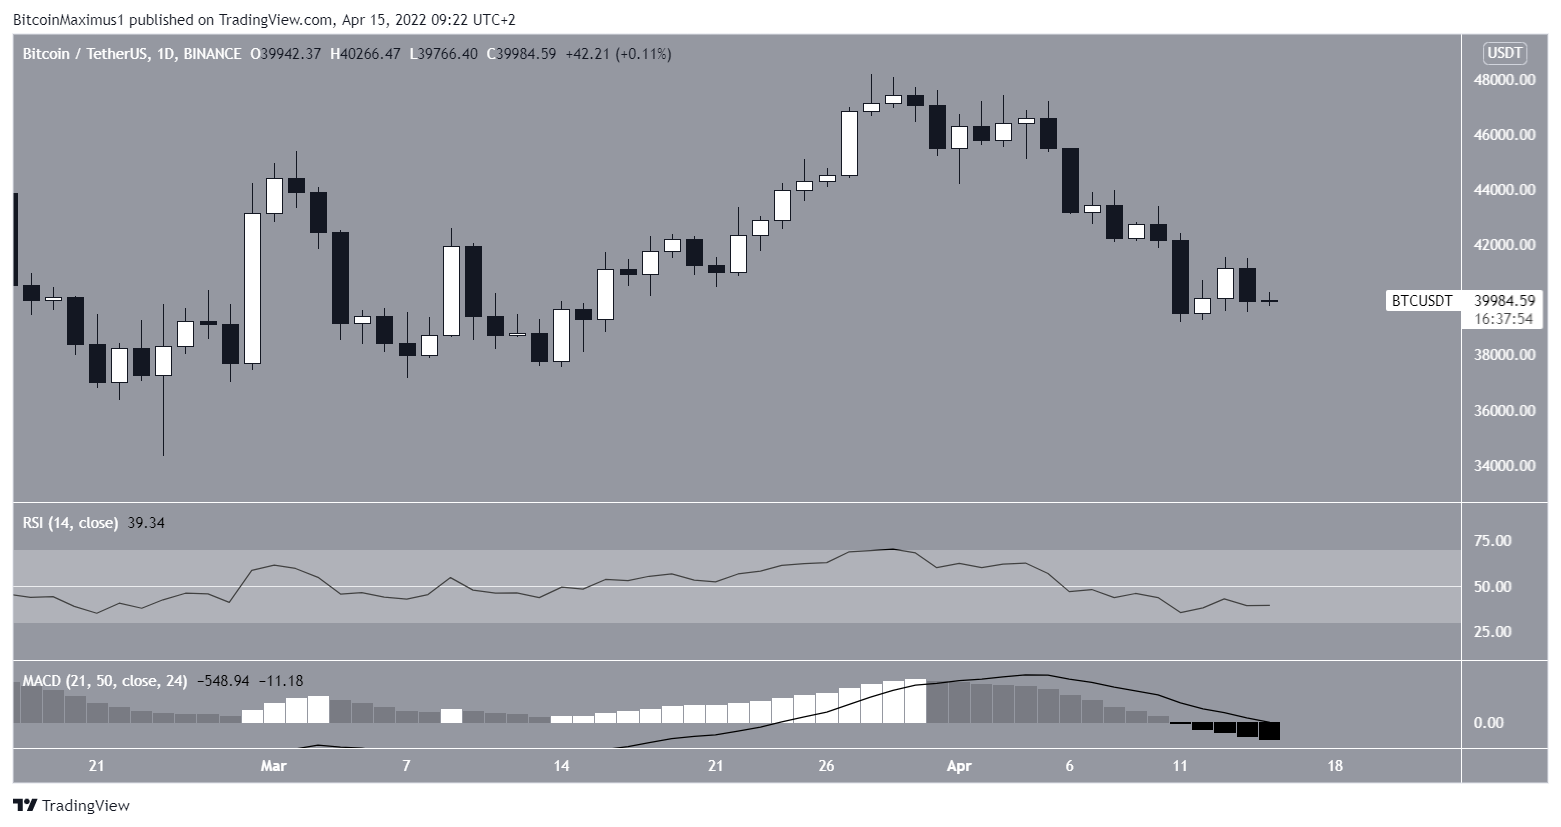
The daily time frame paints a bearish outlook for BTC due to the decreasing MACD and RSI. The former is already below 50 while the latter is negative. These are considered signs of a bearish trend and suggest new lows are likely.
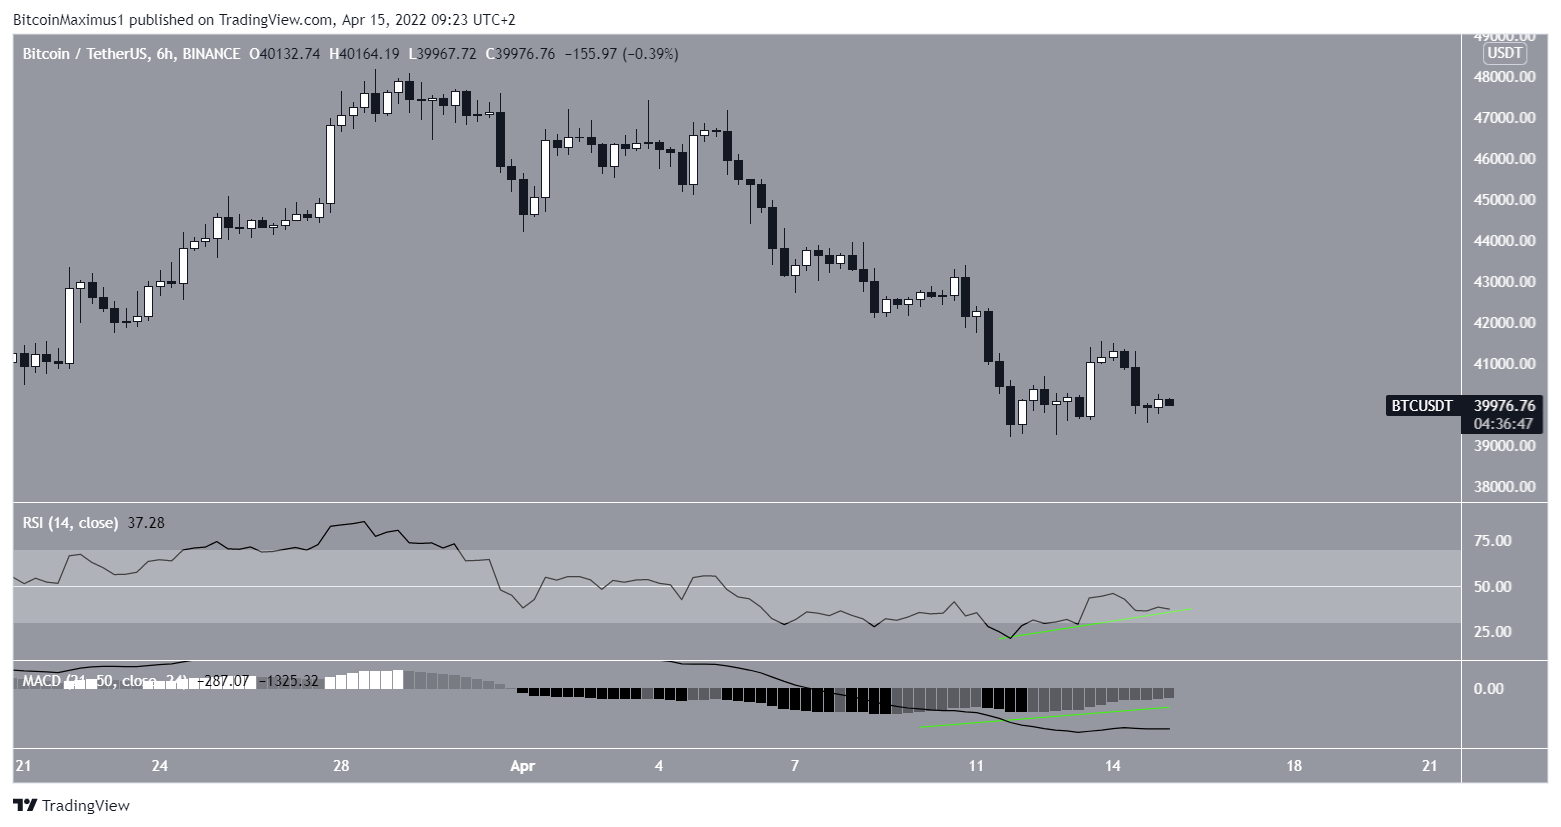
The six-hour time frame gives some signs of a relief rally. It shows that the RSI is extremely oversold and has begun to move upwards. Its trendline is also still intact. A similar occurrence is visible in the MACD.
If the BTC price were to make a lower low, it would likely generate a significant bullish divergence as a result.
BTC wave count analysis
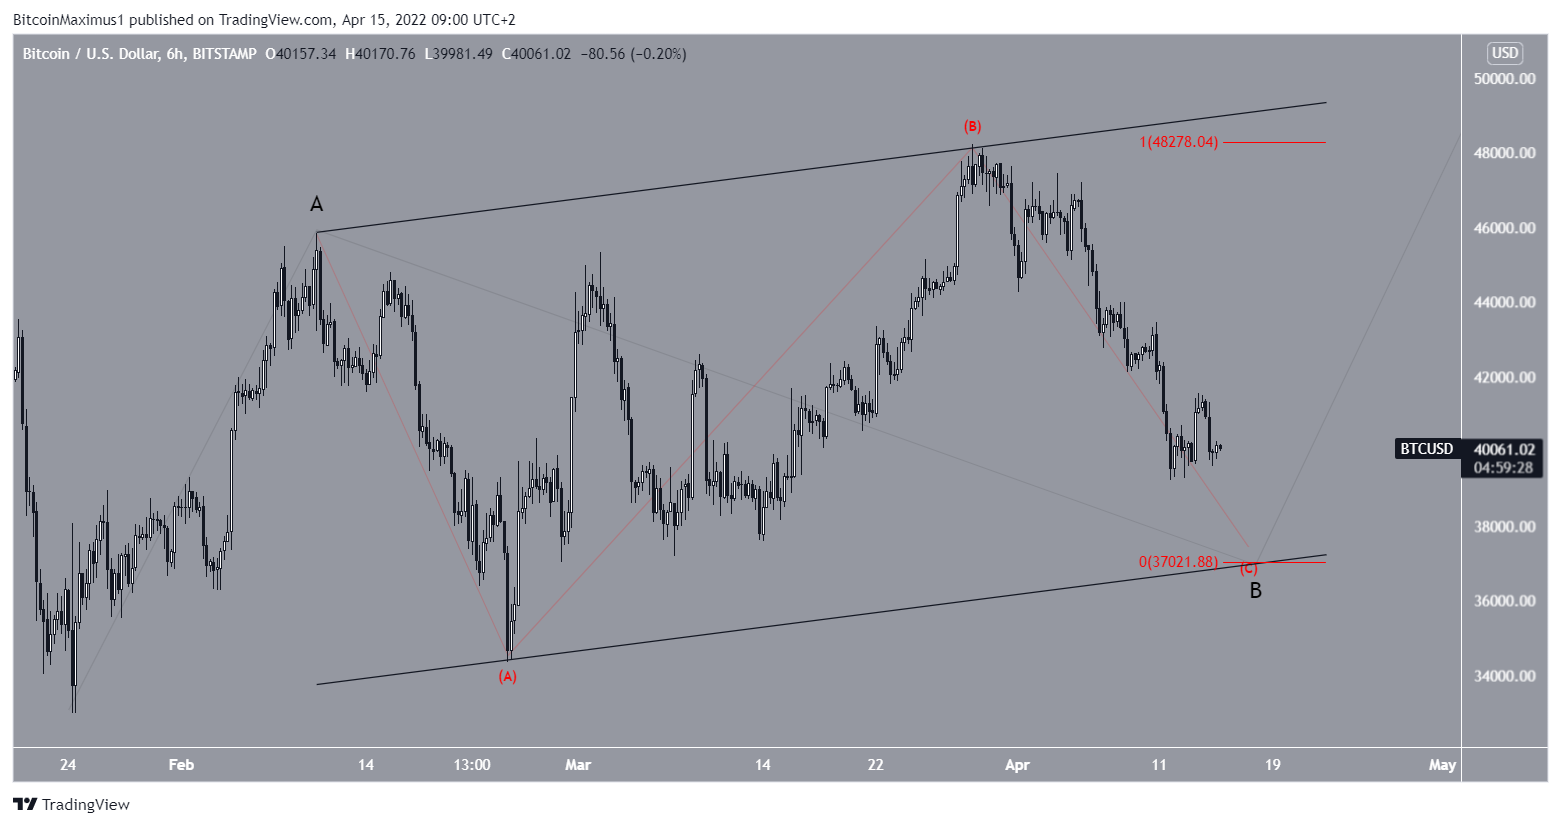
The long-term wave count suggests that an eventual upward move toward $50,000 is expected.
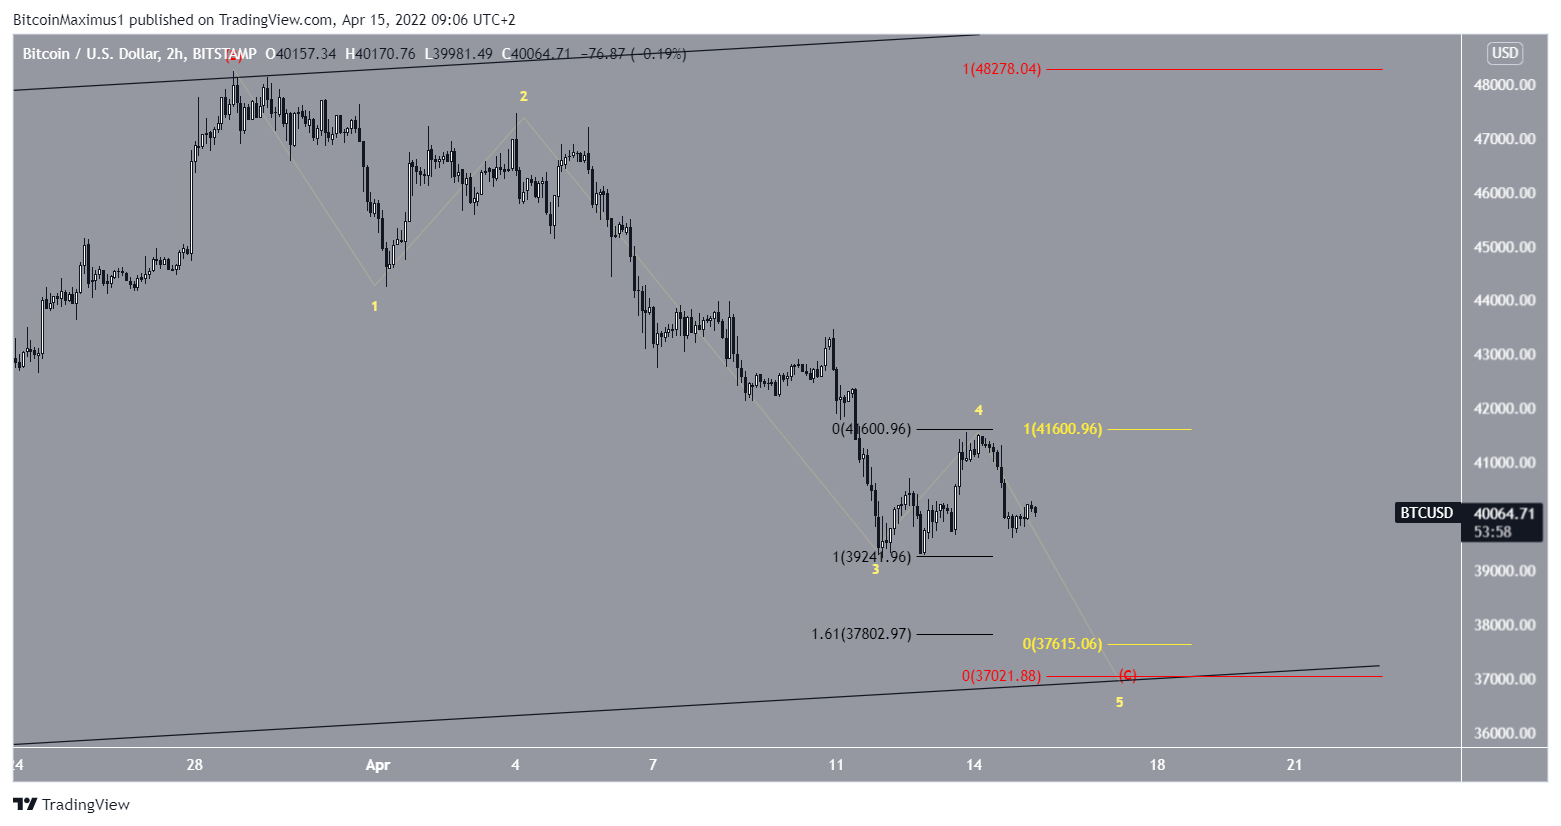
However, BTC is still correcting in what seems to be an A-B-C structure (red). So, a potential target for the bottom of this movement is found near $37,000. This would give waves A and C a 1:1 ratio and would coincide with the support line of an ascending parallel channel.
After the correction is complete, BTC could begin moving up toward $50,000.
The short-term count suggests that BTC has completed sub-wave four (yellow). Using the length of wave one (yellow) and the external retracement of wave four (black), a similar target of $37,800-$37,600 is given for the bottom of the correction.
For BeInCrypto’s previous Bitcoin (BTC) analysis, click here



