


The Litecoin (LTC) price prediction for March is bearish. The price has likely begun a correction after increasing for more than six months. The correction is expected to continue throughout March.
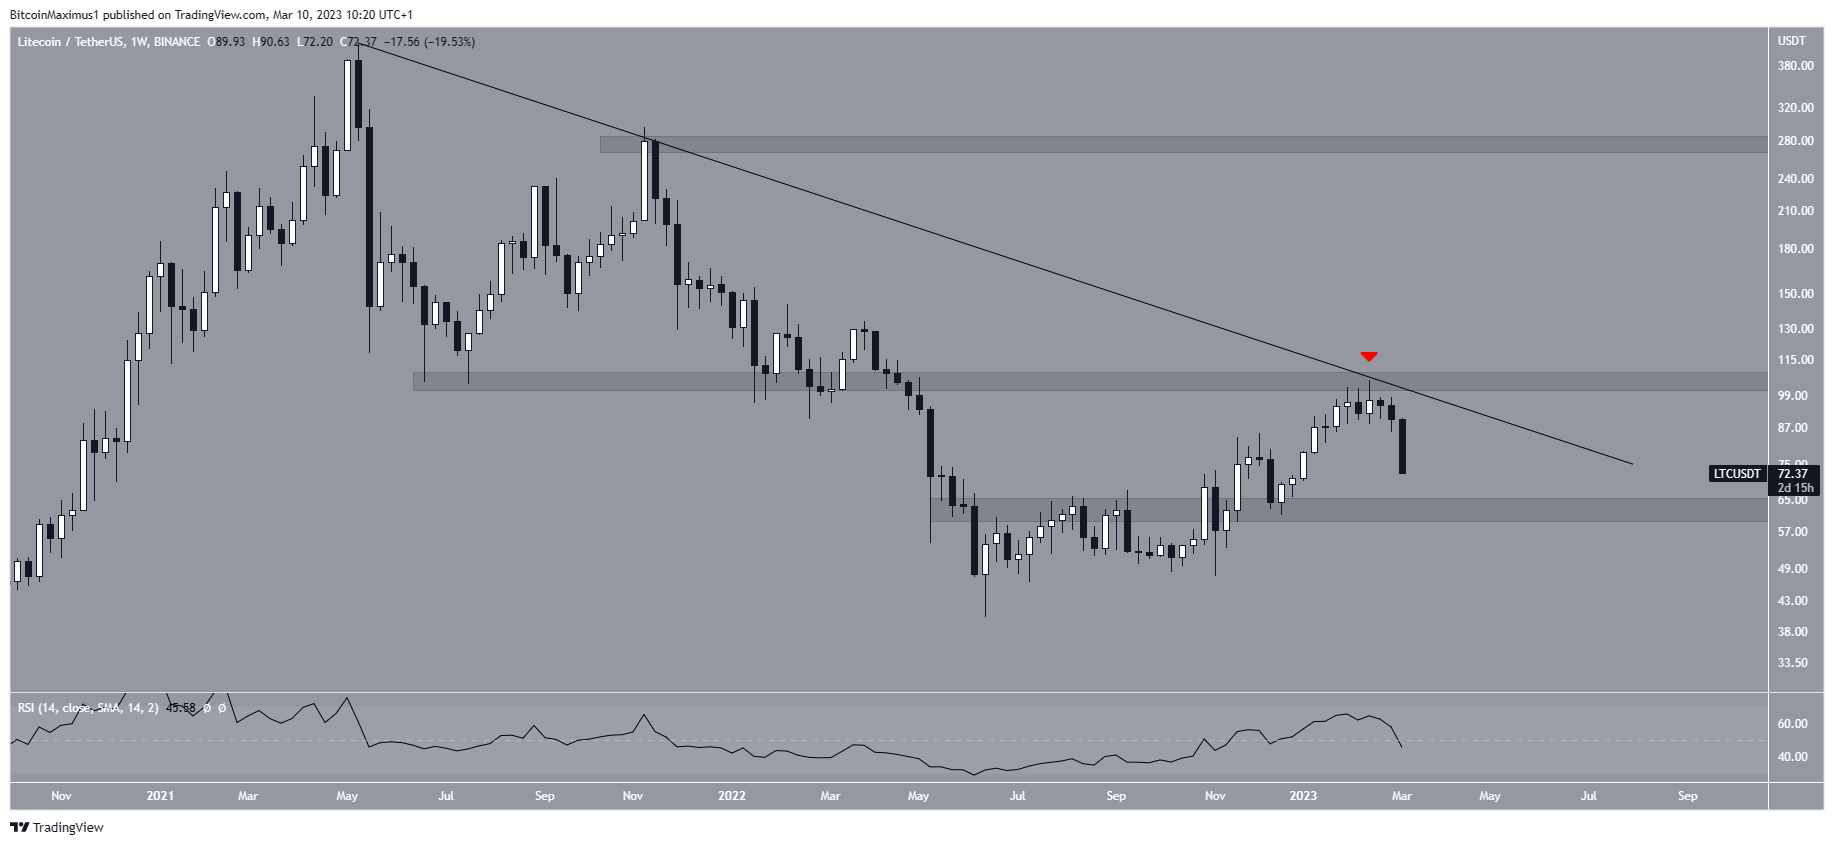
The Litecoin price started to fall under a long-term descending resistance line after its 2021 high of $413.65. The decrease led to a low of $40.25 in June 2022.
While the price has increased since it failed to break out from the descending resistance line. Rather, it was rejected by the confluence of the resistance line and the $105 resistance area on Feb. 17 (red icon). The LTC price has fallen since.
While the weekly RSI is still above 50, the trend can only be considered bullish once the Litecoin price breaks out above these levels. In that case, an increase to an average price of $280 could follow.
On the other hand, the closest horizontal support area would be at $64.
Litecoin (LTC) Price Prediction for March: Correction Ahead
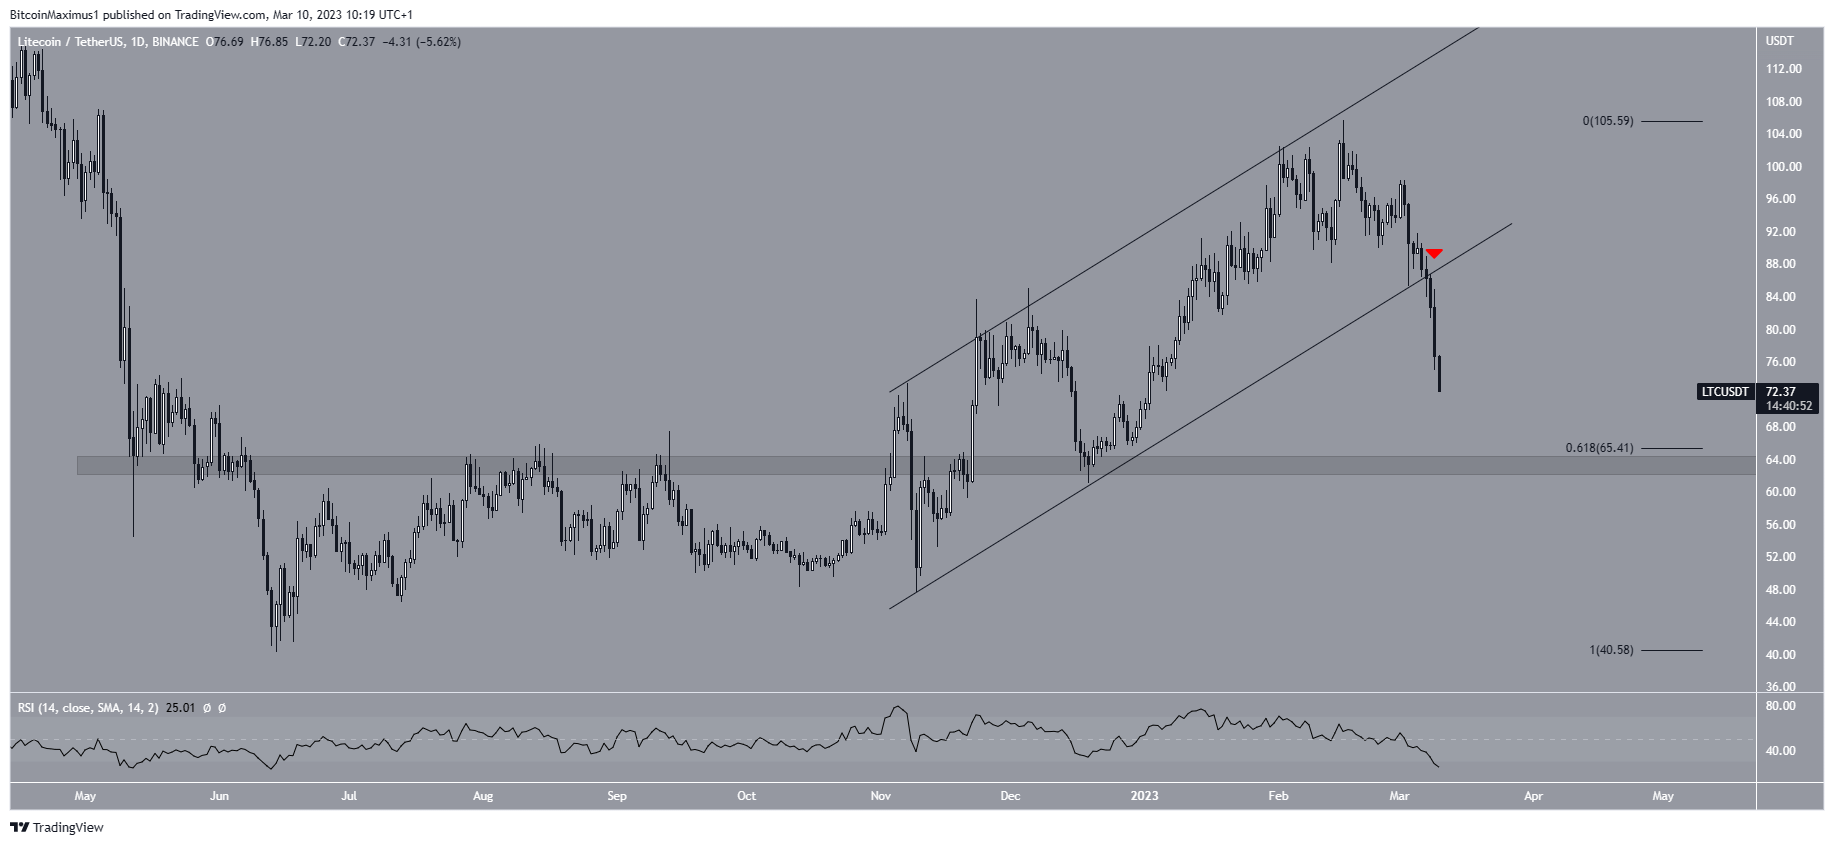
The technical analysis from the daily time frame supports the continuation of the decrease for the Litecoin price. There are several reasons for this.
Most importantly, the LTC price broke down from an ascending parallel channel. This supports the possibility that a downward movement has begun.
Secondly, the daily RSI has fallen below 50 and has generated no bullish divergence. This is considered a sign of a bearish trend.
As a result, the most likely Litecoin price prediction for March is a drop to the $64 horizontal support area, which also coincides with the 0.618 Fib retracement support level. Afterward, a relief rally could follow.
This bearish forecast will be negated if the LTC price reclaims the channel’s support line. In that case, an increase to $105 could follow.
Finally, the most likely wave count indicates that LTC completed a five-wave upward movement that took the shape of a leading diagonal. If so, it is now mired in an A-B-C corrective structure. This fits with the price movement from the weekly and daily time frames.
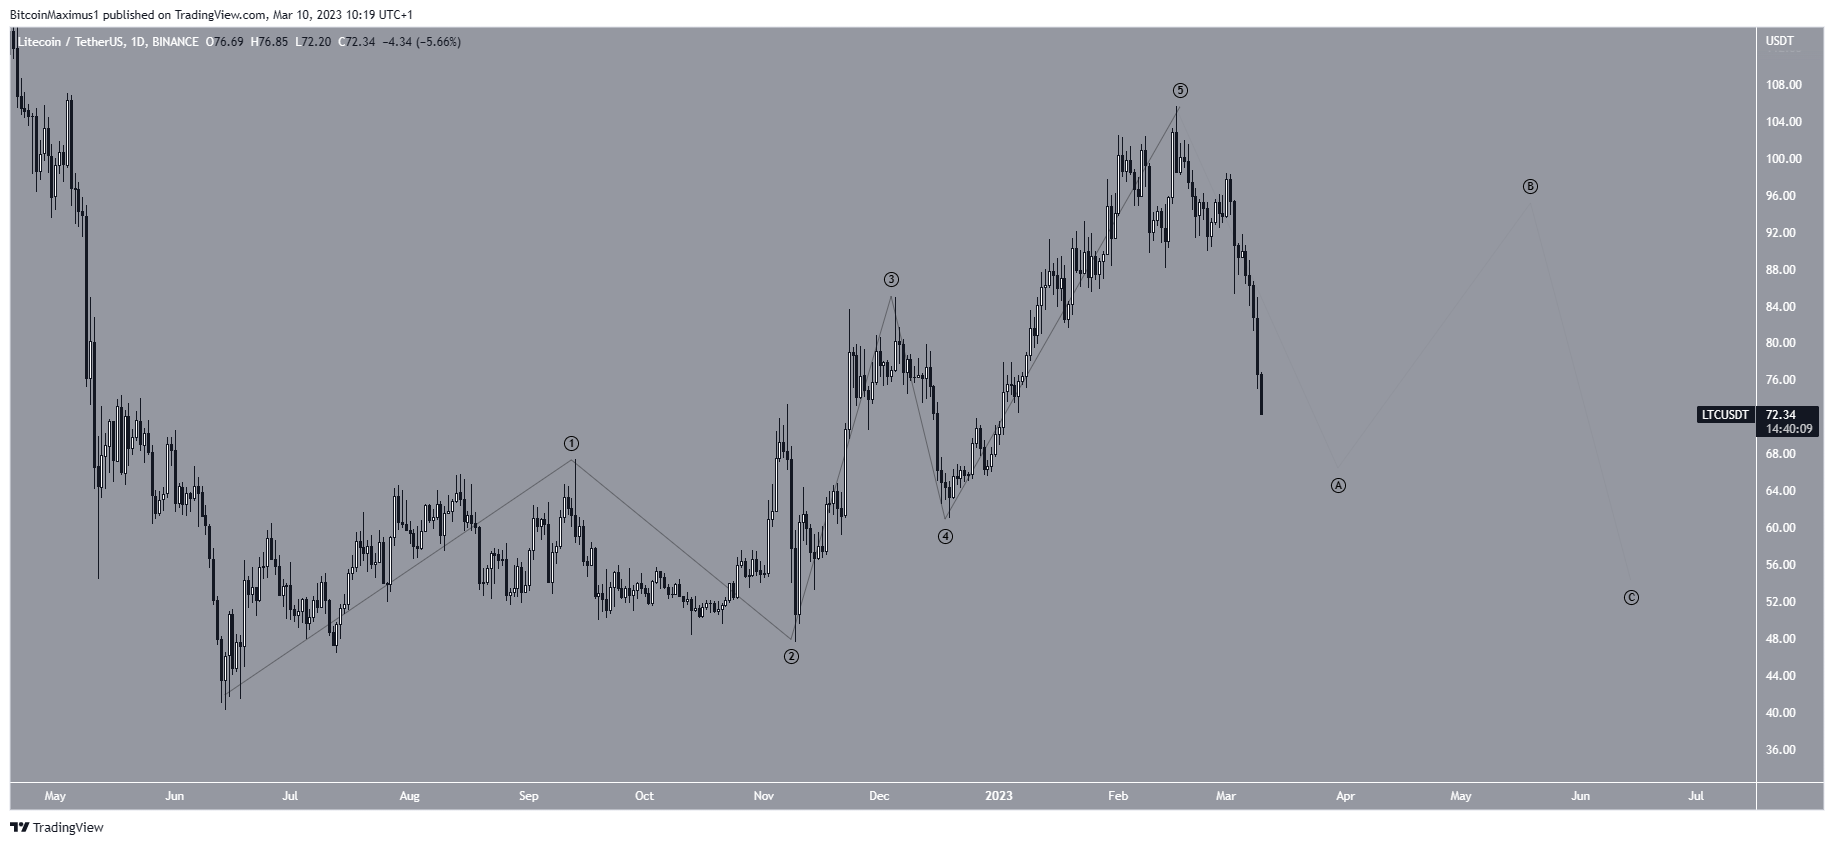
To conclude, the most likely Litecoin price forecast is a gradual drop to $64. Reclaiming the channel’s support line at $90 would invalidate this bearish outlook and could lead to an increase toward $105.
