


Litecoin (LTC) has held up well during the ongoing Bitcoin (BTC) price decrease but has yet to break out from a crucial horizontal resistance area.
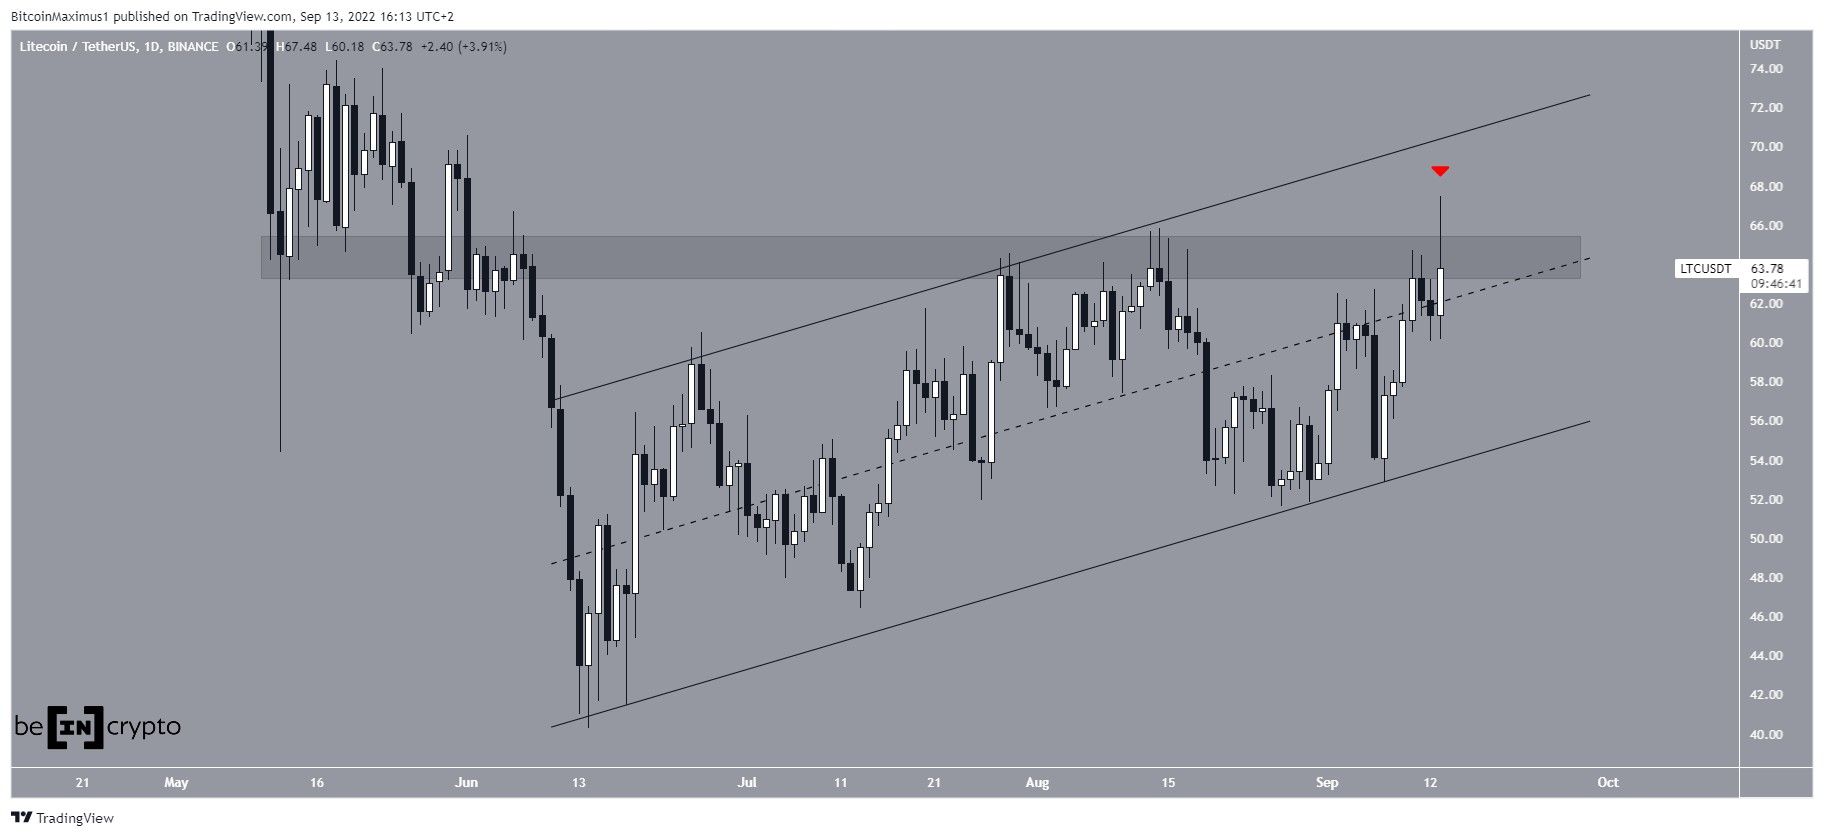
LTC has been moving upwards since June 14. The entire upward movement has so far been contained inside an ascending parallel channel. Such channels usually contain corrective movements, meaning that an eventual breakdown from the channel would be expected.
On Sept 13, the price reached a high of $67.48. Initially, it seemed that the movement had caused a breakout from the $64.50 resistance area.
However, the price decreased and has now created a long upper wick (red icon), falling below the $64.50 area shortly afterward.
If Litecoin falls below the midline of the channel, it would be a strong sign that a breakdown from the channel is likely.
Conversely, a reclaim of the $64.50 area would indicate that higher prices are in store. As it stands, this seems unlikely.
Wave count analysis
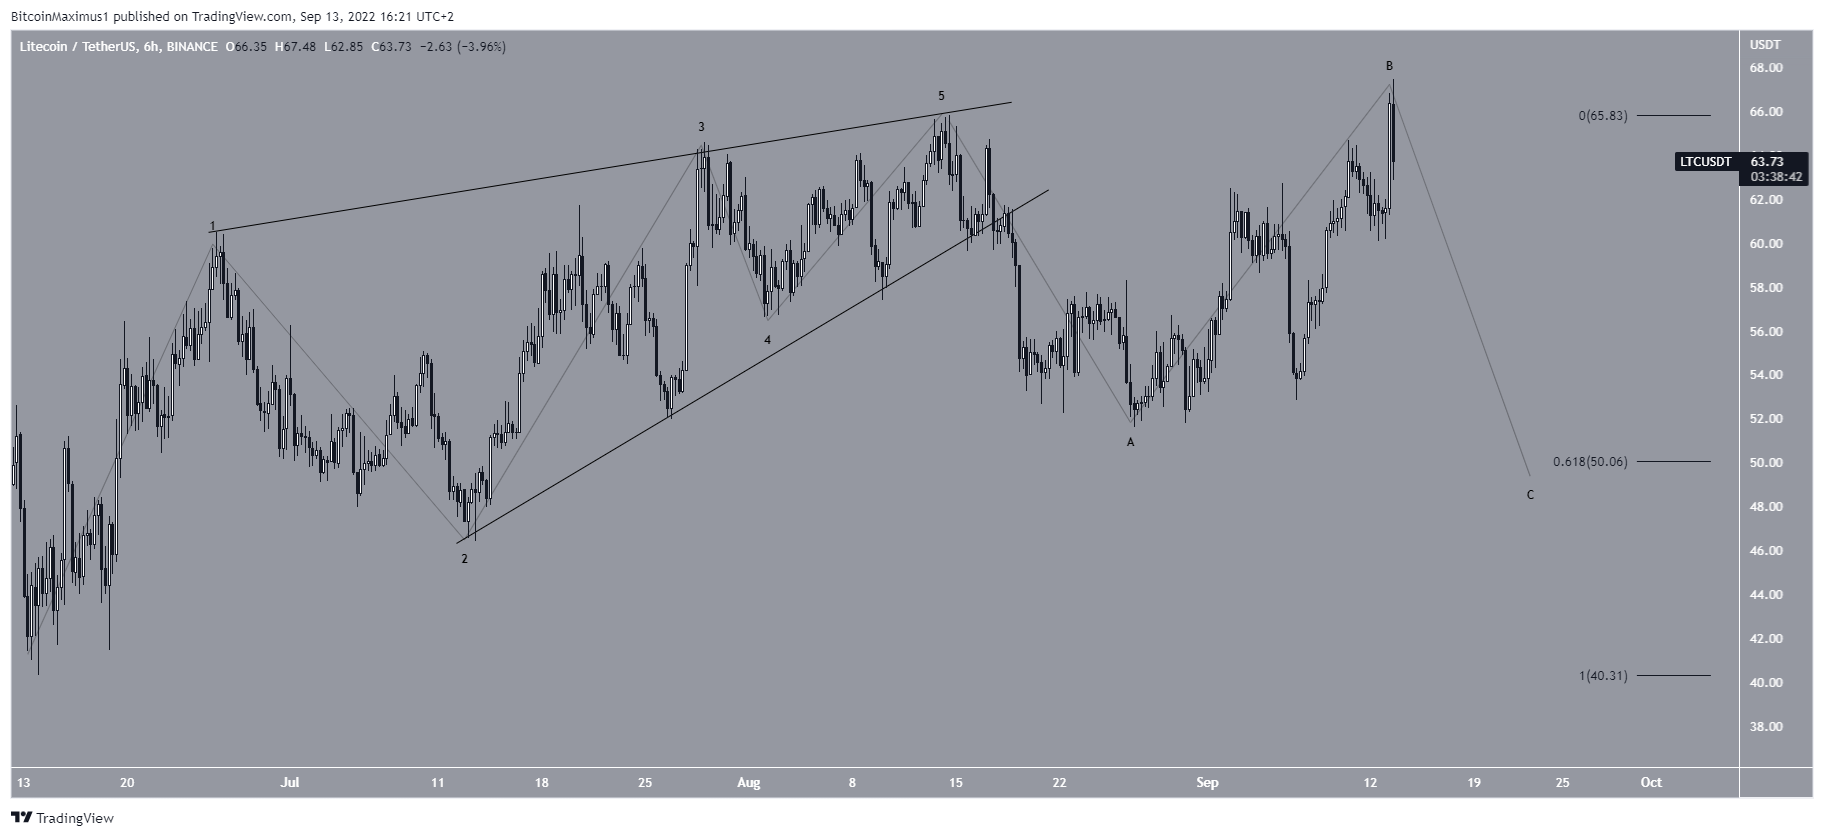
The wave count indicates that further downside is expected. Measuring from the June lows, it seems that LTC has completed a five-wave upward movement, which took the shape of a leading diagonal.
Afterward, the breakdown from the wedge and ensuing bounce resembles a flat corrective structure. If so, the price is currently in the C wave of this structure. In this case, a downward movement towards the 0.618 Fib retracement support level at $50 would be expected.
LTC/BTC
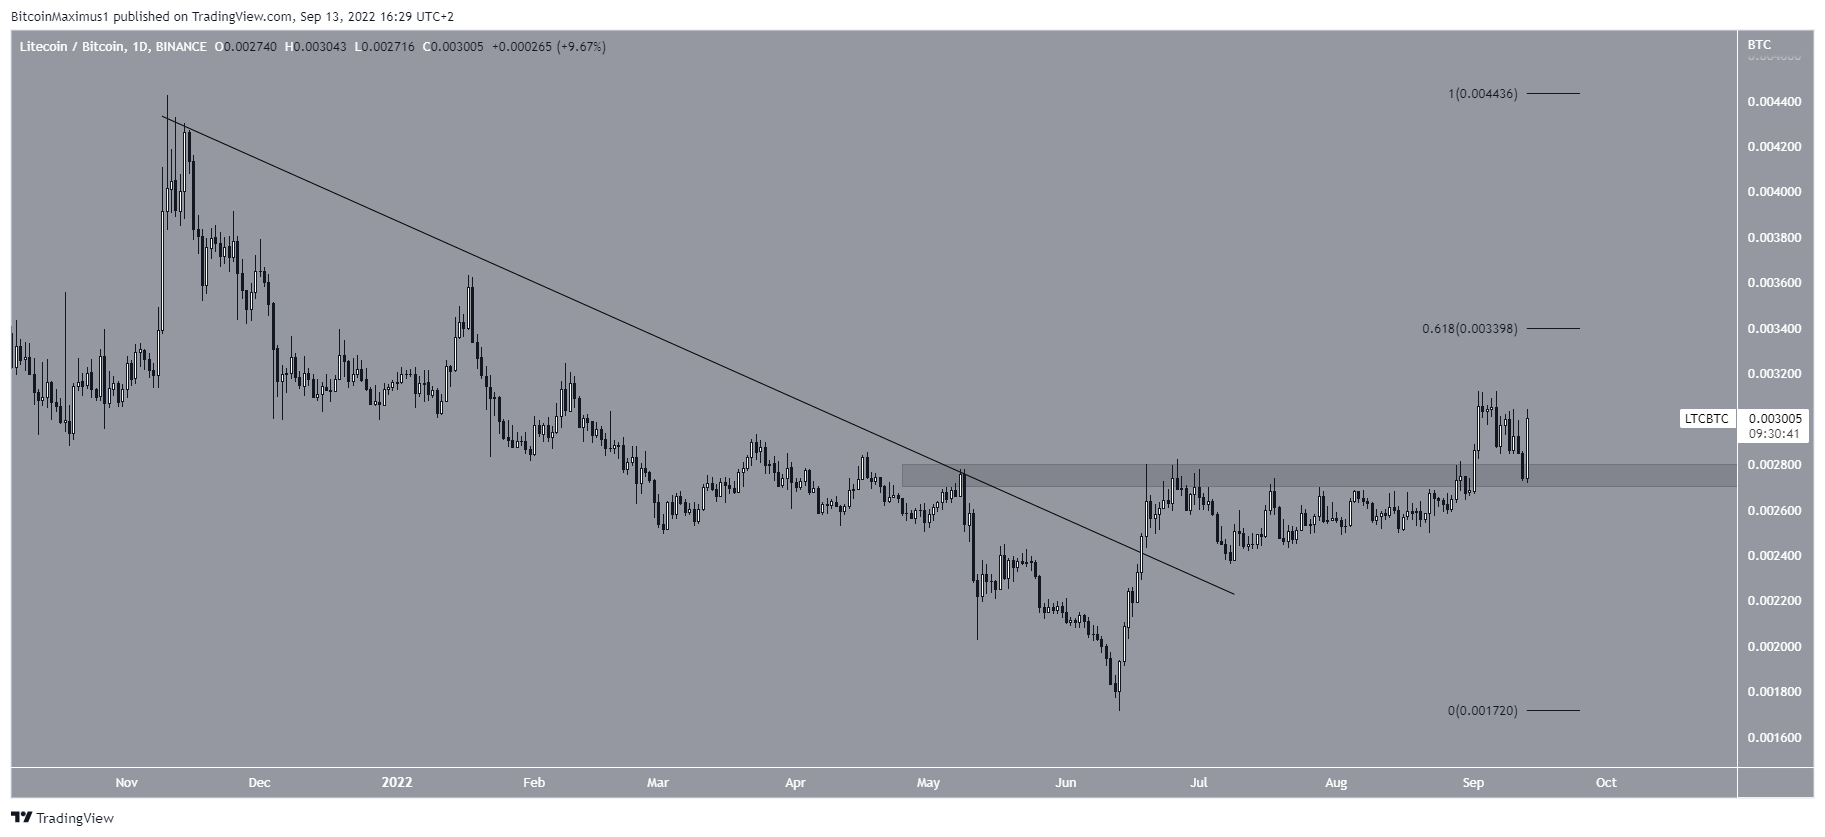
The LTC/BTC pair looks more bullish than its USD counterpart. The main reason for this is the breakout from a descending resistance line and ensuing reclaim of the ₿0.00275 resistance. Now, the ₿0.00275 area is expected to provide support.
If the upward movement continues, the closest resistance area would be at ₿0.0034, created by the 0.618 Fib retracement resistance level.
For Be[in]Crypto’s latest Bitcoin (BTC) analysis, click here


