The Litecoin (LTC) price has broken out from a long-term resistance line and validated it as support afterward.
It’s not yet clear if LTC will continue moving upwards. However, as long as it’s trading above the two support levels outlined below, the possibility for continuation remains high.
Long-Term Breakout
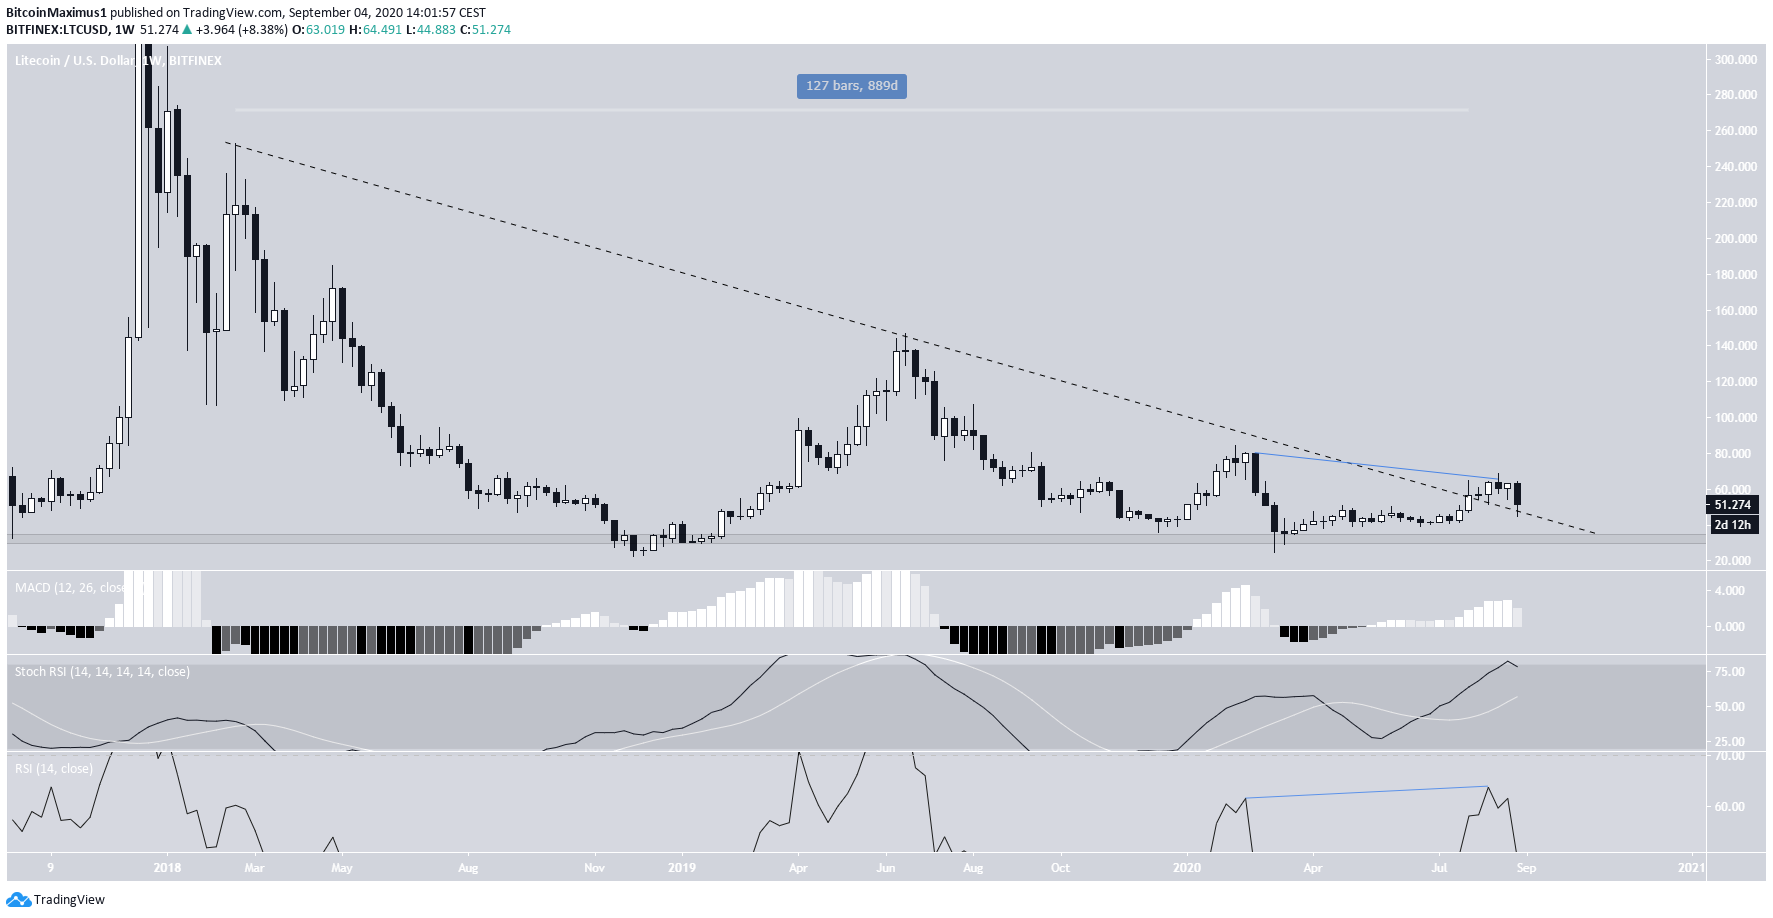
At the beginning of July, the LTC price broke out from a descending resistance line that had been in place for 889 days prior. This week’s decline served to validate the line as support, a customary occurrence after breakouts.
Technical indicators are neutral, leaning on bearish. There is a hidden bearish divergence that has developed on the RSI prior to the current decline. In addition, the stochastic RSI is overbought and has begun to fall.
However, there are no definite signs of a bearish reversal yet.
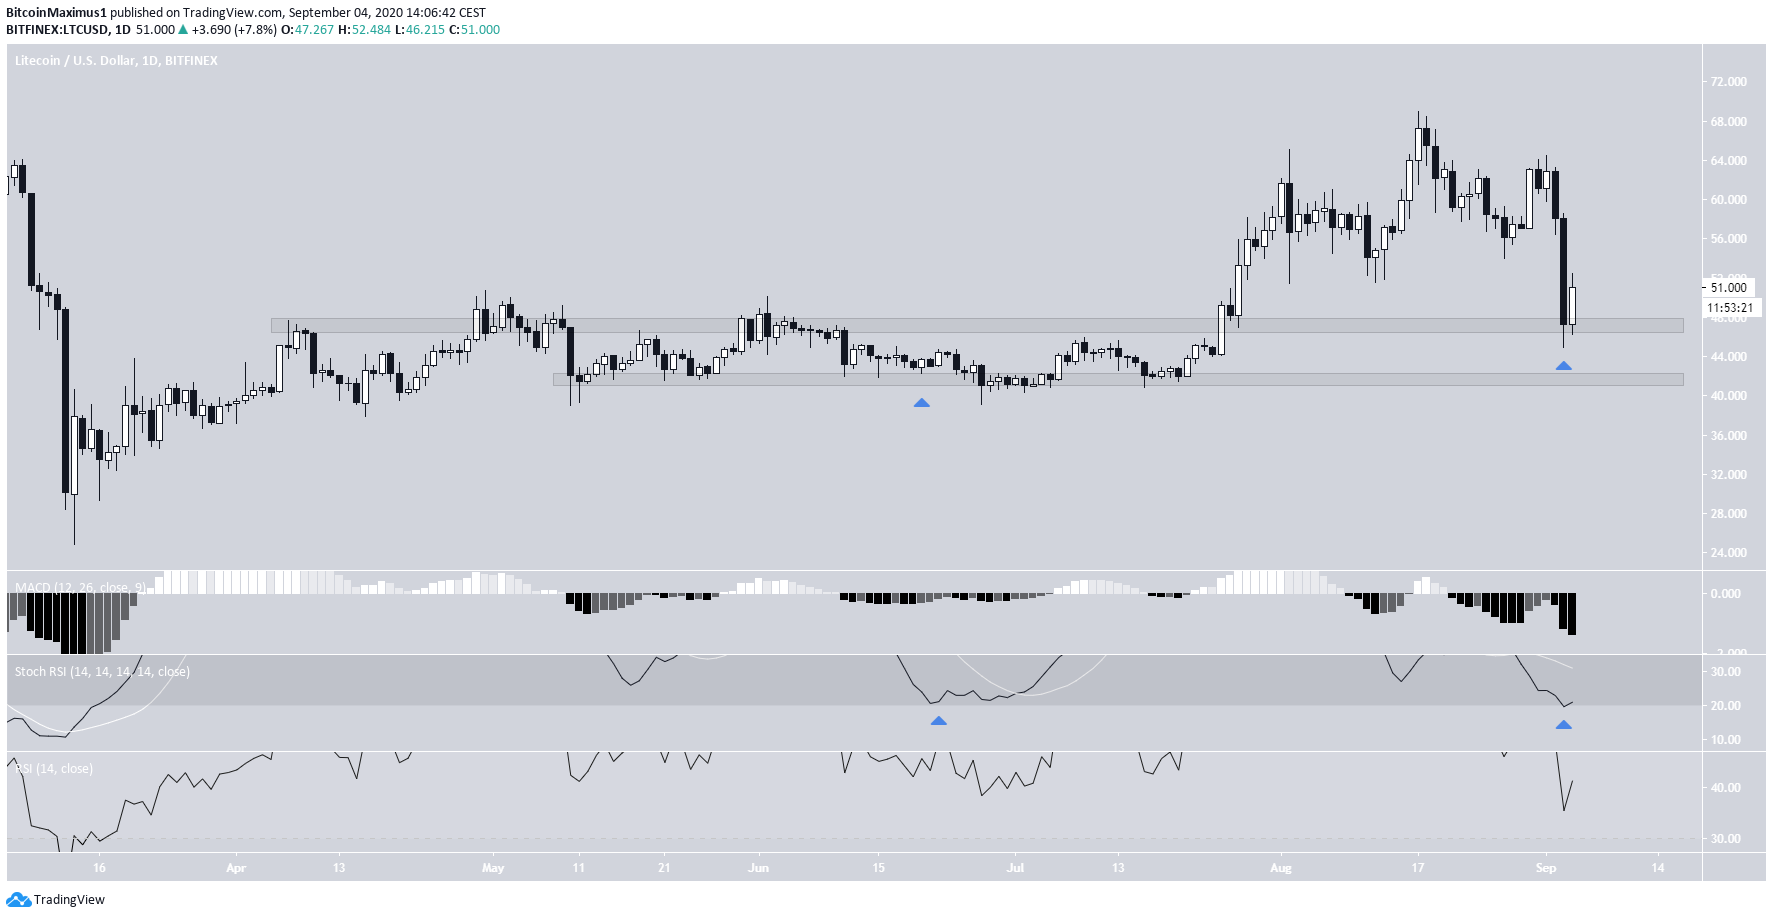
The daily time-frame shows two support levels, found at $47 and $40. At the time of writing, the price was trading right on the former.
Technical indicators on the daily time-frame show the opposite of those on the weekly one, indicating that the current conditions are oversold.
Both the RSI and the MACD are at their lowest levels since the March crash, and the stochastic RSI is oversold, at the same level as it was during June, prior to a considerable upward move.
Therefore, as long as the price is trading above either of these two support levels, the possibility for upward continuation remains high.
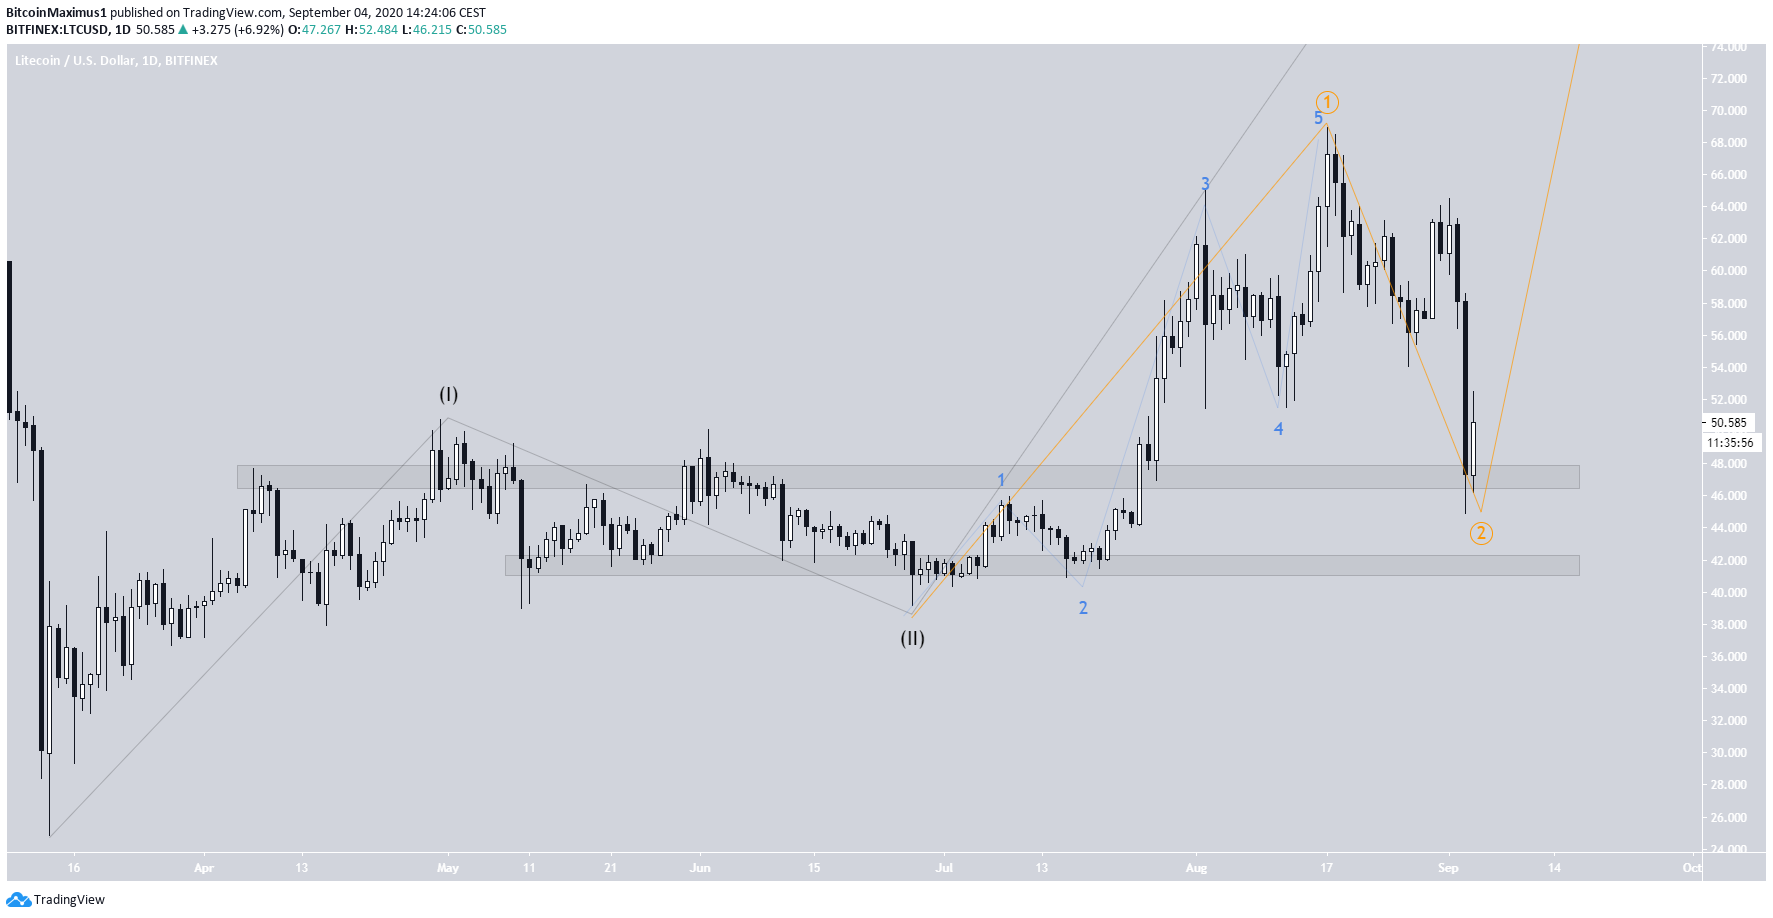
LTC Wave Counts
The wave count since the March 13 low is not entirely clear. One possibility is that the price has already completed a five-wave formation (in black below), and is now correcting. Due to the length of the preceding upward move, the correction could last for several weeks.
What is unusual about this formation is the length of waves 1-2 compared to waves 3-4-5, and the fact that the highest volume was recorded during the purported wave 5, which is uncommon.
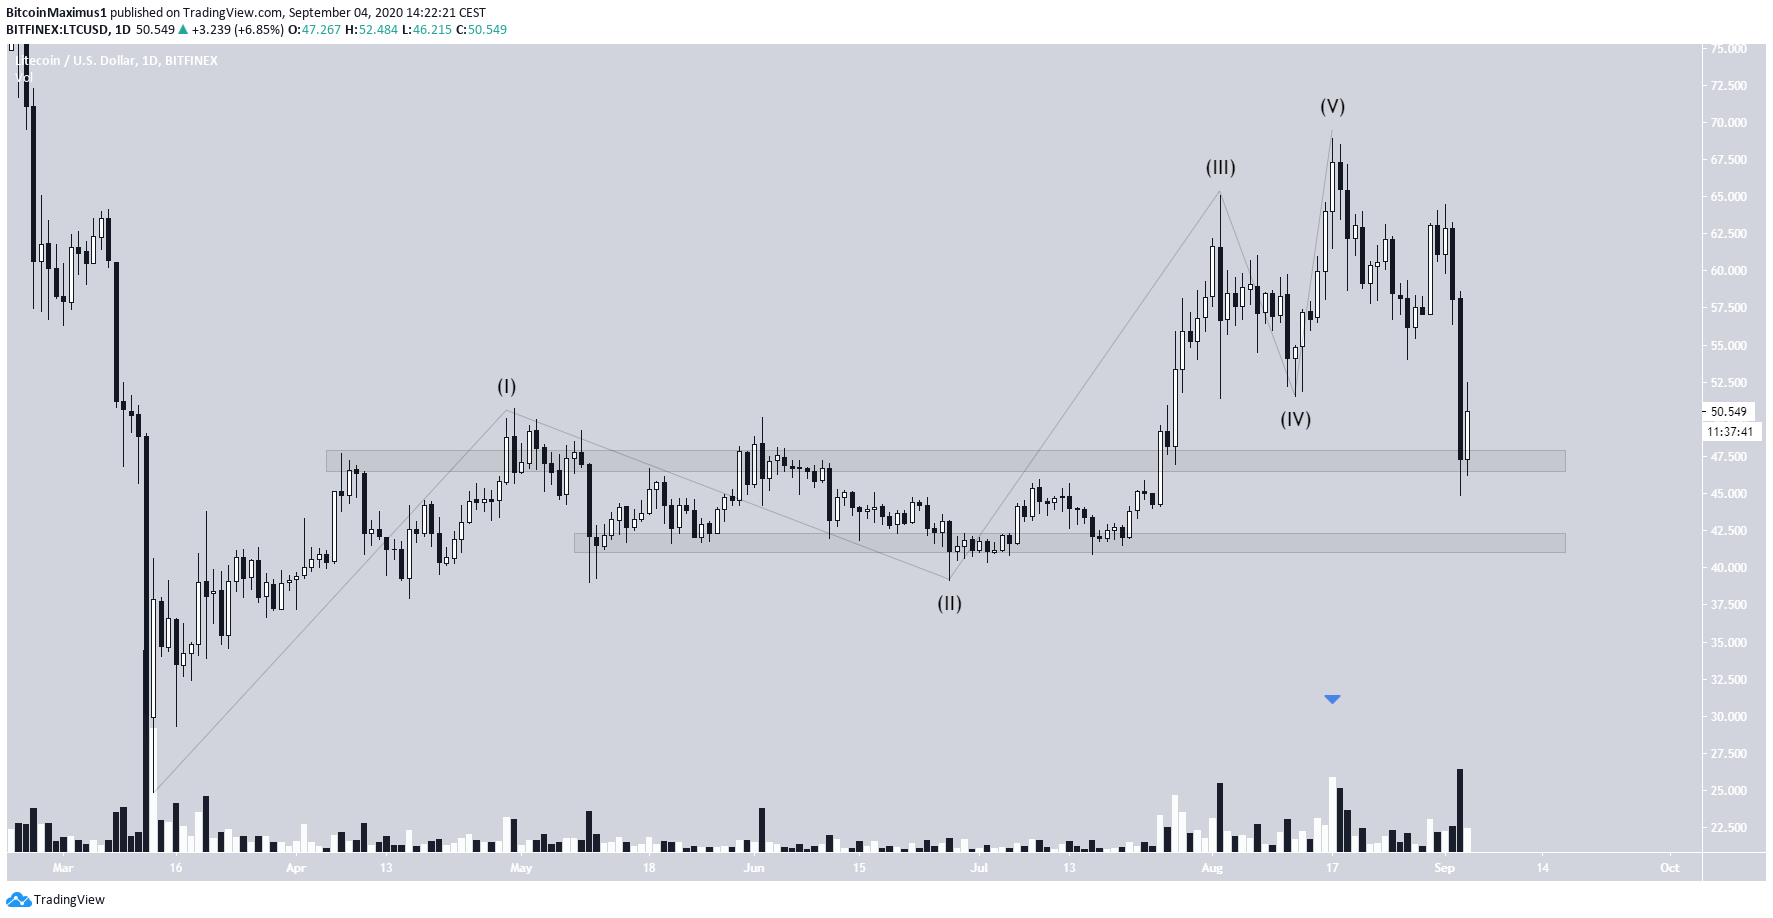
The other possibility is that the price has created what is known as a 1-2/1-2 wave. This means that after completing waves 1-2 (in black below), the third wave has extended, containing another 1-2 wave (orange).
This particular wave count would be invalidated by a decline below the July 27 wave 2 low at $39.10.
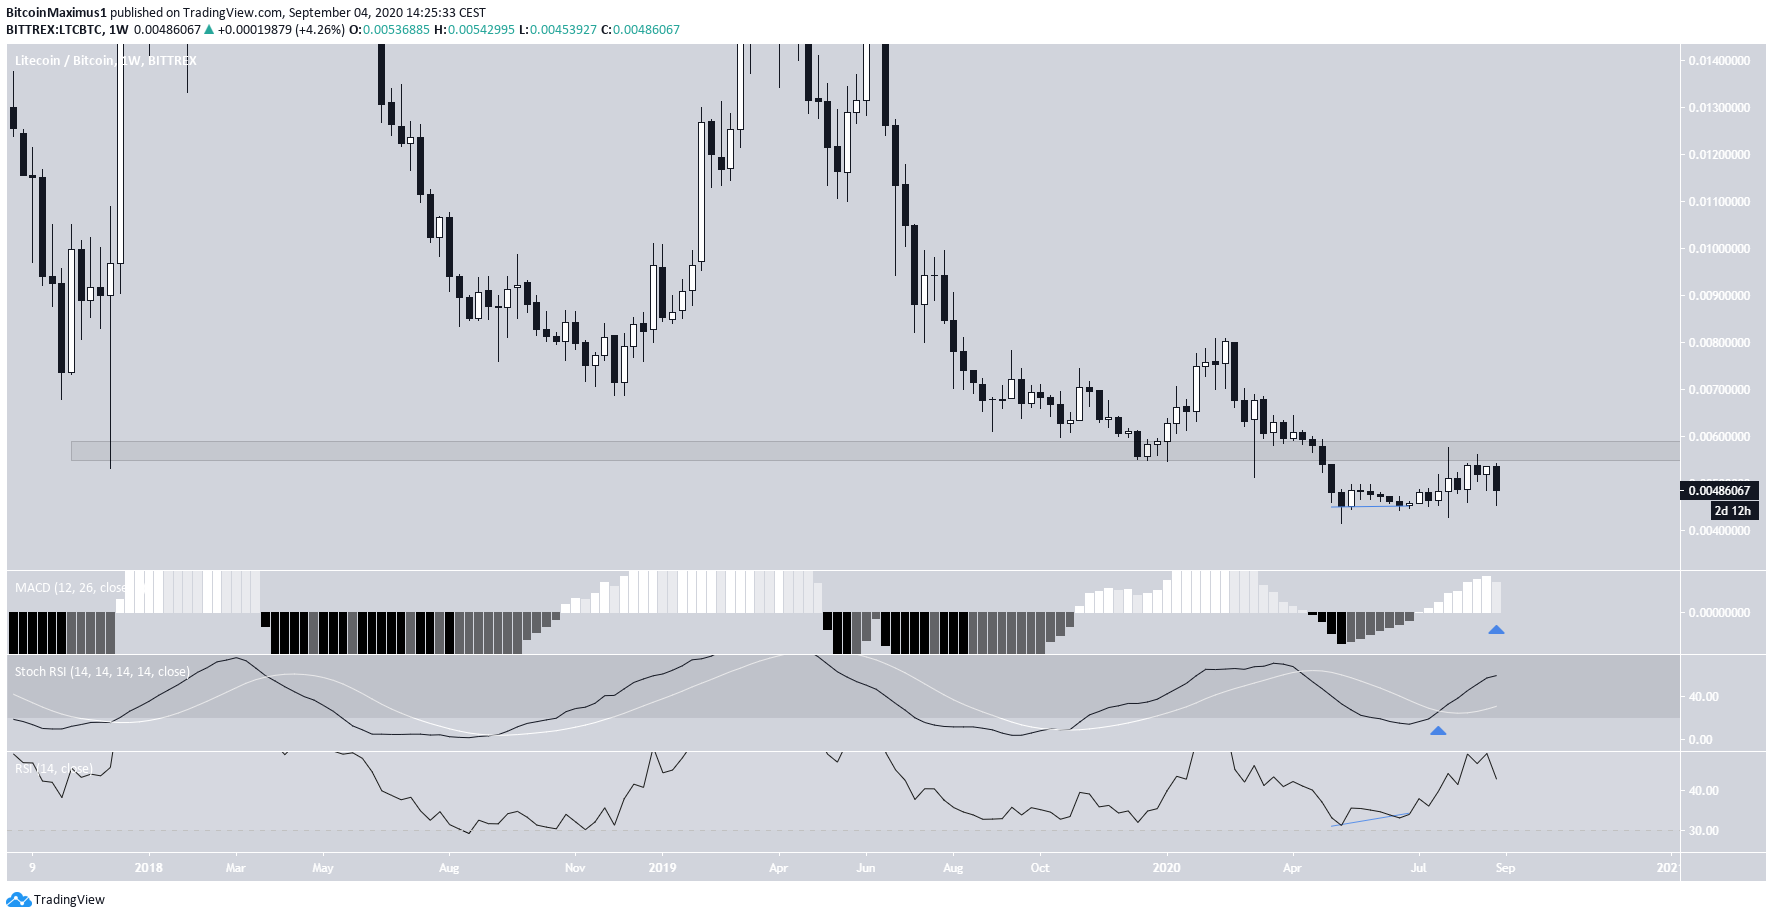
Litecoin/Bitcoin
Cryptocurrency trader @filbfilb outlined an LTC/BTC chart which shows that the price is trading very close to its all-time low levels.
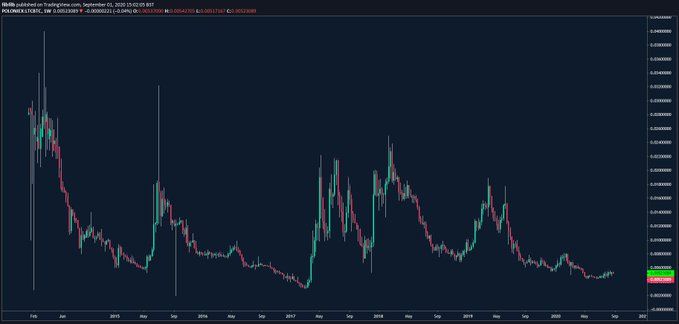
While this is true, the price has lost a key support level at ₿0.0057, which is now acting as resistance. Until LTC successfully reclaims this level, the price action cannot be considered bullish.
If the price does reclaim it, the current decline can be considered a deviation below the range low. Technical indicators are relatively bullish. The RSI has formed bullish divergence, and the Stochastic RSI has made a bullish cross.
The MACD is increasing, and even though it’s in the process of generating a lower bar, there are three more days until the weekly close.
If the price reclaims the ₿0.0057 level, it should move upwards towards ₿0.008.