
In this article, BeInCrypto takes a look at the price movements of Litecoin (LTC) and measures the increases and losses each year to see how it measures up in 2021.
The most bullish year for Litecoin was 2017 when it increased by 5,455%. So far in 2021, it has moved upwards by 195%.
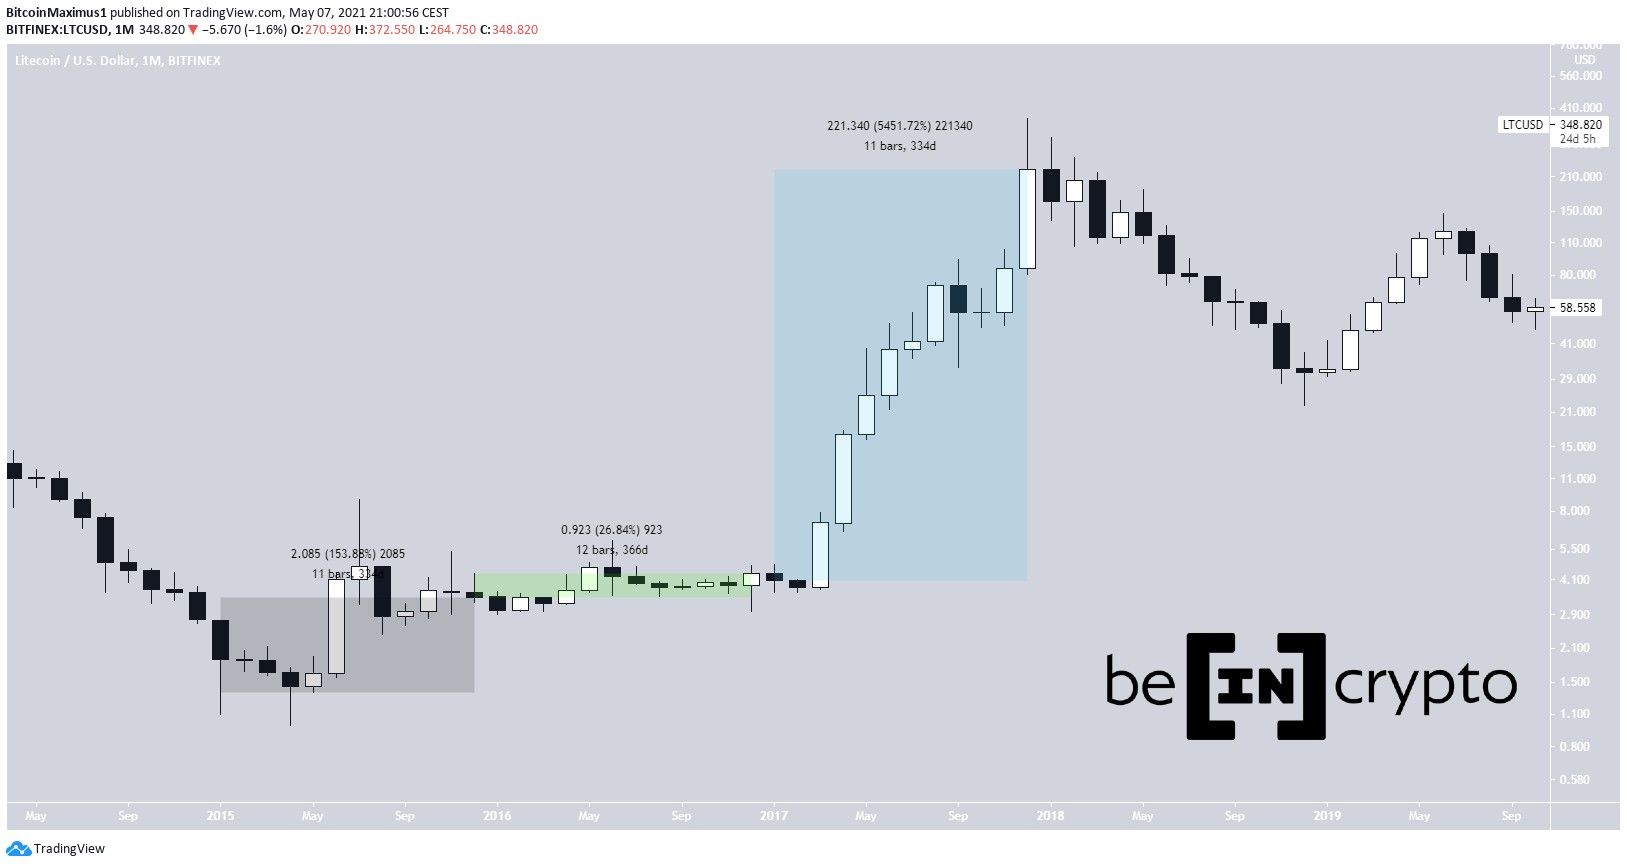
Litecoin 2015-2018
A significant market cycle transpired for LTC in 2015. At one point, the price had increased by 827%, reaching a high of $8.96. However, it proceeded to close at $3.44, an increase of only 154%. While still significant, it paled in comparison to that of the yearly high.
In contrast, 2016 was a very uneventful year for the price movement. There was very little volatility, and the price increased by only 27% over the course of the year, closing at $4.36.
2017 was the most bullish year in the price history of LTC to date. LTC created bullish candlesticks almost every month, culminating with a then all-time high daily close of $370 reached in December 2017. However, it closed the year at a slightly lower price of $225, which amounted to an increase of 5,451% on the year.
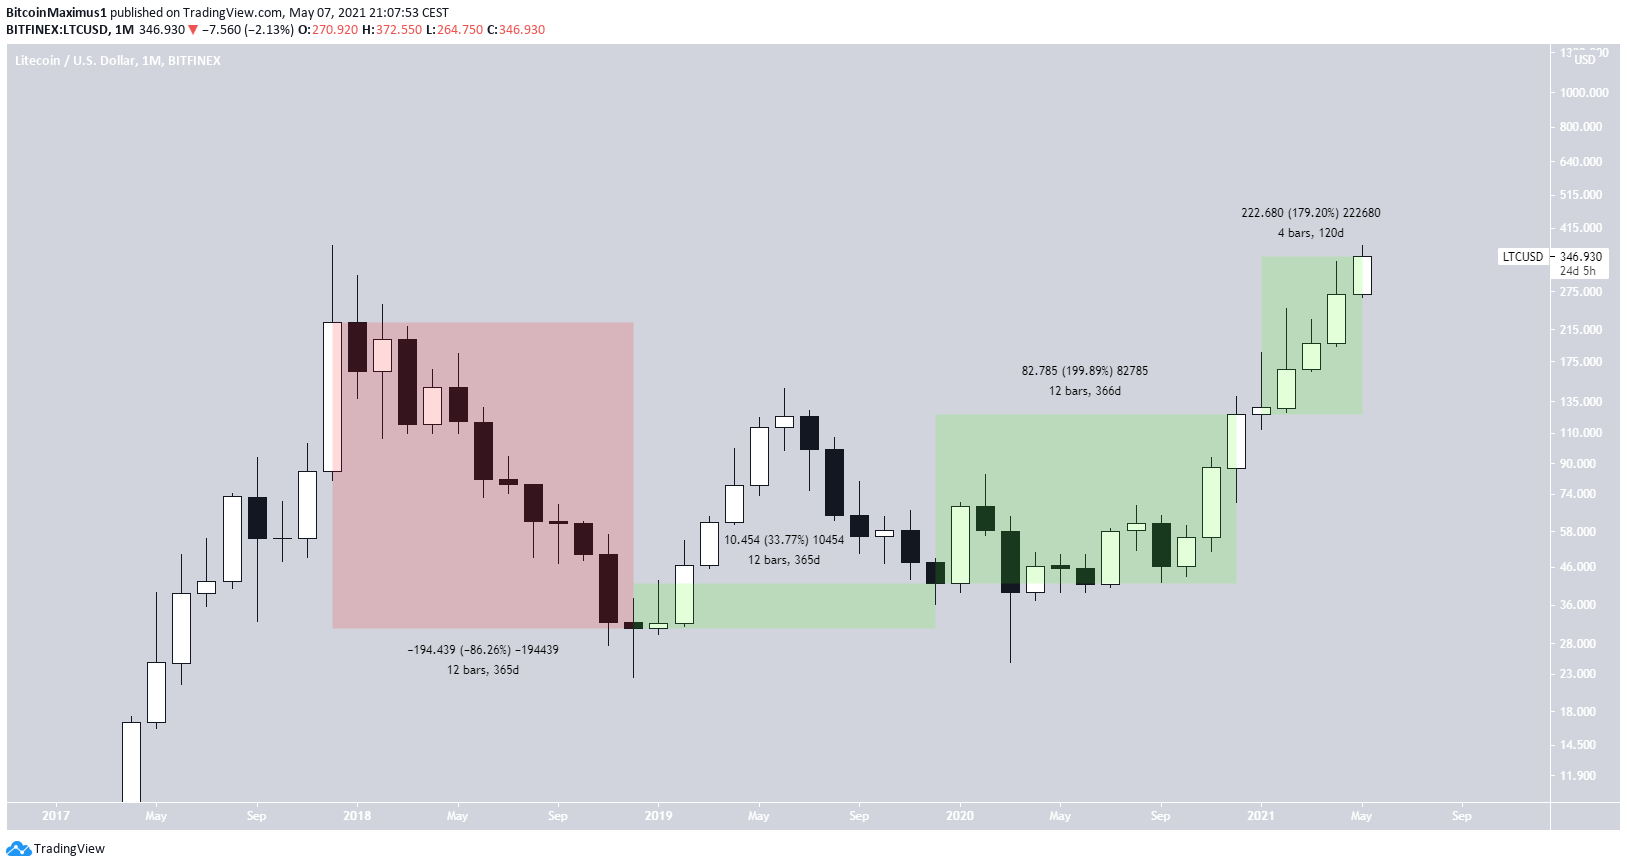
LTC 2018-present
In 2018, LTC underwent a significant correction. It decreased by a whopping 86.3%, closing the year at $30.61. With the exception of February and April, it had a bearish close every month.
The next year, it increased considerably, reaching a high of $146.95. However, the higher prices could not be sustained, and the ensuing correction left LTC with an increase of only 33.77% during the year.
2020 was also a bullish year. After a correction between February and March, LTC rallied and managed to reach a close at $124. This amounted to an increase of 200%.
So far in 2021, the price has moved upwards by 195% and is trading hands for $393.
Conclusion
Throughout its price history, LTC has increased by:
- 2015: 154%
- 2016: 27%
- 2017: 5,452%
- 2018: -86%
- 2019: 34%
- 2020: 200%
- 2021: 195%
