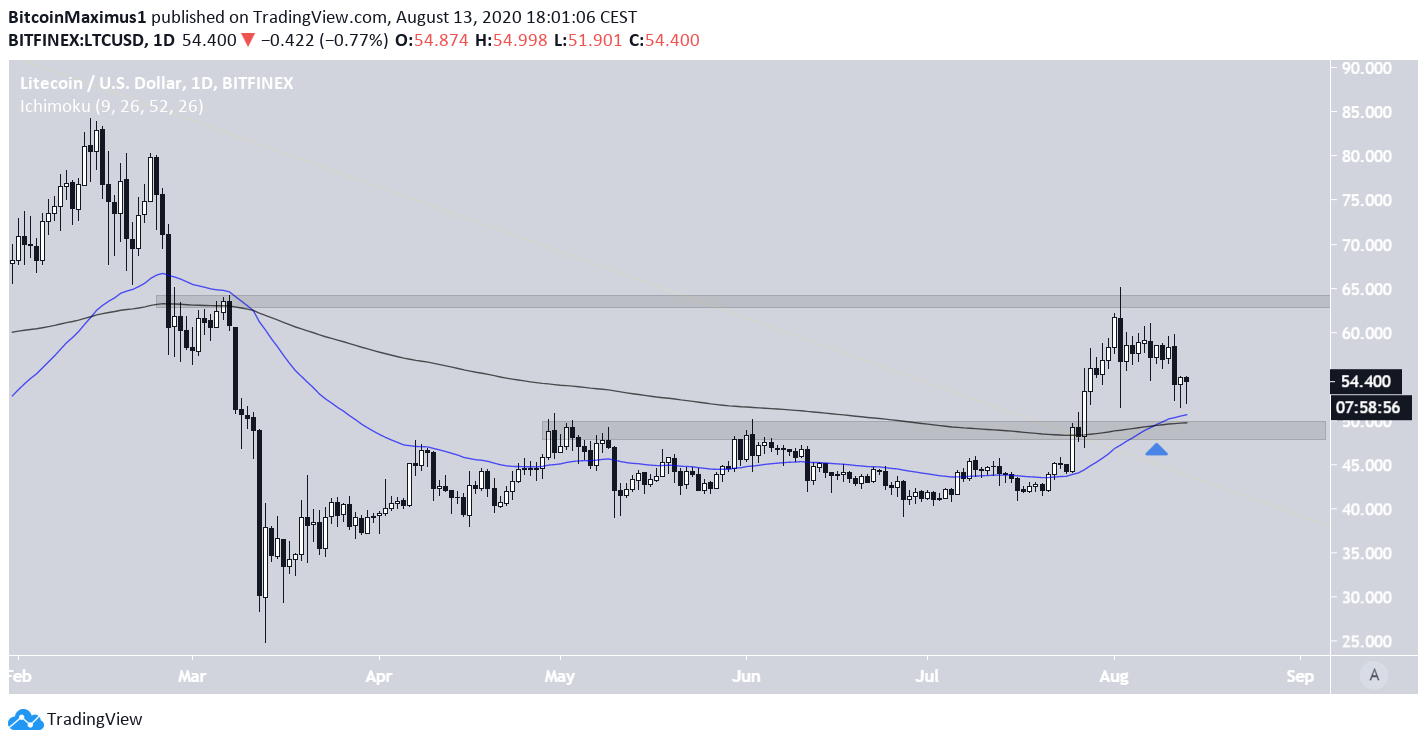
The Litecoin (LTC) price has been correcting since a sharp rejection from $65 on Aug 2.
Until the price is able to break out from the short-term resistance levels that we will outline below, LTC’s movement is likely to be corrective.
Litecoin Resistance and Support Levels
On July 27, Litecoin was finally able to break out above the $49 area, which had been providing resistance since the marketwide crash of mid-March.
The price was able to reach a local high of $65.10 on Aug 2 but was sharply rejected into a corrective move.
LTC was able to recover from a daily low of $51.90 yesterday to close slightly above $57. LTC is still trading above the 50 and 200-day moving averages (MA), which have made a bullish cross.
As long as the price is trading above this level, the trend is considered bullish and LTC is expected to make another attempt at breaking out above the $64 resistance.
Possible Bounce
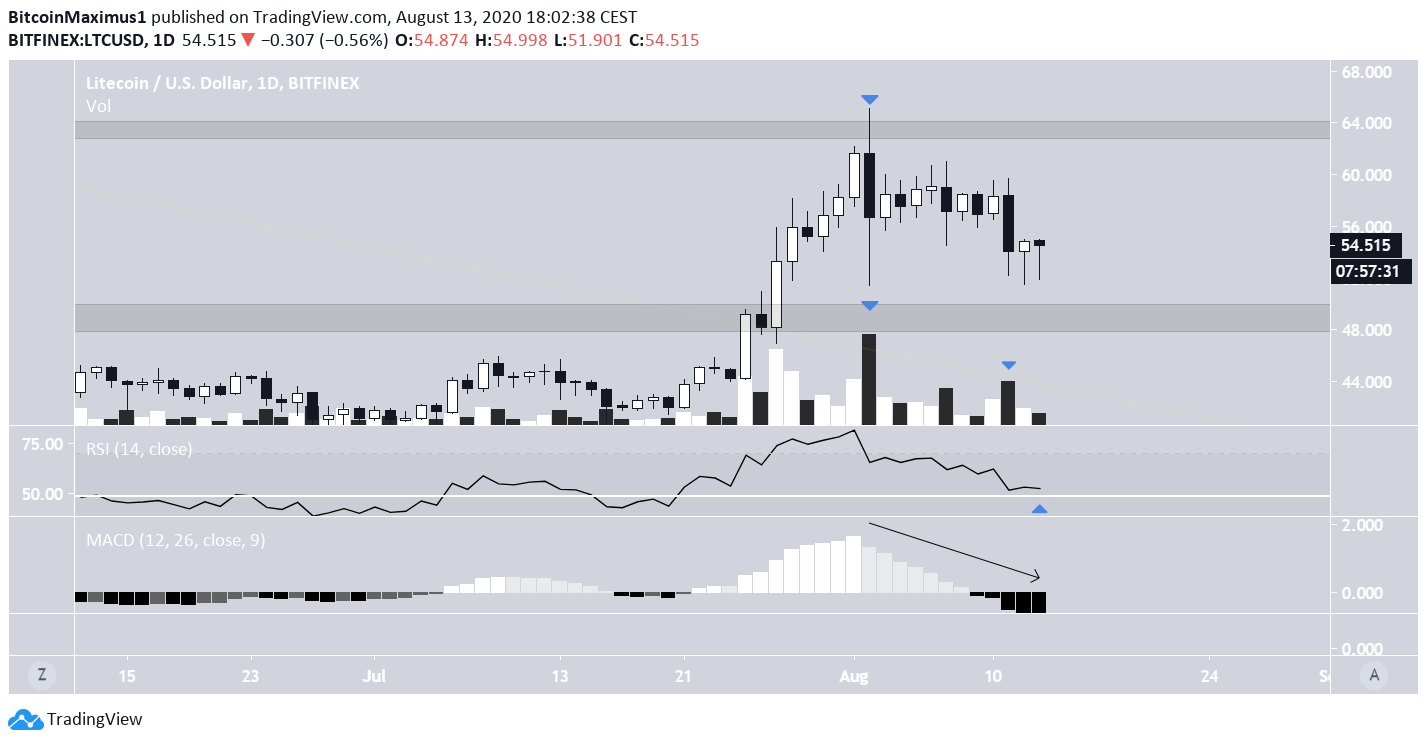
A closer look at the daily movement shows that the bearish engulfing candlestick of Aug2 transpired with significant volume.
However, the recent bearish candlestick on Aug 11 had considerably less volume, even though it had a lower close. This can be viewed as a sign that the previous downward trend is losing steam.
While the MACD has been decreasing, currently being bearish, the RSI has held above 50, indicating a possible bounce.
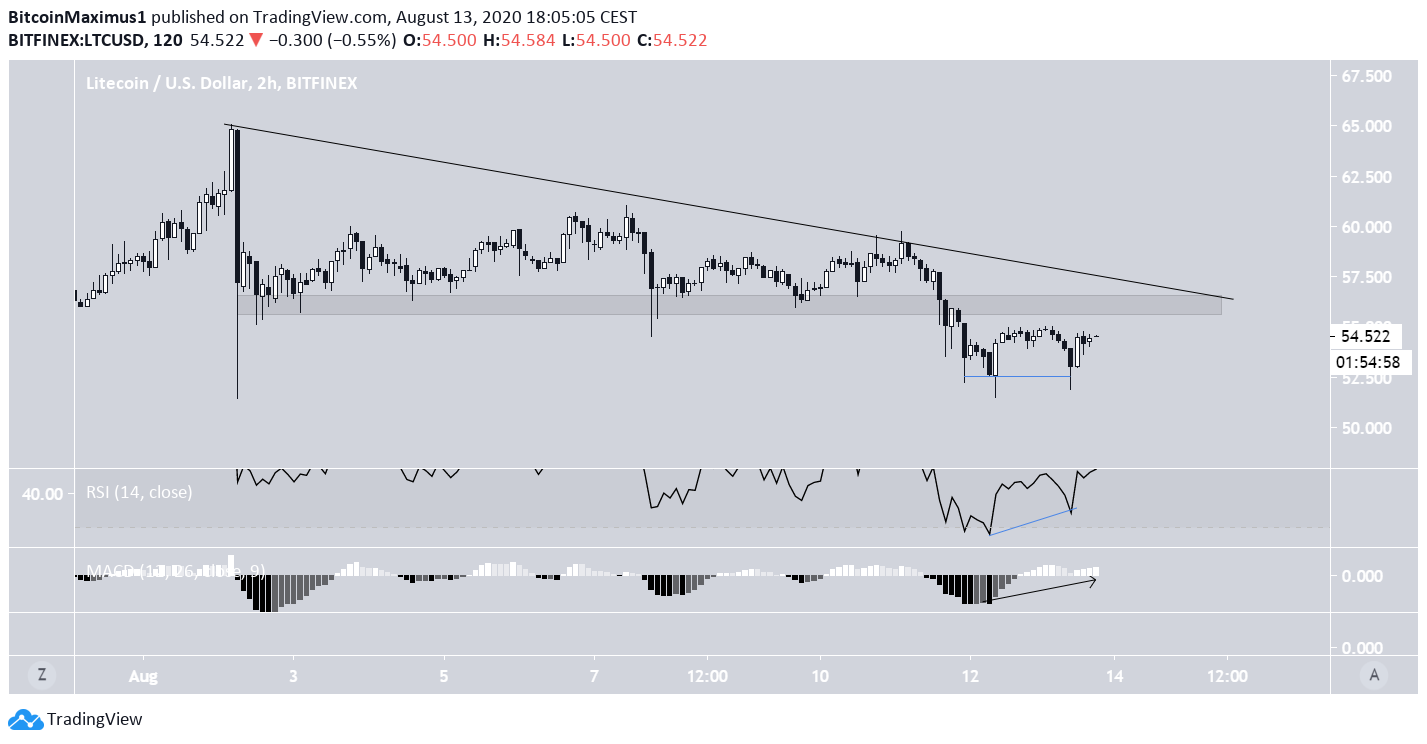
The short-term chart supports the possibility of a bounce since both the RSI and MACD have been generating bullish divergence and the price has already created a double-bottom.
Until the price flips the $56 minor resistance area and the short-term descending resistance line, however, its movement is still considered bearish. A breakout above these two levels would indicate that the correction has officially ended.
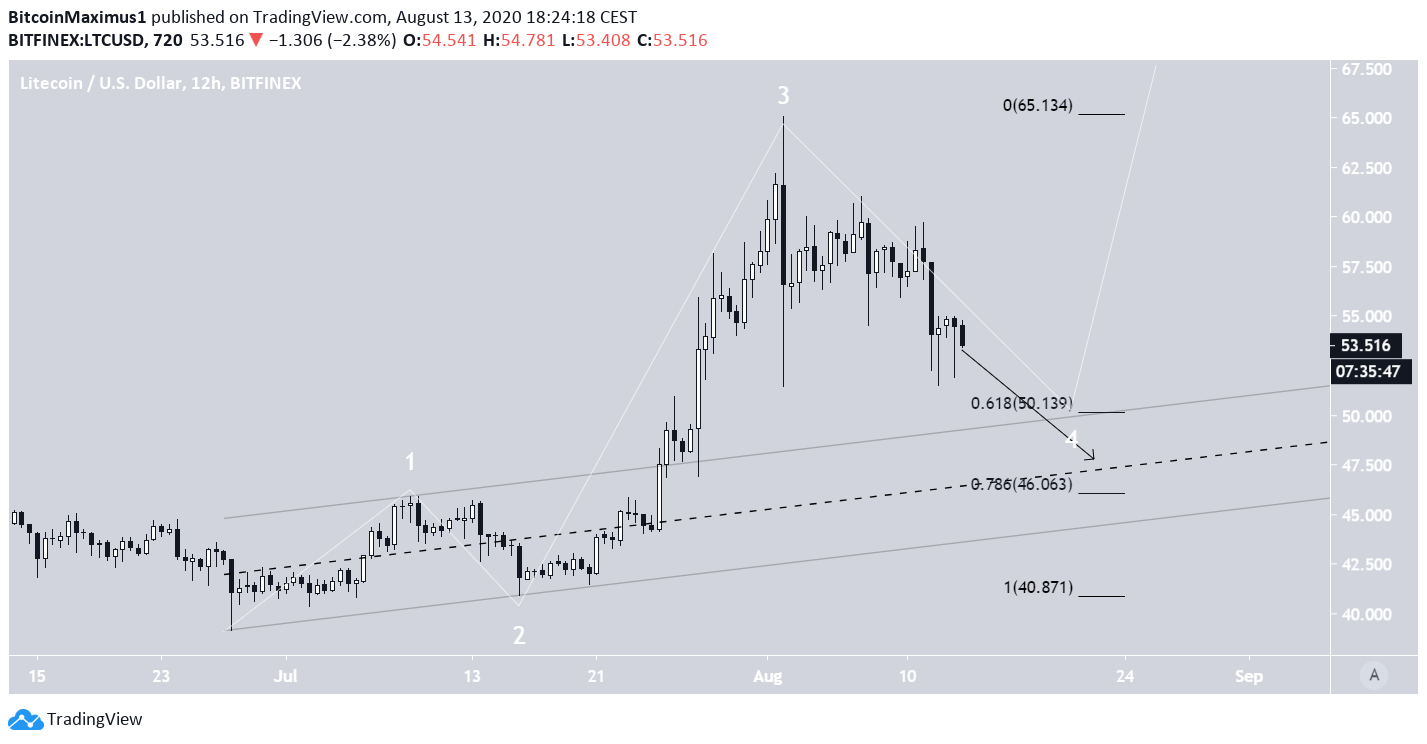
Wave Count
Cryptocurrency trader @Glowto1994 outlined an LTC chart, stating that the price would likely go to $62 before decreasing back towards $50.0.
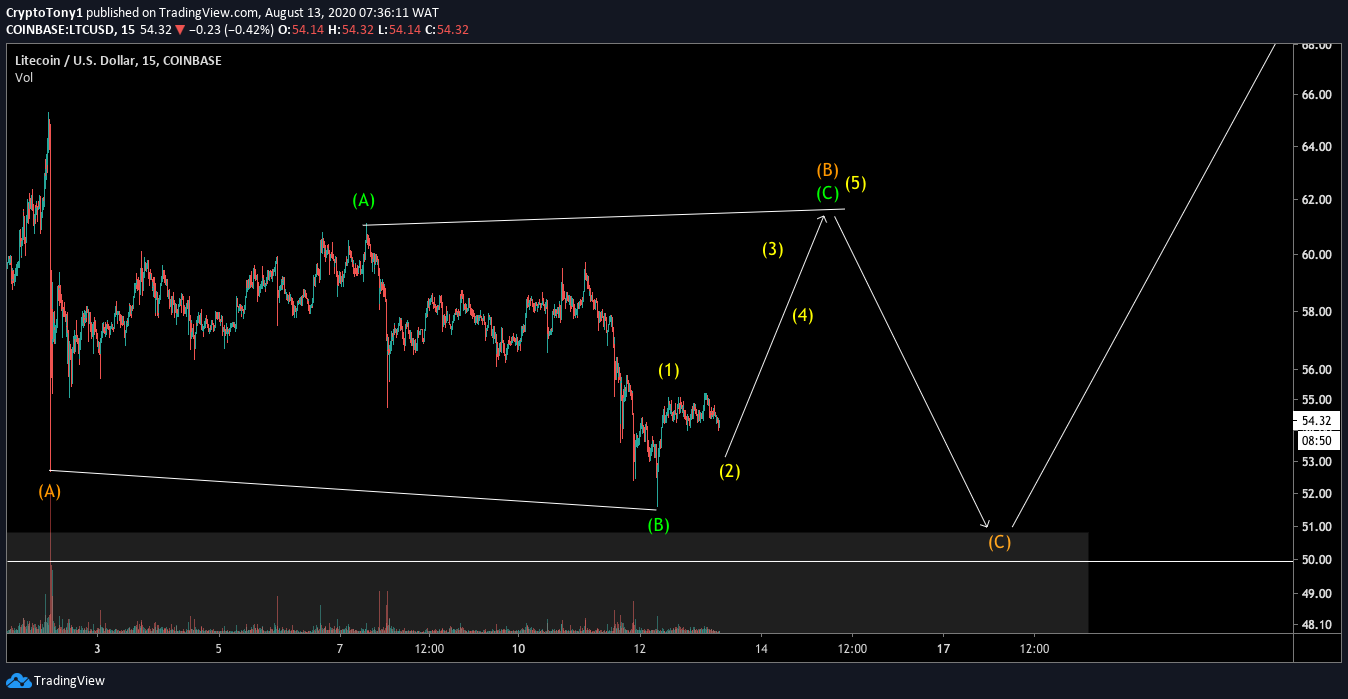
However, our wave count is slightly different and shows that the price has likely completed its third wave during the aforementioned high of Aug 2, and is currently correcting inside the fourth wave.
This wave would be expected to end at $50, the 0.618 Fib level of wave 3, and the resistance line of a parallel channel that the price has broken out from.
The next probable level for the bottom of wave 4 would be $46. This zone is the 0.786 Fib level and middle of the same parallel channel.