


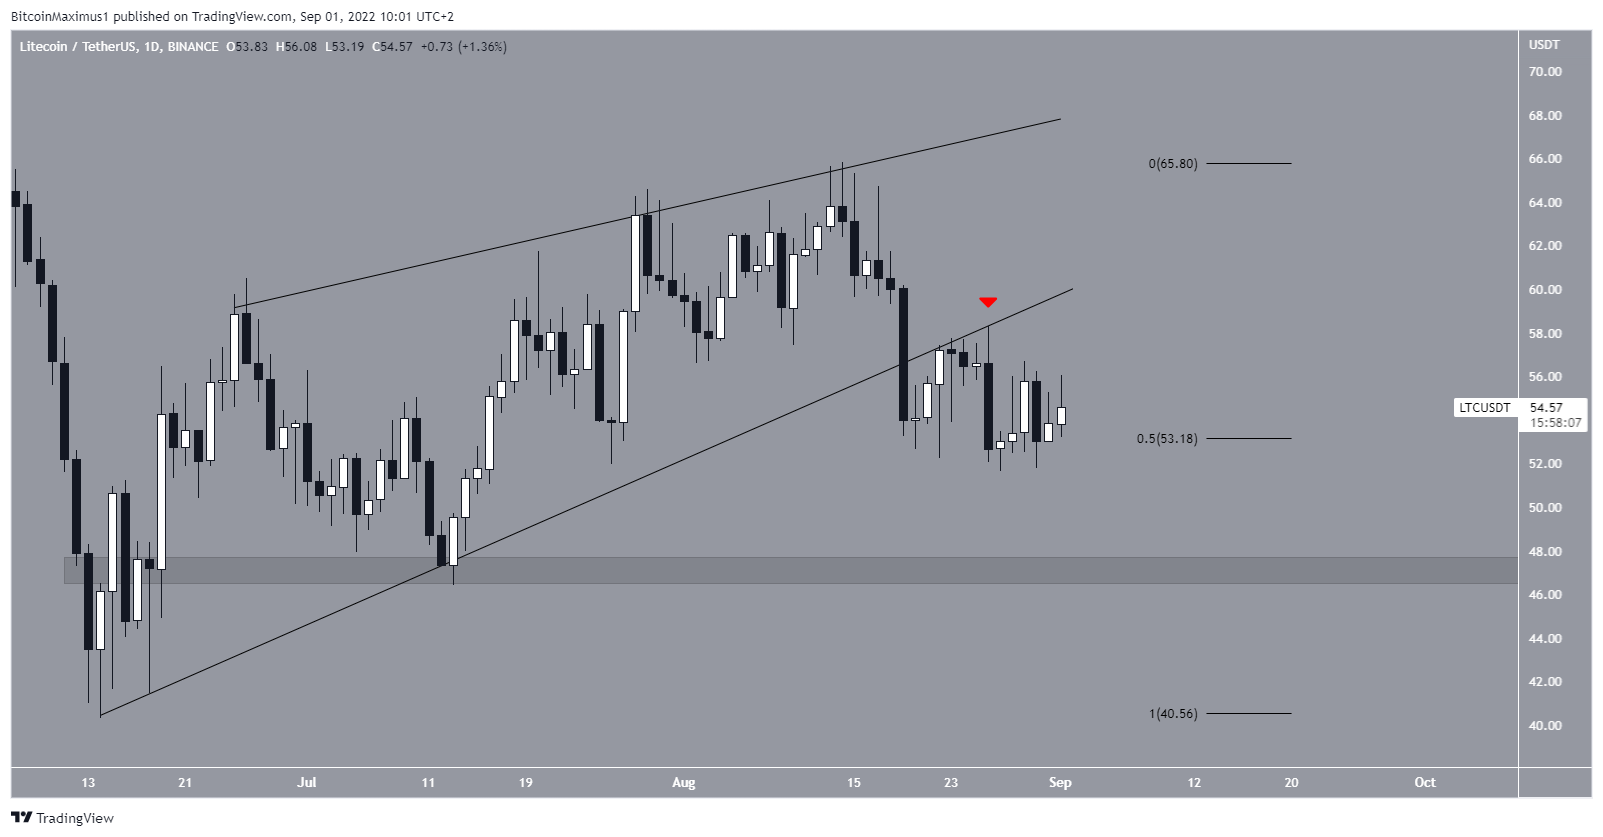
Litecoin (LTC) has broken down from an ascending wedge that has been in place since the June lows. It is possible that it will fall towards new yearly lows.
LTC had been increasing inside an ascending wedge since reaching a low on June 14. The wedge is considered a bearish pattern, meaning that a breakdown from it would be the most likely scenario.
While trading inside it, the price reached a high of $65.80 on Aug 24. However, it was rejected by the resistance line of the wedge and has been decreasing since. Litecoin broke down from the wedge on Aug 19 and validated it as resistance seven days later (red icon).
Currently, LTC is attempting to hold on above the 0.5 Fib retracement support level at $53.20. If the price decreases below the 0.5 Fib retracement support level, it could fall to the next support area at $47.
Potential LTC breakout
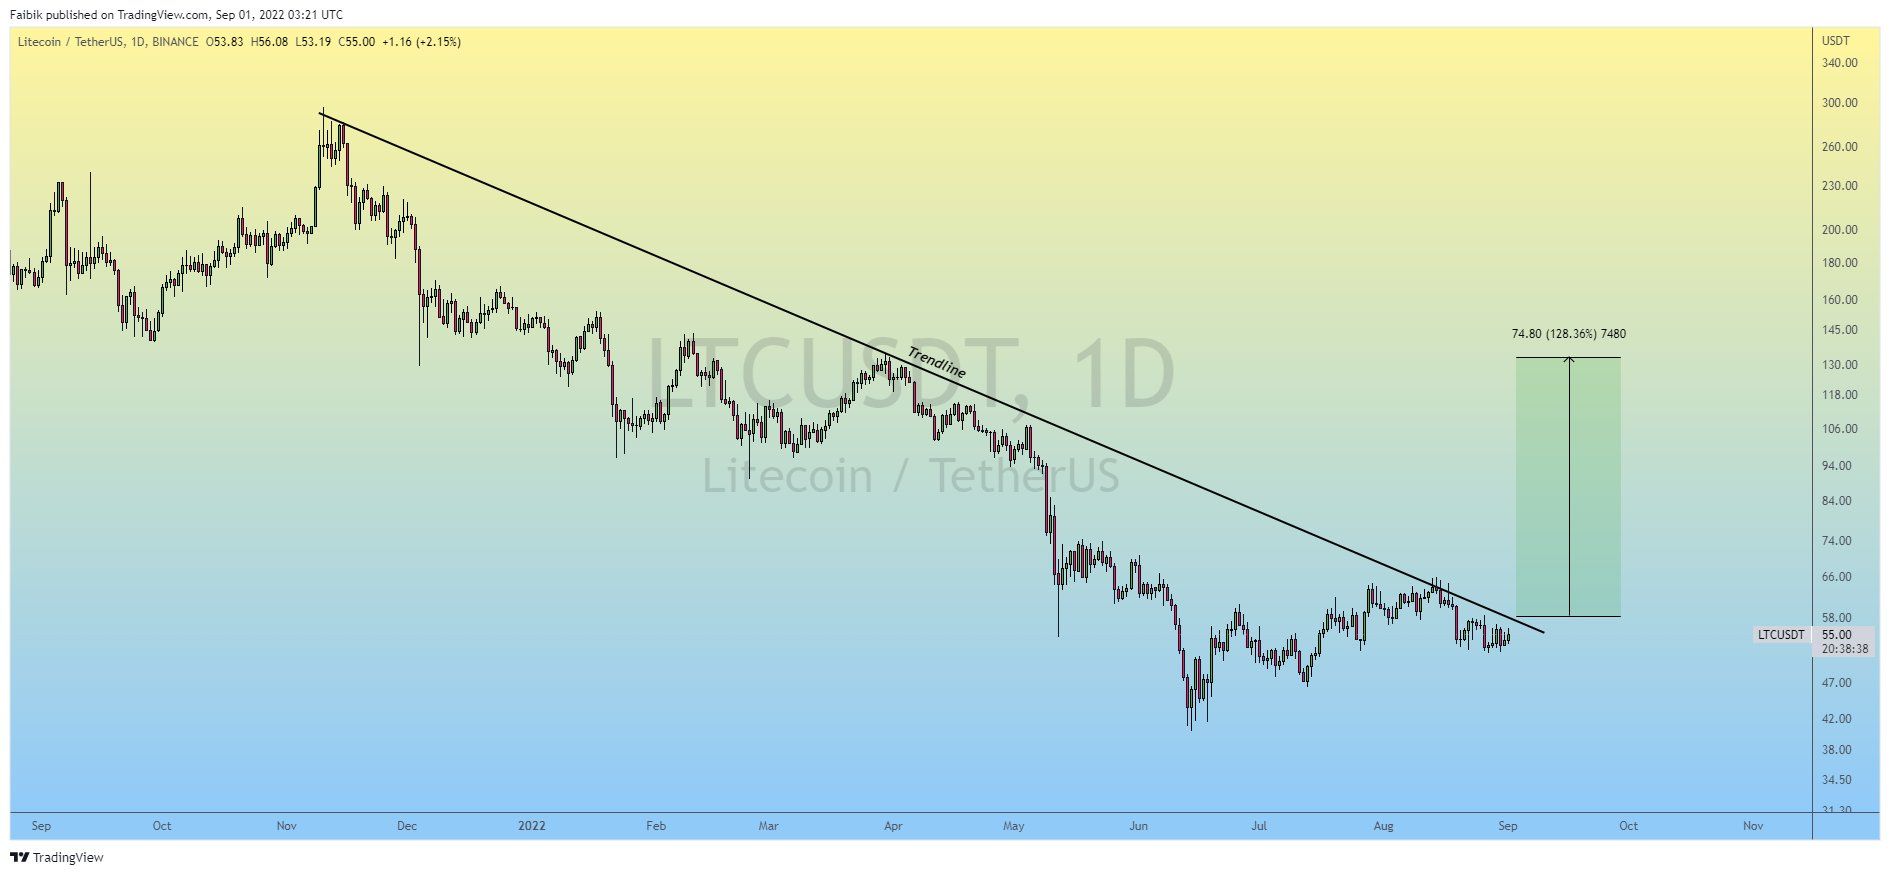
Cryptocurrency trader @CryptoFaibik stated that he expects LTC to increase all the way to $130 after breaking out from its descending resistance line.
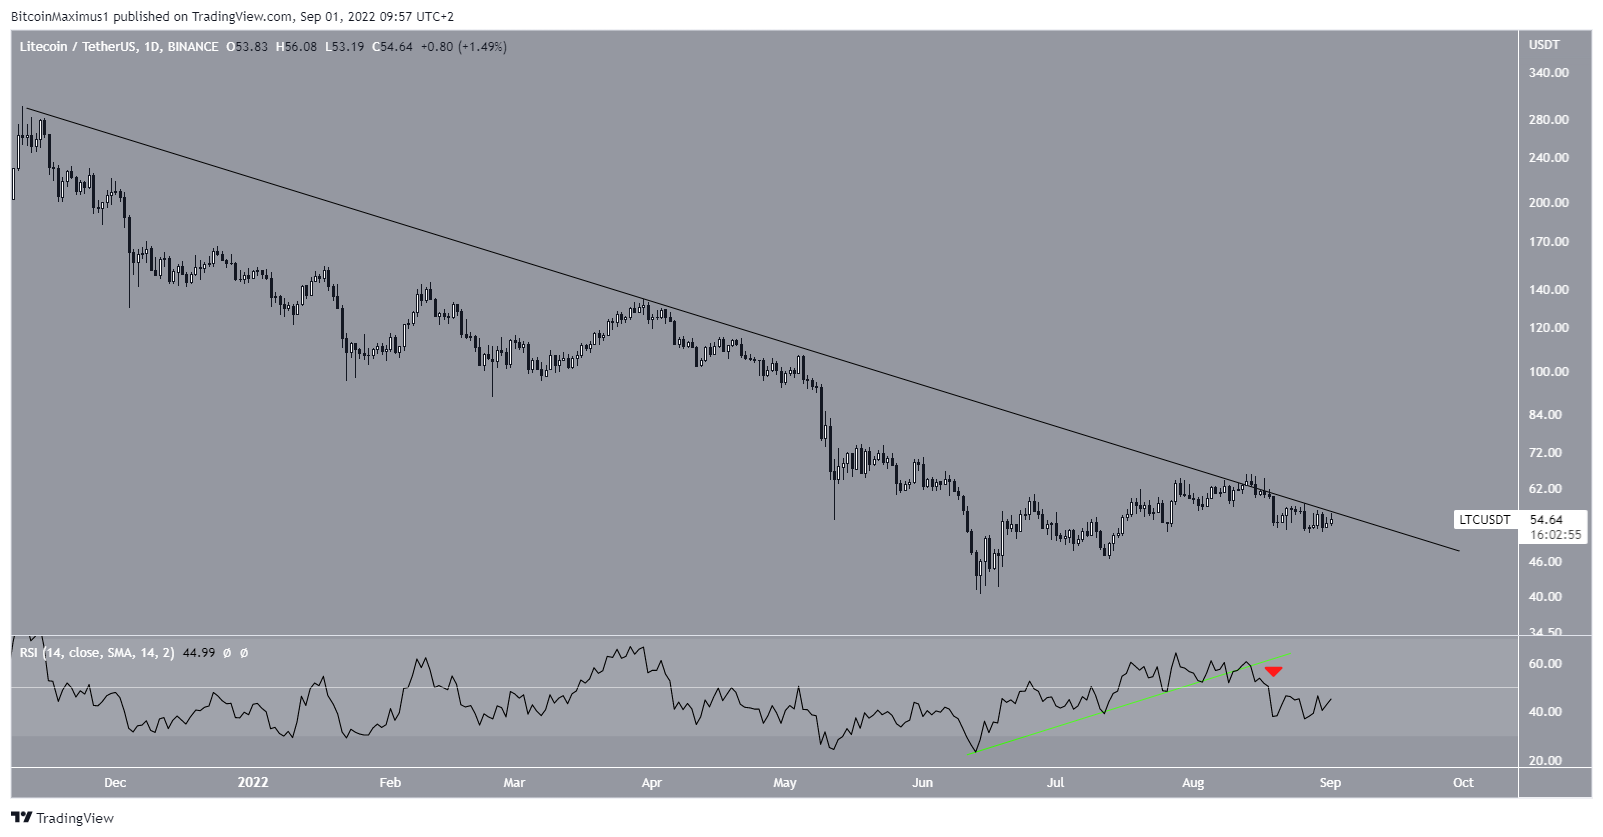
However, the line is only visible in the logarithmic chart. Furthermore, the daily RSI is bearish. It has broken down from an ascending support line (green) and then fallen below 50 (red icon).
As a result, it is not certain that LTC will break out from this line, even though it has made numerous attempts breaking out so far.
Wave count analysis
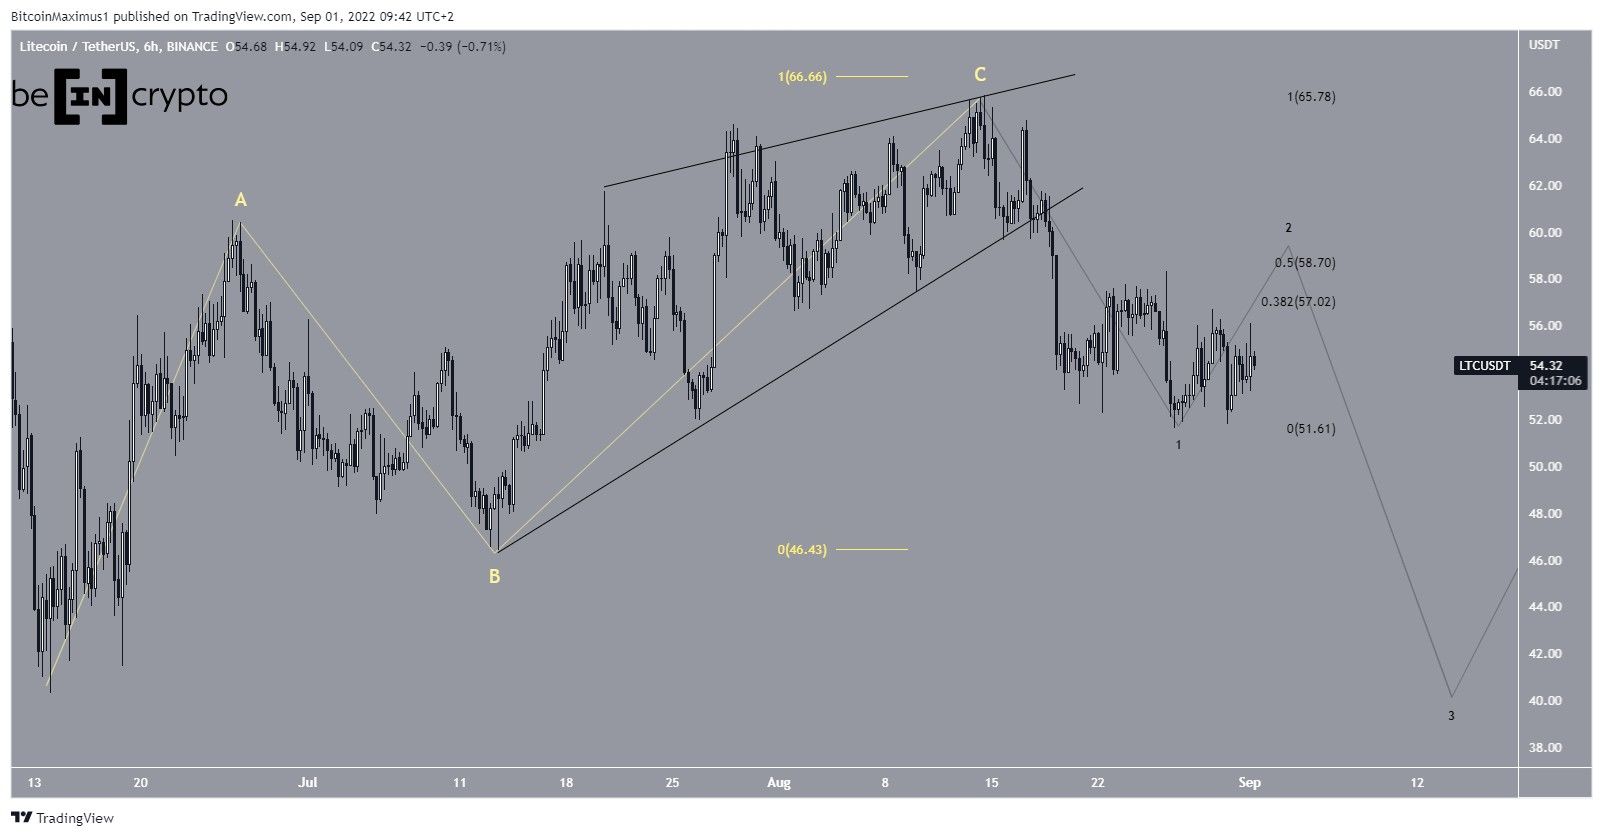
The wave count does seem to be bearish. It shows that since its June lows, LTC has completed an A-B-C corrective structure (yellow). In it, waves A:C had an exactly 1:1 ratio, which is common in such structures. Additionally, wave C developed into an ending diagonal, hence the shape of the ascending wedge.
If correct, the price has begun a new downward movement (black) and completed wave one of this decrease. So, the ongoing bounce is likely part of wave two, which could end near the 0.5 Fib retracement level at $58.70. Afterward, another drop would be expected.
For Be[in]Crypto’s previous Bitcoin (BTC) analysis, click here


