


The Litecoin (LTC) price has been consolidating since a dip on Sept 3. The direction of the trend is not yet clear, and a movement outside of the current consolidation pattern is required before the trend can be determined accurately.
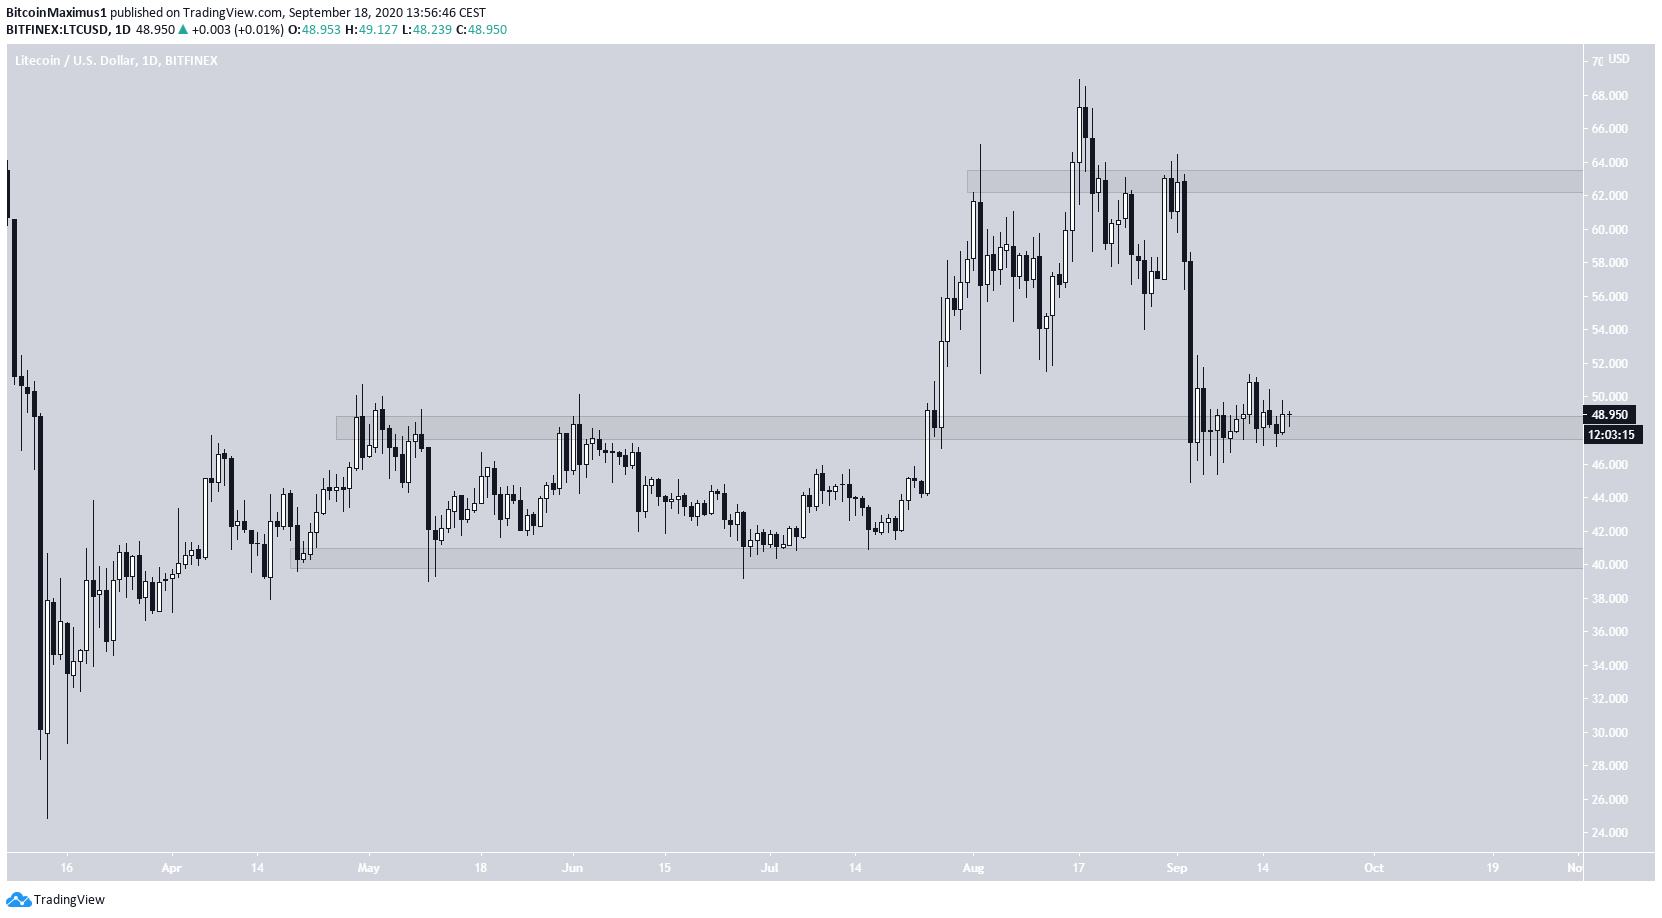
The Litecoin price has been decreasing since August 17, when the price was trading at $68.94. The decrease continued until the price reached a low of $44.48 on Sept 3. The price has been gradually increasing since. but has yet to move considerably above this support level.
Litecoin Major Support Levels
If the price breaks down, the next closest support area would be found at $40, while the closest resistance at $63.
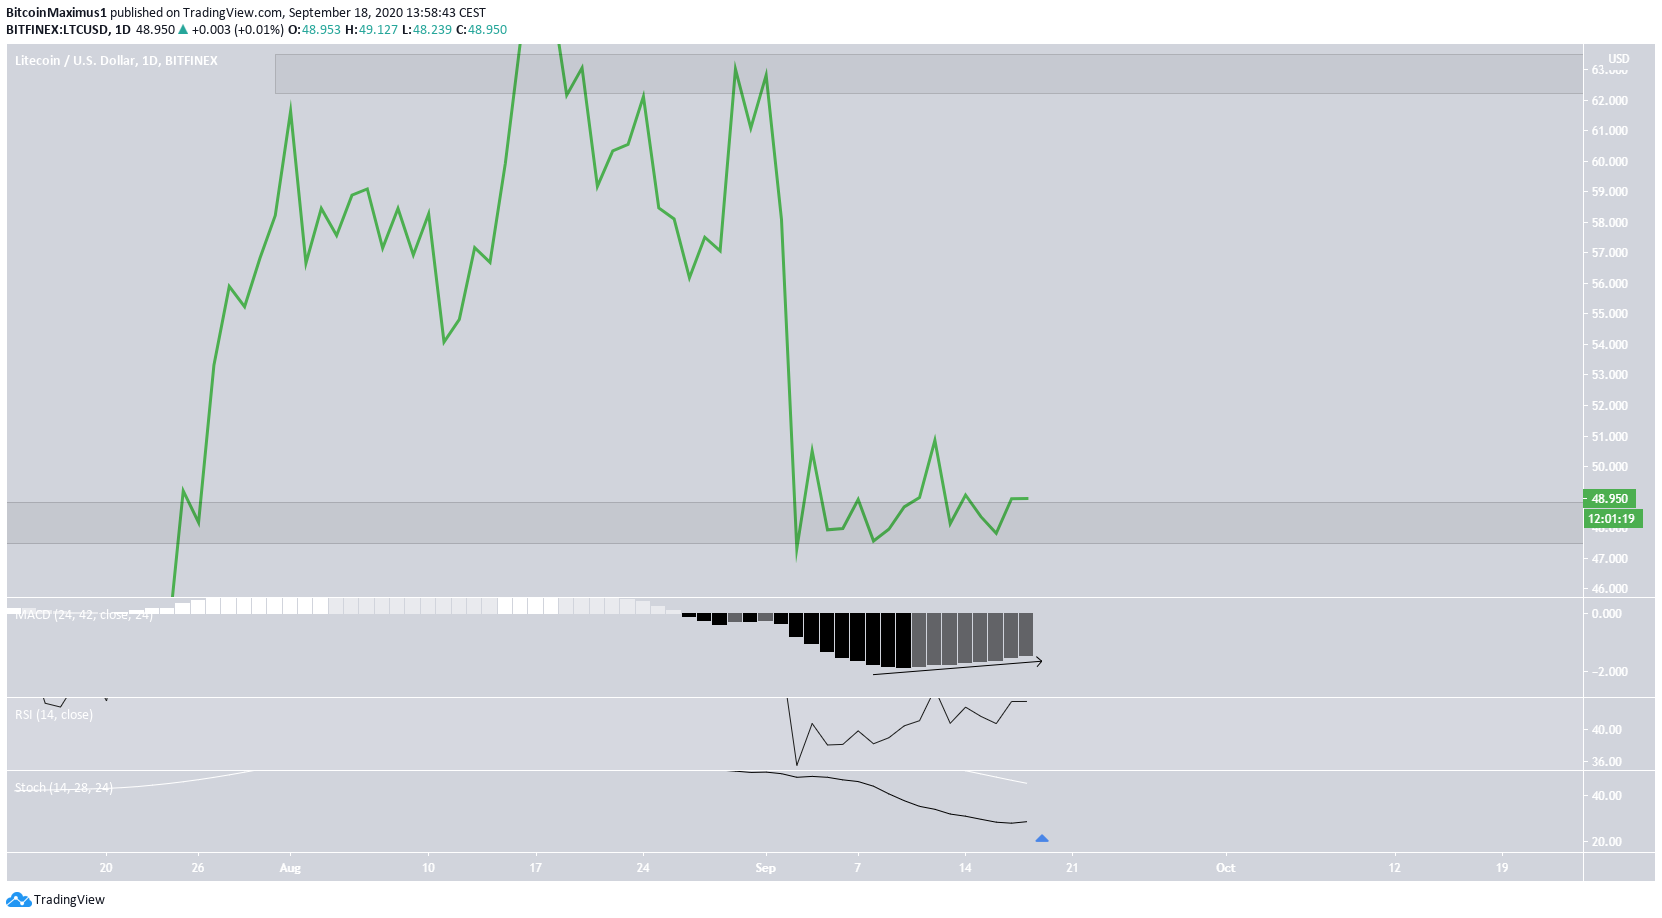
Technical indicators in the daily time-frame are neutral, slightly leaning on being bullish. While the MACD is increasing, it has not crossed into positive territory. In addition, the RSI has not generated any bullish divergence, nor has the Stochastic Oscillator made a bullish cross.
Short-Term Consolidation
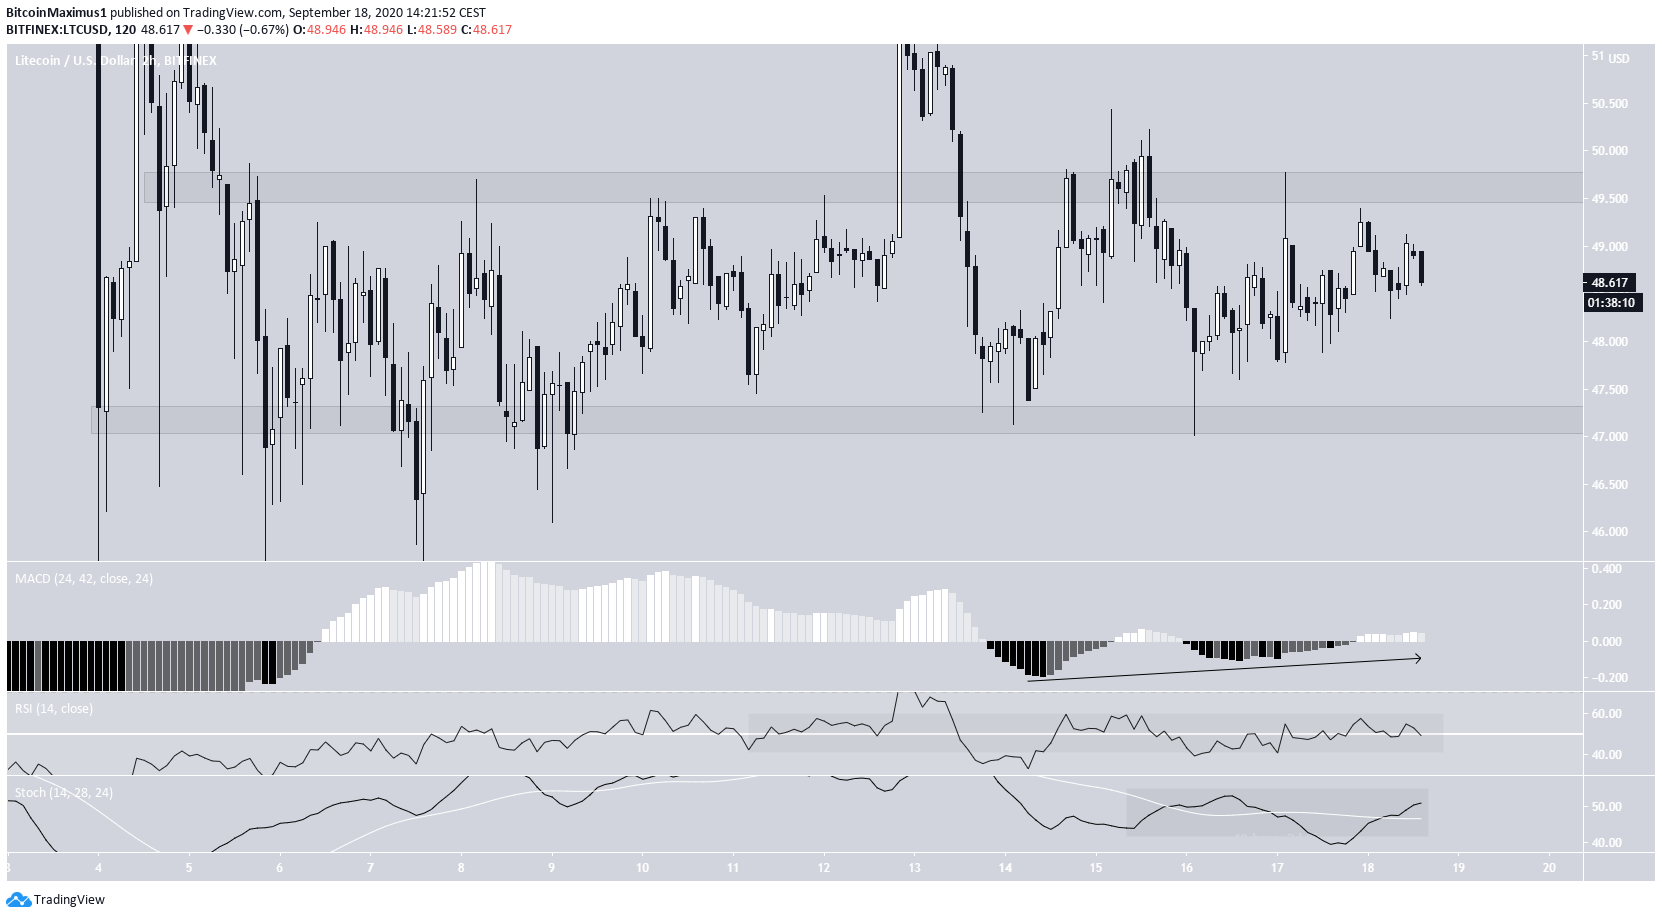
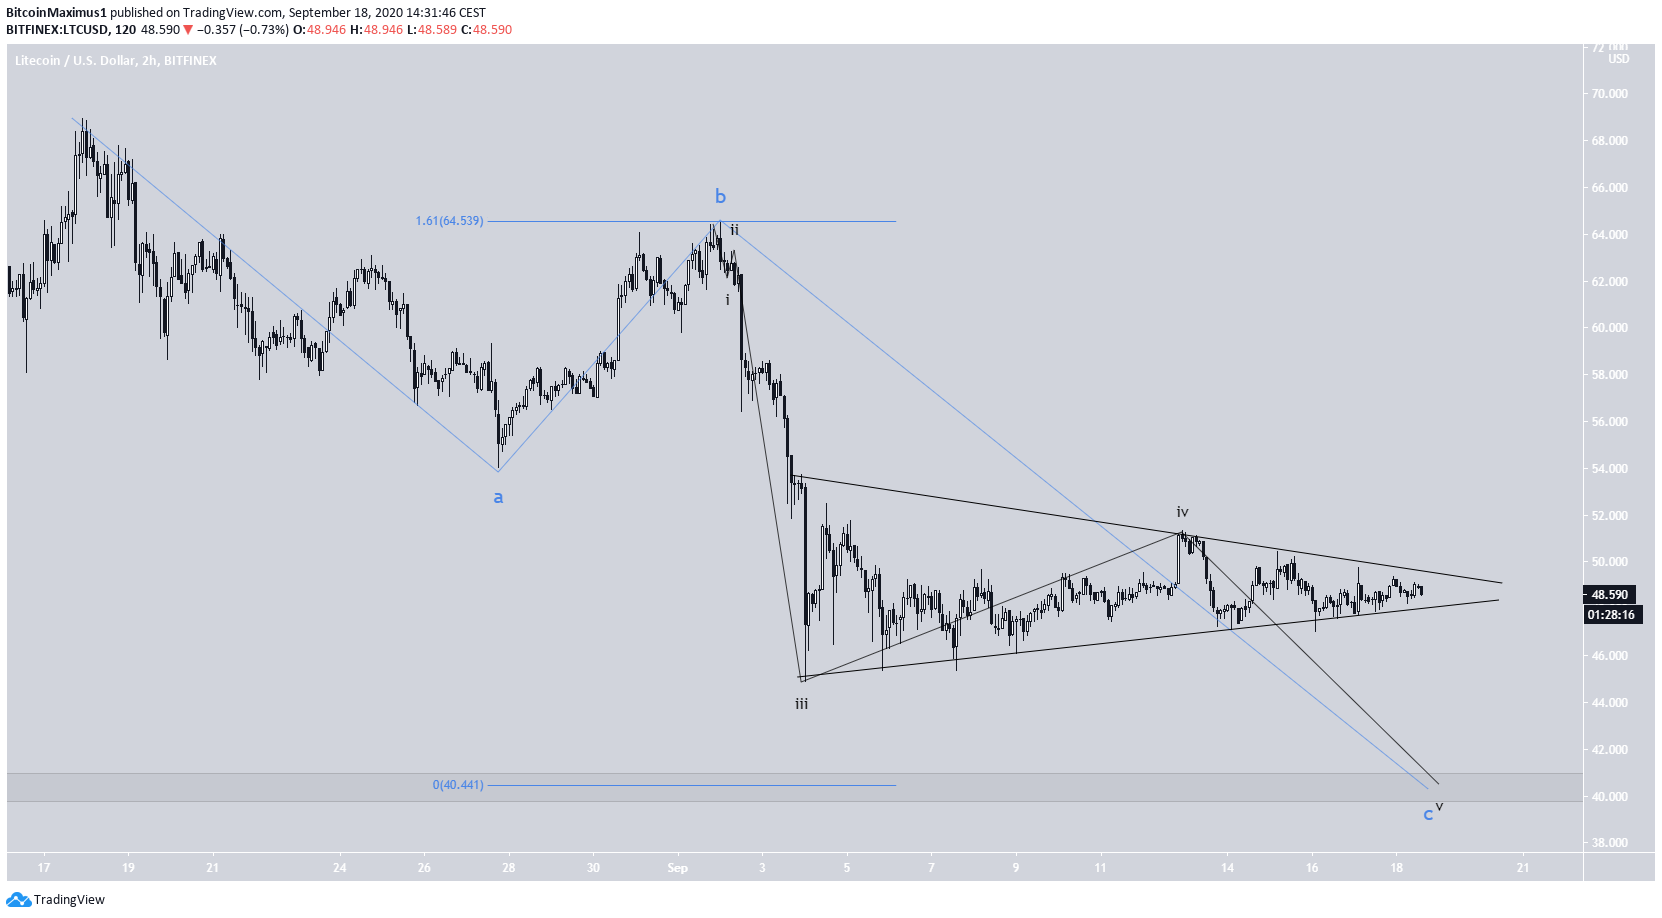
The two-hour chart shows consolidation between $47.60 and $45.20, with deviations on both sides. Technical indicators are neutral.
The RSI has been increasing above and below 50 almost at will, and the Stochastic Oscillator has made several bullish and bearish closes.
The current movement looks like a consolidation before a sharp move in one or the other direction.
Wave Count
Cryptocurrency trader @Crypto618 stated that the Litecoin chart does not look bullish, but likely has one more move down before the price could eventually resume its upward movement.
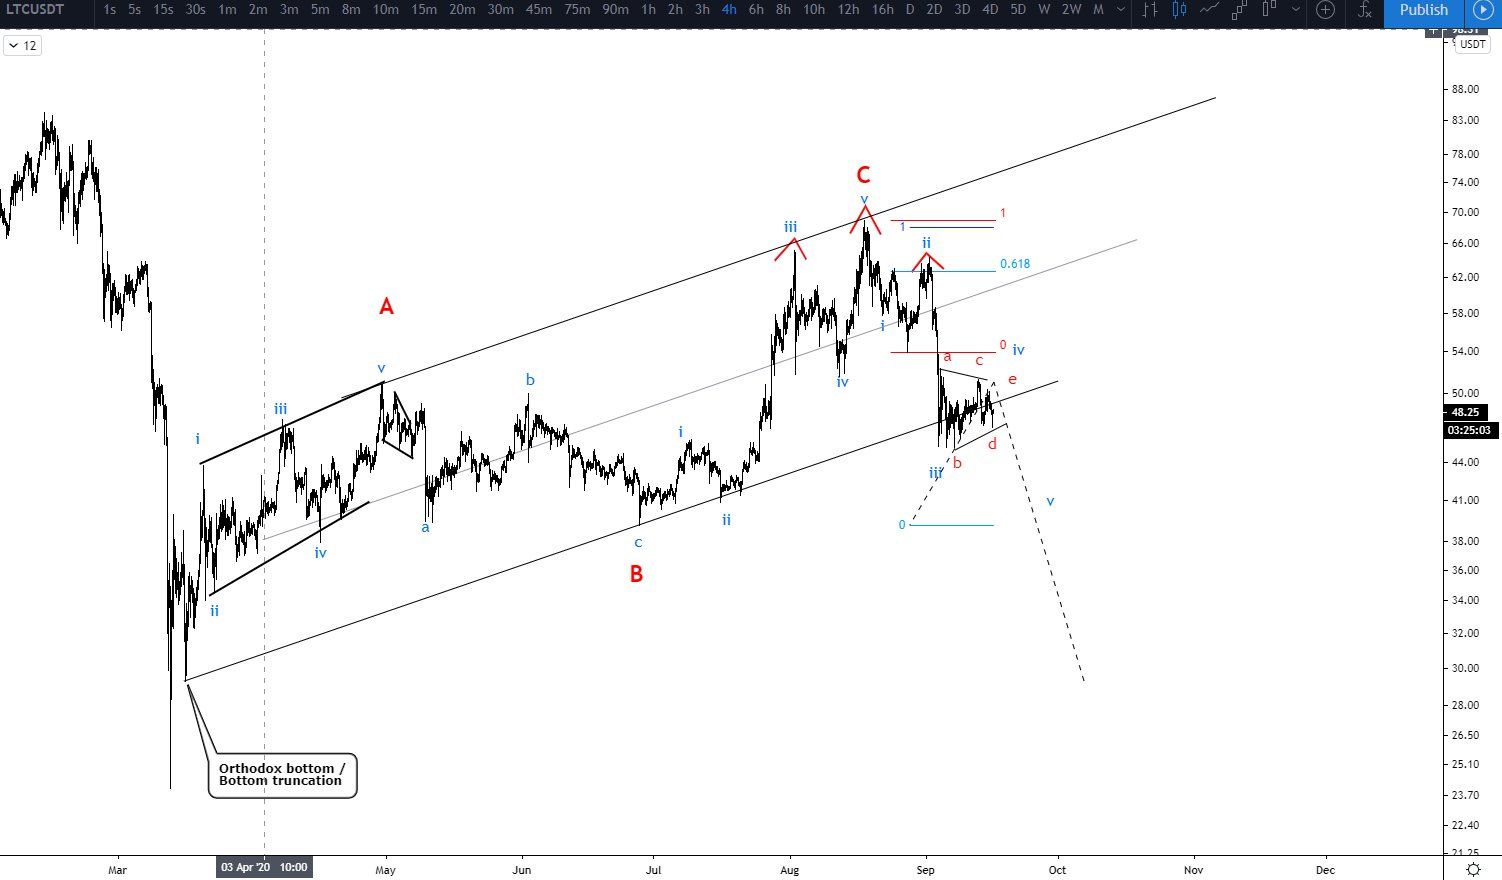
It is possible that since the Aug 17 high, the price has been correcting inside an A-B-C formation (shown in blue below).
If this is the correct count, the current movement would be some type of sub-wave 4 (in black), after which the price would decrease once more.
However, the movement inside the triangle has extended for a longer-than-usual period of time, casting doubt on the possibility that this is sub-wave 4.
A breakout or down from the triangle would be required in order to accurately determine the wave count since too many possibilities are legitimate at the current time.
LTC/BTC
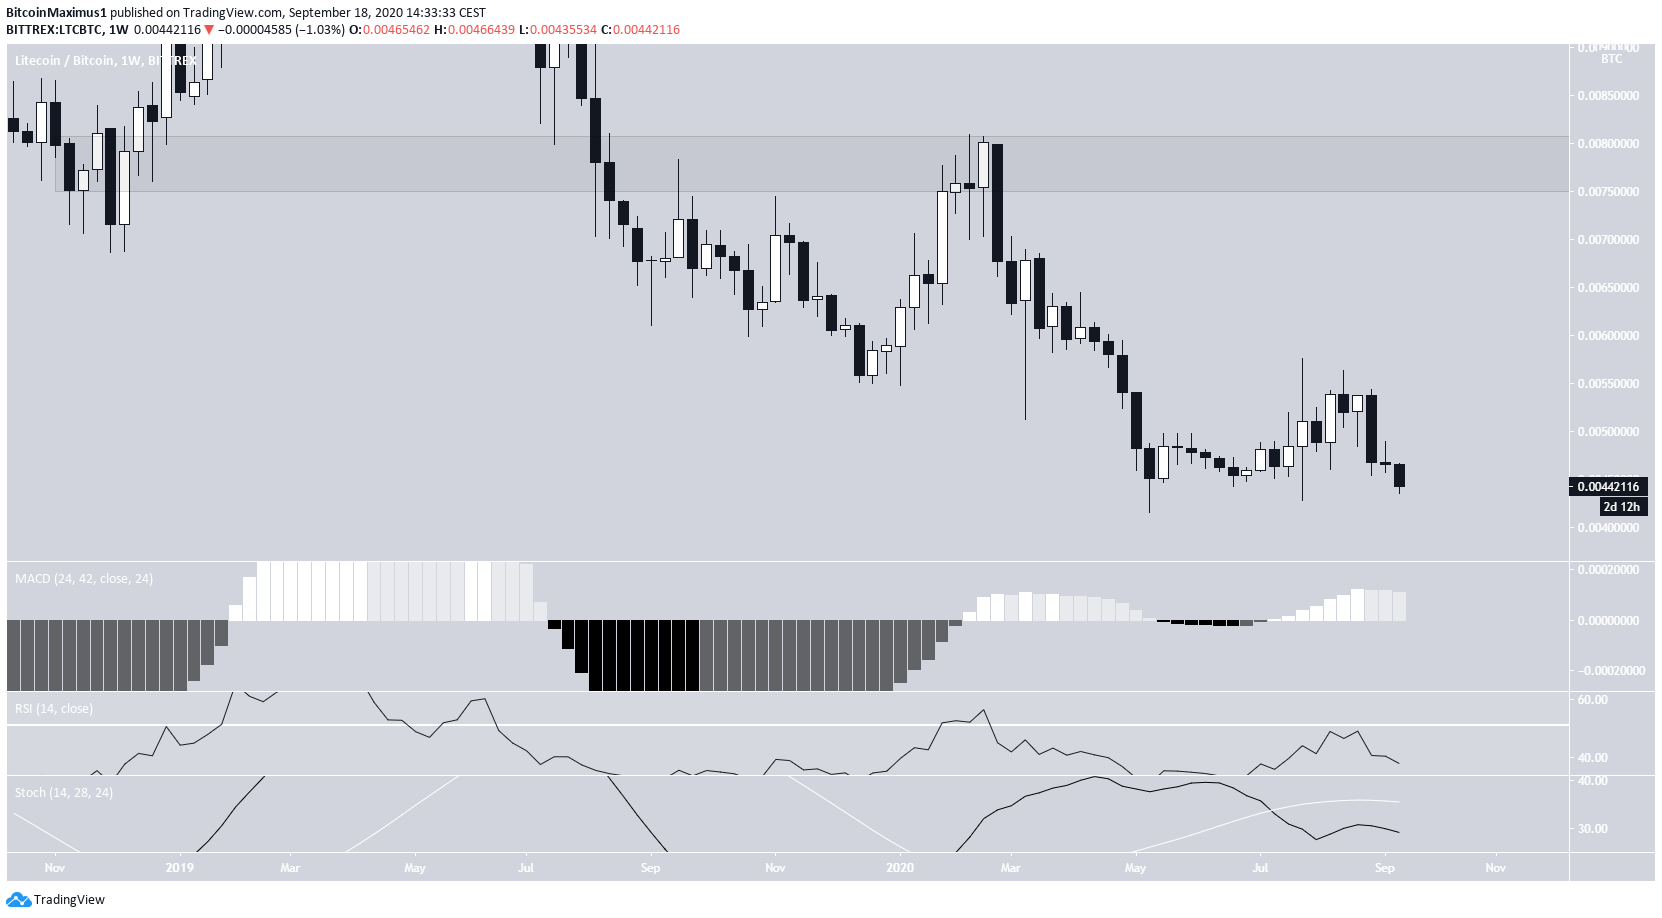
Similarly, the LTC/BTC chart shows indecision.
The price has been consolidating near ₿0.0045 since May. Technical indicators are completely neutral.
Therefore, more movement is required in order to accurately determine where the price will head to next.
To conclude, the direction of Litecoin’s next move is not clear, rather a breakout or down from the current pattern is required before a bullish or bearish case can be made.


