


The Litecoin price has been decreasing since Feb. 23, when it reached a high of ₿0.0080. But, the rate of decrease has slowed down considerably since Feb. 27 and the price has created a bullish reversal pattern.
Litecoin (LTC) Price Highlights
- There is support and resistance at ₿0.0067 and ₿0.0071, respectively.
- The price is following an ascending support line.
- It has found support above its 200-day moving average (MA).
- The price might have broken out above a descending wedge.
Well known trader @ACXtrades tweeted an LTC chart that shows an ongoing price decrease over the past 10 days. He has outlined the next support area at ₿0.0065 and believes the price will soon reach it.
UPDATE: $LTC
Oops. pic.twitter.com/Gl2rOlRgWM
— ◇.A.C.X.◇ (@ACXtrades) February 29, 2020
Let’s take a closer look at the Litecoin price movement and see if it will reach the support area and where will it go afterward.
Ascending Support Line
Several things immediately pop out once we look at the daily chart.
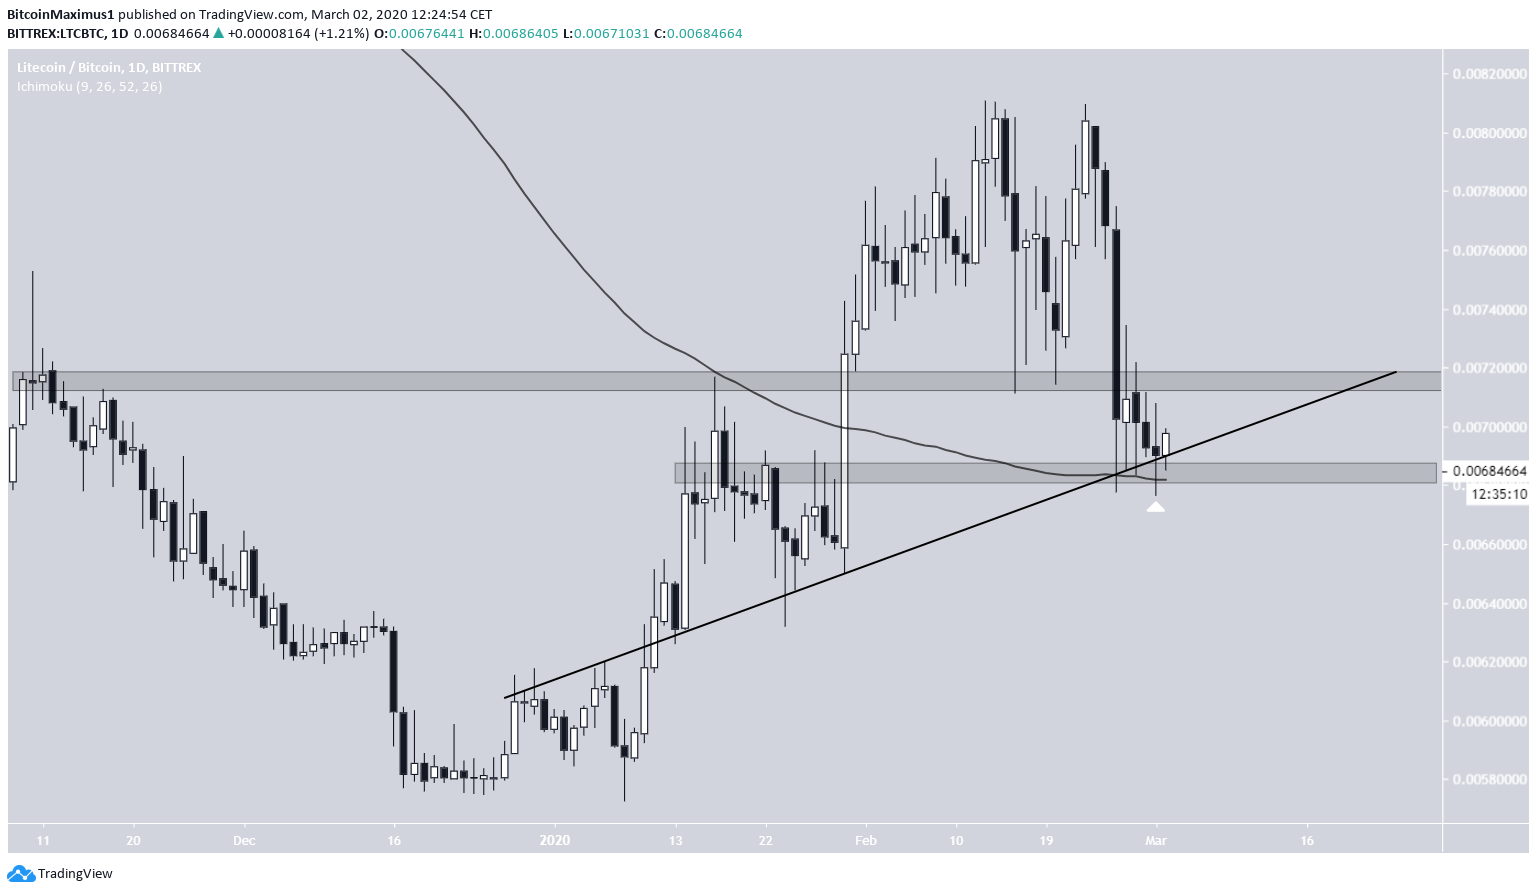
First, there is support and resistance at ₿0.0067 and ₿0.0071, respectively, creating a relatively narrow trading range.
Second, the price is following an ascending support line and has been doing so since the beginning of 2020.
Finally, the price has found support above the 200-day moving average (MA). It has created several long lower wicks. The MA also coincides with the ascending support line.
If the price continues following the ascending support line, it will break out above resistance within the next two weeks at the latest.
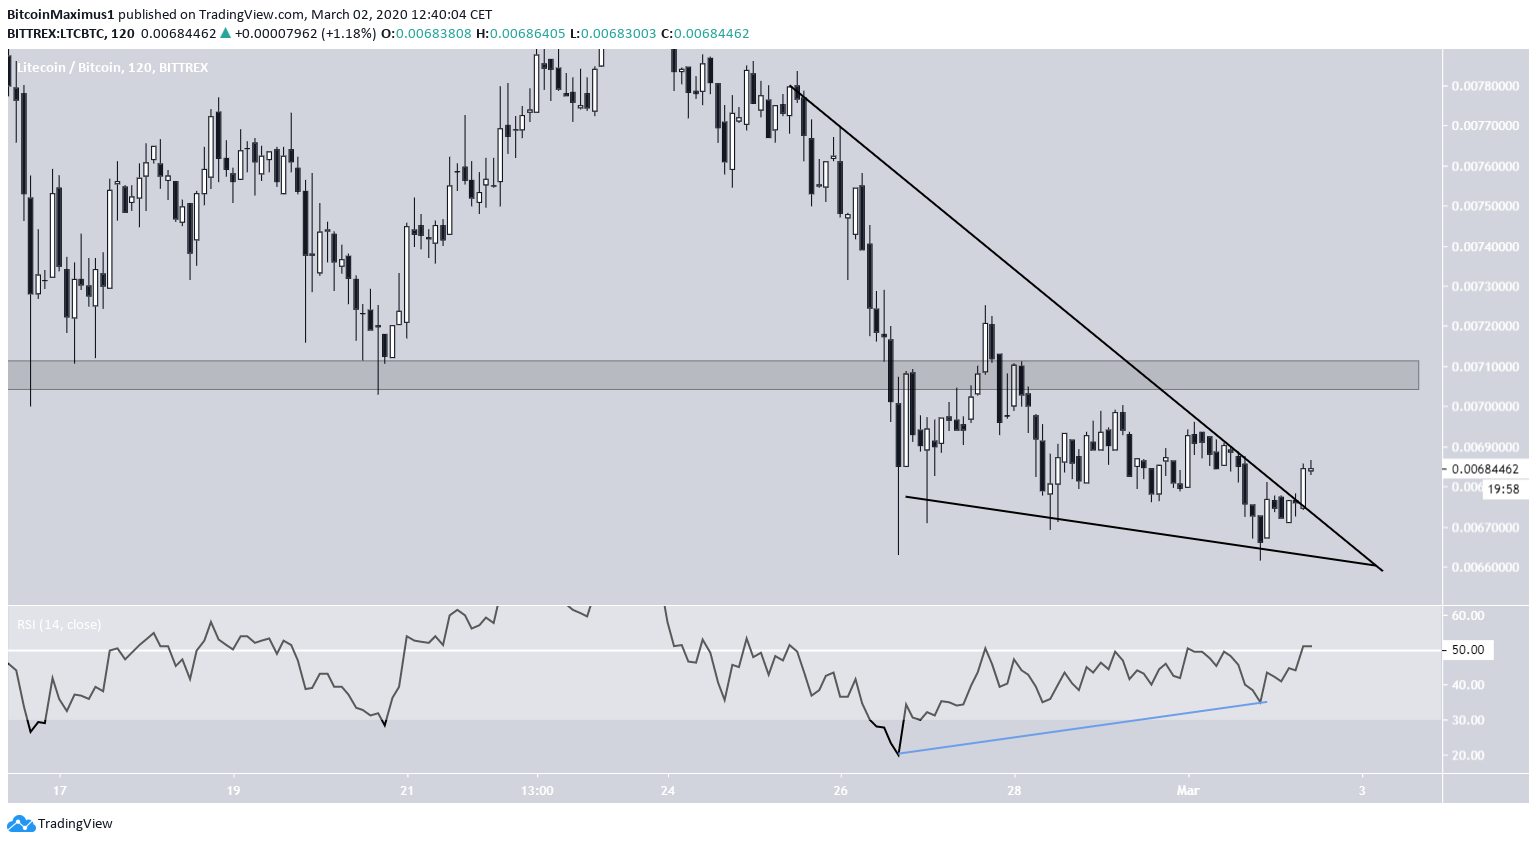
In the short-term, the price might have just broken out from a descending wedge.The two-hour RSI generated bullish divergence prior to the breakout and is in the process of moving above 50.
So, the short-term movement suggests that a trend reversal is near, supporting the idea that the price will continue increasing at the rate predicted by the support line.
Future Movement
In the daily chart, the creation of several long lower wicks suggests the price will move upward. The doji candlestick on March 1 is especially indicative of this, especially if it is followed by a bullish engulfing candlestick, which the price is in the process of creating.
If the price breaks out above the main resistance area at ₿0.0071, which looks likely, it should complete the wave between ₿0.0073-₿0.0075, the 0.5-0.618 Fib levels of the entire decrease.
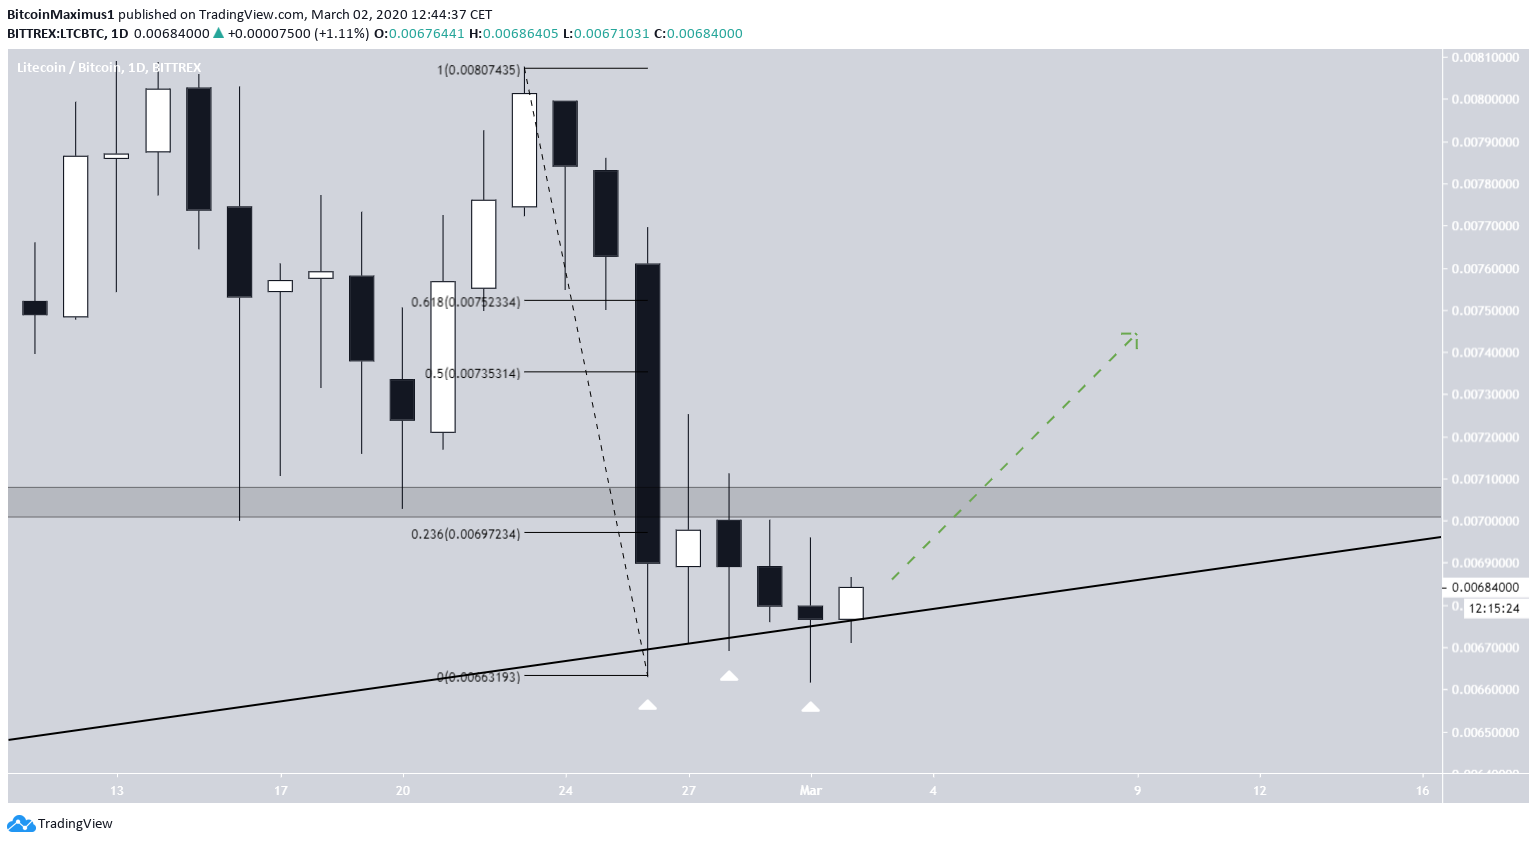
To conclude, the Litecoin price seems to have bounced at a significant support level and is now heading upward. After a breakout above the current resistance area, we are expecting the rally to reach a high of between ₿0.0073-₿0.0075.



