
The Chainlink (LINK) price has been falling since breaking down from a parallel channel on Dec. 17.
The long-term bullish trend may have ended, and LINK will continue declining towards the support area at $5.
Long-Term Trend
LINK has been increasing mostly throughout its price history, beginning in 2017. In Jul. 2019, it reached a high of $4.90 before declining, followed by another unsuccessful breakout attempt in Feb. 2020.
LINK finally broke out successfully in July and continued rallying at an accelerated rate until it reached a high of $20.71 in Aug. However, it has been moving downwards since.
Technical indicators have turned bearish. The MACD is losing strength, the RSI has just crossed below 50, and the Stochastic Oscillator has made a bearish cross.
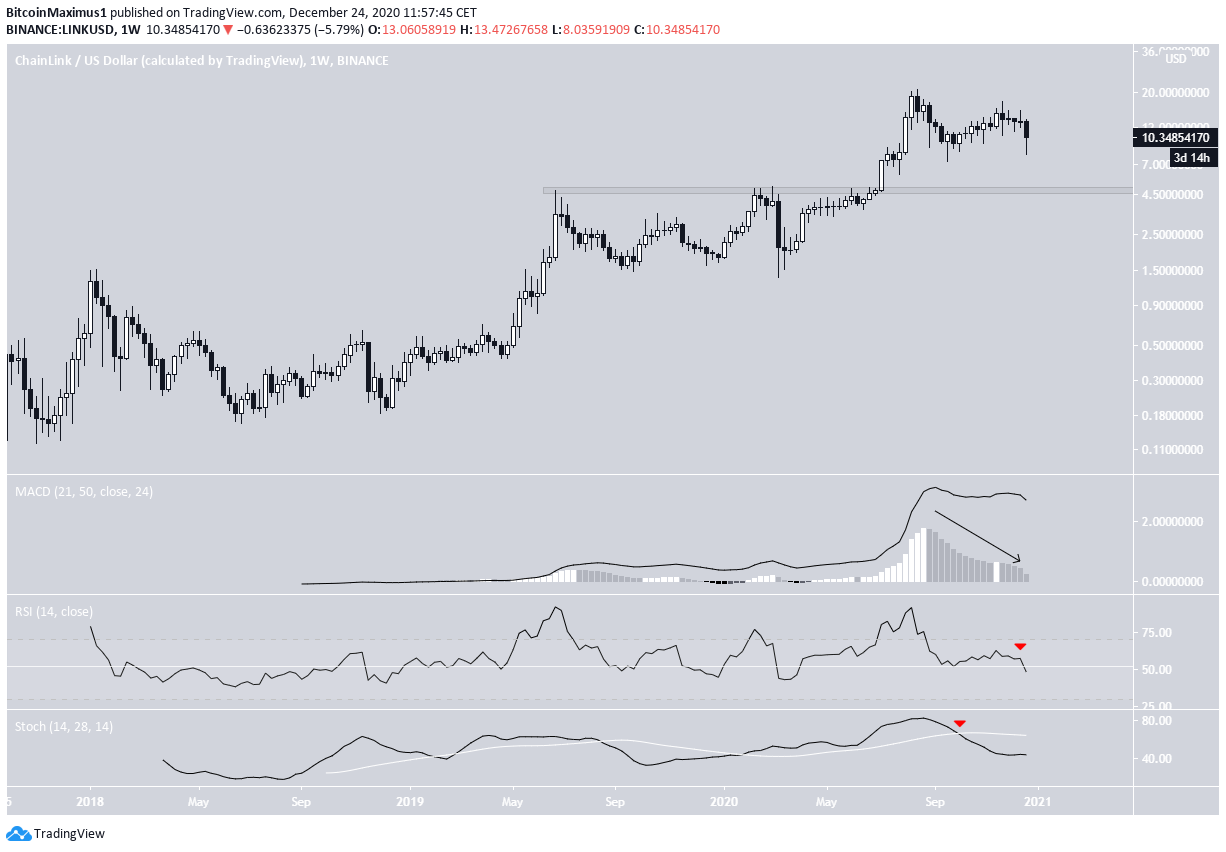
If LINK continues falling, the closest long-term support area is at $5.
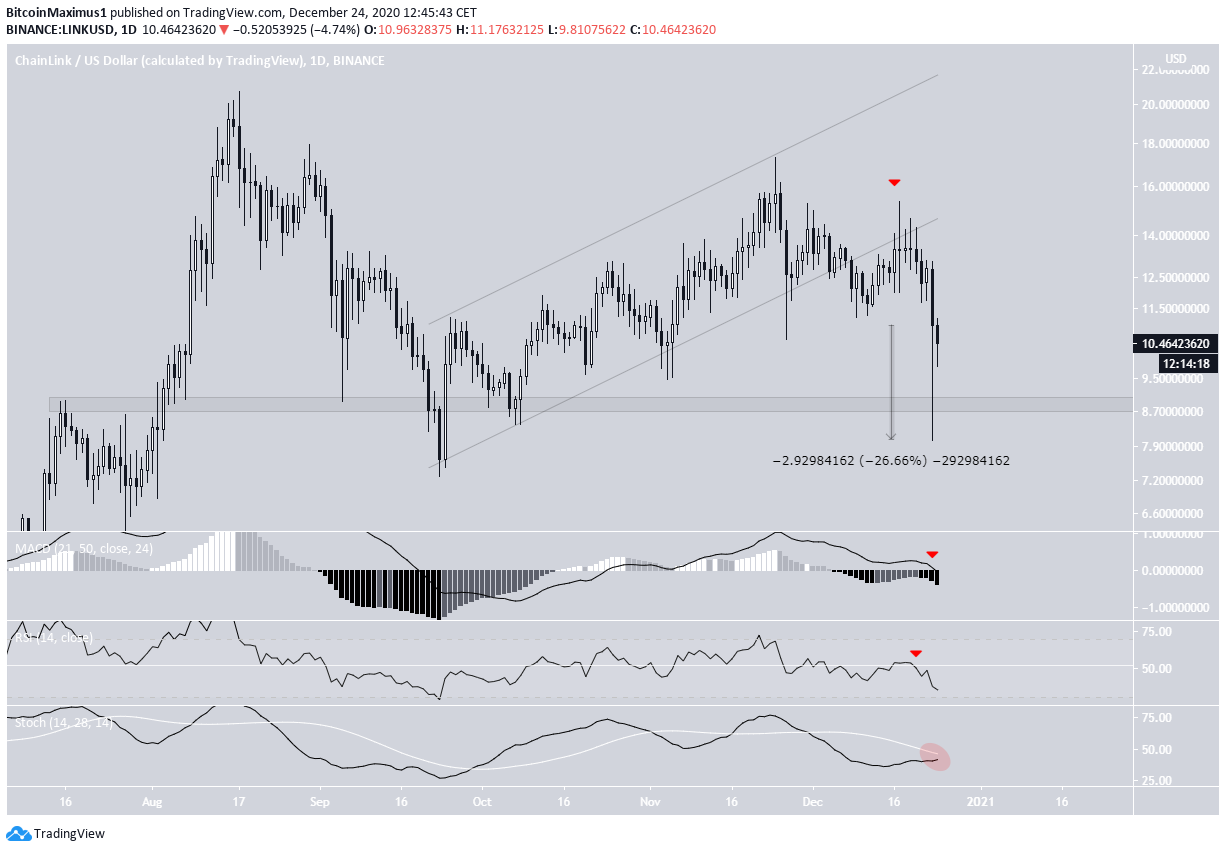
Channel Breakdown
The daily chart shows that LINK had been trading inside a parallel ascending channel since after reaching a low of $7.28 on Sept. 23. It broke down from the channel on Dec.8 and validated it as resistance afterward on Dec. 17 (shown with the red arrow).
Since then, it has been moving downwards at an accelerated pace. On Dec. 23, LINK reached a low of $8.03 but subsequently rallied, leaving a lower wick with a magnitude of 26.66%. This caused it to remain above the minor $8.90 support area.
Similar to the weekly time-frame, technical indicators are bearish, supporting the continuation of a downward move.
LINK’s Wave Count
Cryptocurrency trader @TheEWguy outlined a LINK chart, stating that the trend is bullish. He expects new highs towards $27 and eventually $36.
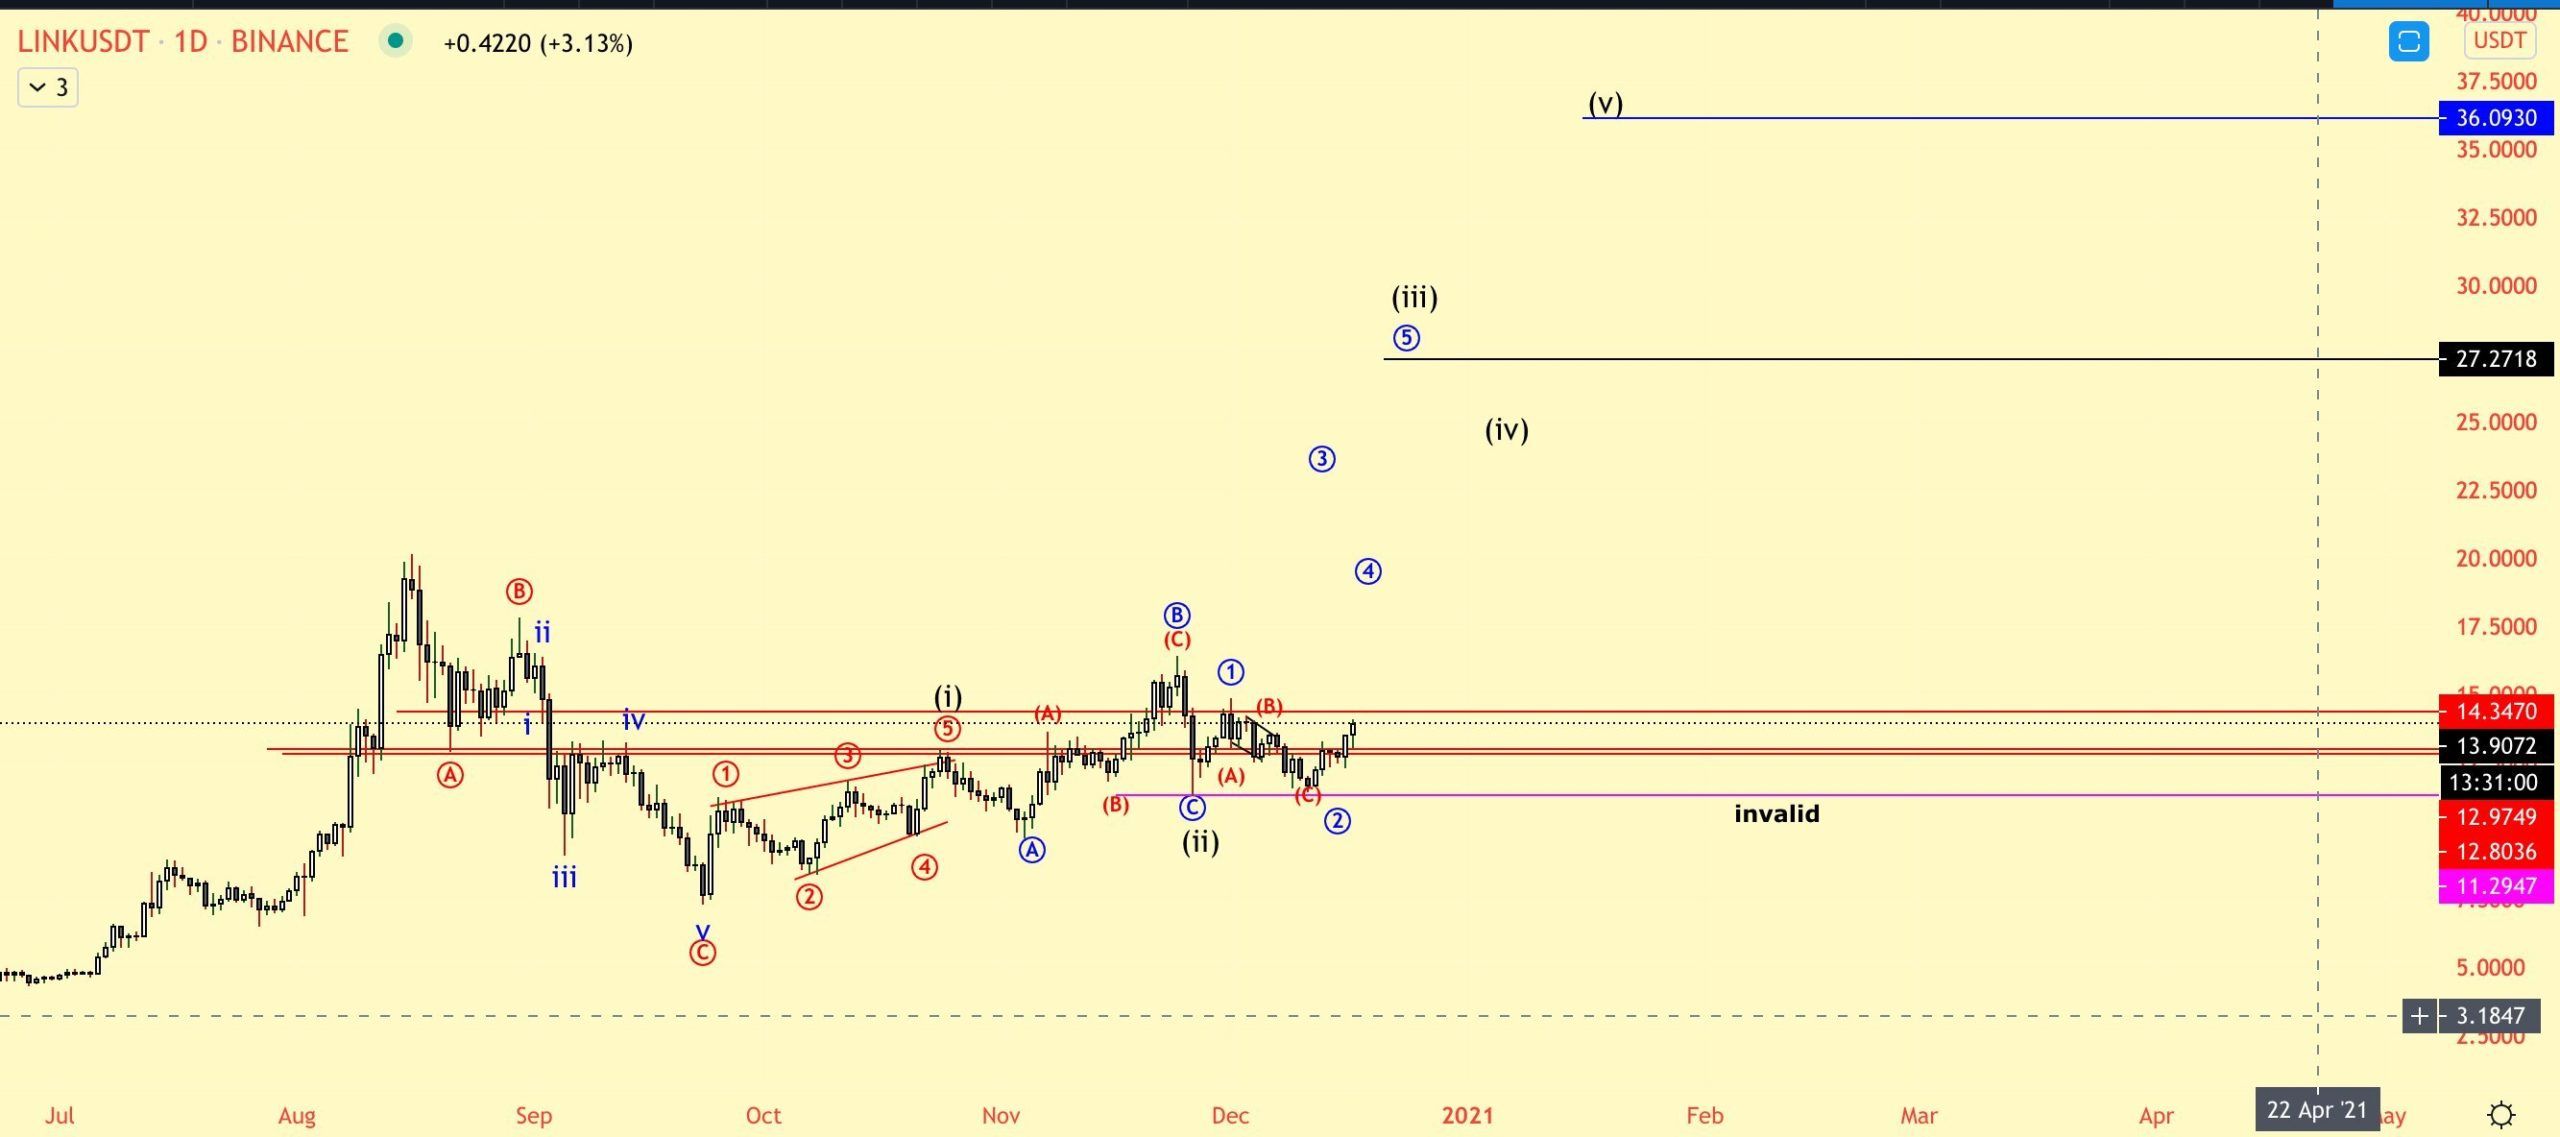
Since the tweet, LINK has instead broken down and invalidated the bullish scenario.
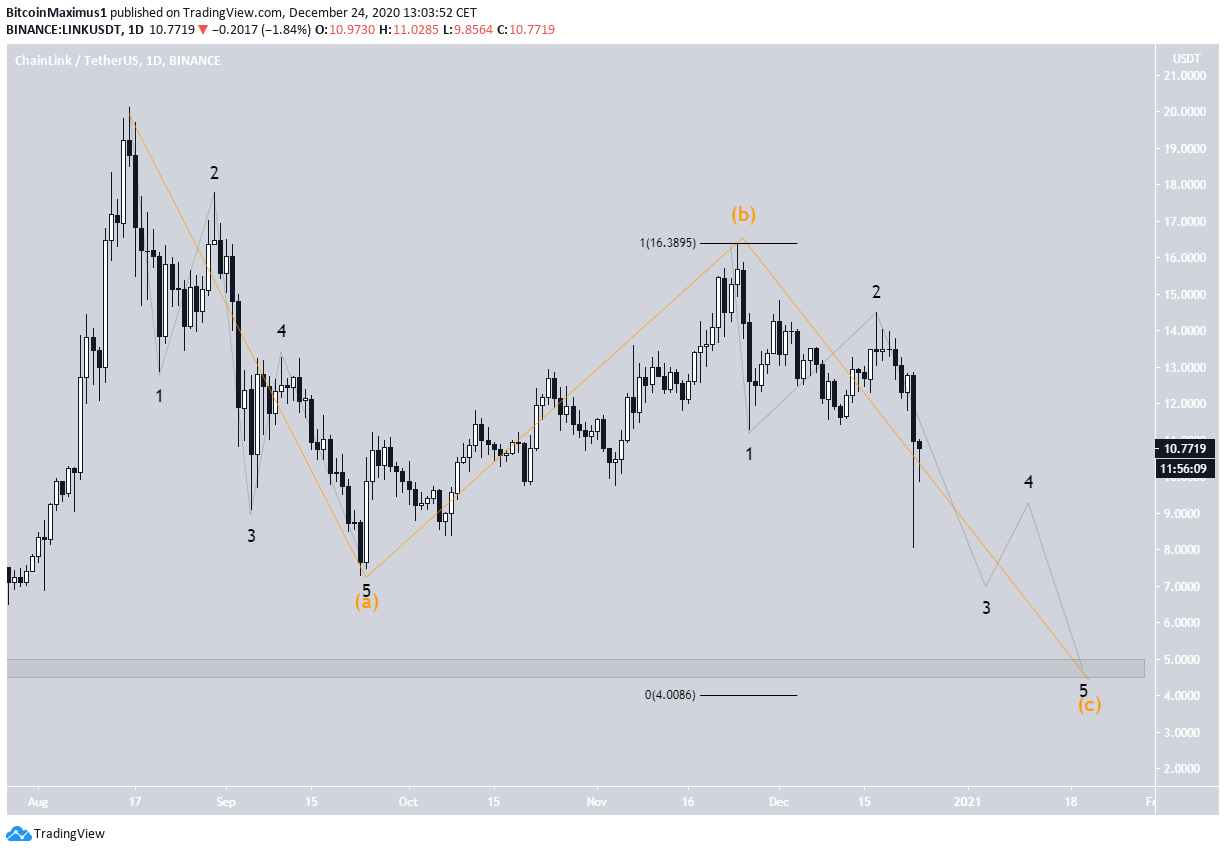
Therefore, the remaining possibility is that LINK is in a bearish A-B-C corrective structure (shown in orange below), which should end near $5.
While the target found by making the A:C wave ratio 1:1 is at $4. the fact that the long-term support area is at $5 suggests that it could act as the bottom.
The sub-wave count is given in black.
Conclusion
To conclude, while short-term relief could occur, LINK should continue moving downwards towards the support area at $8.90, and possibly $5.
For BeInCrypto’s latest Bitcoin (BTC) analysis, click here!
Disclaimer: Cryptocurrency trading carries a high level of risk and may not be suitable for all investors. The views expressed in this article do not reflect those of BeInCrypto.
