


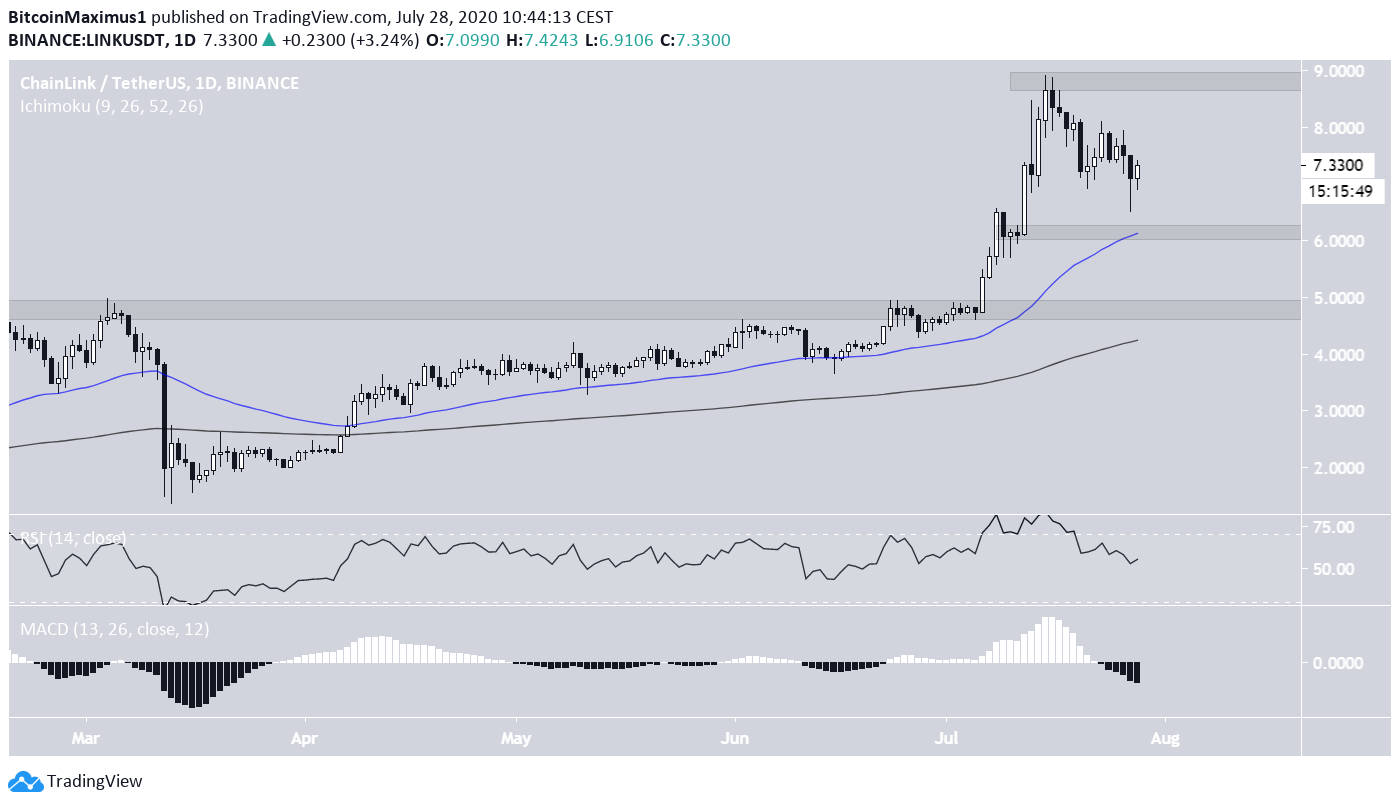
The Chainlink (LINK) price has been decreasing since it reached an all-time high of $8.90 on July 15.
While there are short-term signs of a reversal, it seems that LINK has already reached its top and is currently in a prolonged correction.
LINK Tops Out
The LINK price has been increasing at an accelerated rate since it broke out from the $4.85 resistance area on July 6. The rally continued until July 15, when the price reached a high of $8.90. LINK has been decreasing since then.
While the main resistance area is found at $8.90, support areas are found at $6.20 (minor) and $4.80. The former is supported by the 50-day moving average (MA), while the latter by the 200-day MA. This is also the level where the parabolic breakout began.
Technical indicators are bearish. The RSI is decreasing as is the momentum in the MACD, which has turned negative.
Therefore, based on the daily time-frame, it would be expected for LINK to decrease at least to the $6.20 support area.
Possible Bounce
Cryptocurrency trader @CryptoMichNL outlined a LINK chart, showing a confirmed support area. He stated that:
$LINK #CHAINLINK
Previous high confirmed as support.
On the left an earlier example and $LINK did the same now.
Looks ready for continuation towards $8 if $6.80 holds.
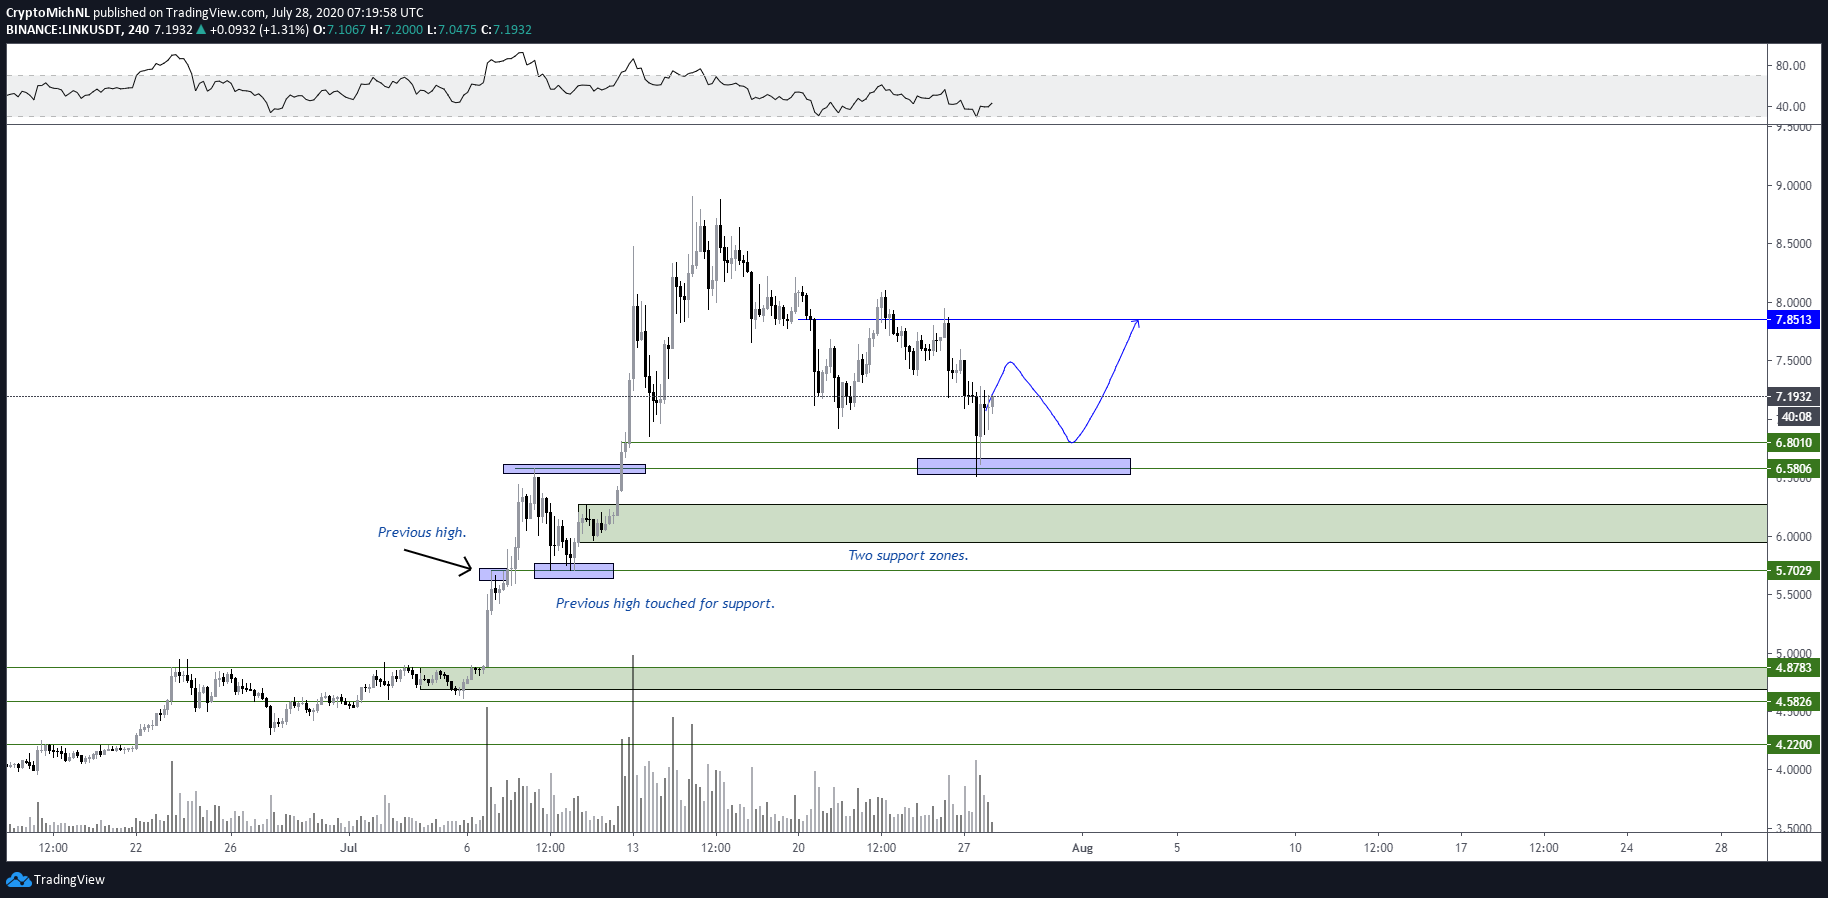
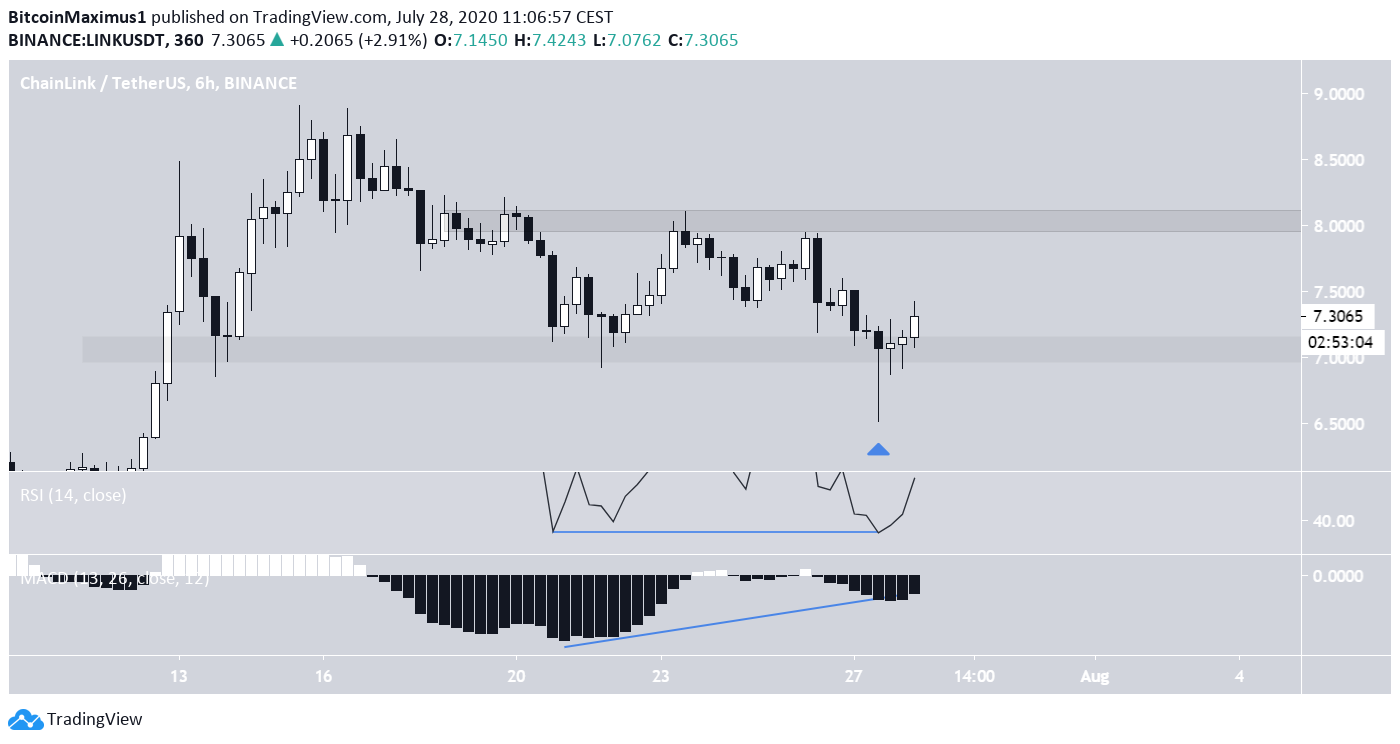
Indeed, there is a minor support level at $7.20. LINK initially created a long lower-wick below this level before reclaiming the lost support.
Technical indicators are somewhat bullish. There is a small amount of bullish divergence developing in the RSI and an even bigger divergence in the MACD. This suggests that the price could increase towards the minor resistance area at $8.
However, the bullishness in lower time-frames is not sufficient to offset the bearishness in higher periods.
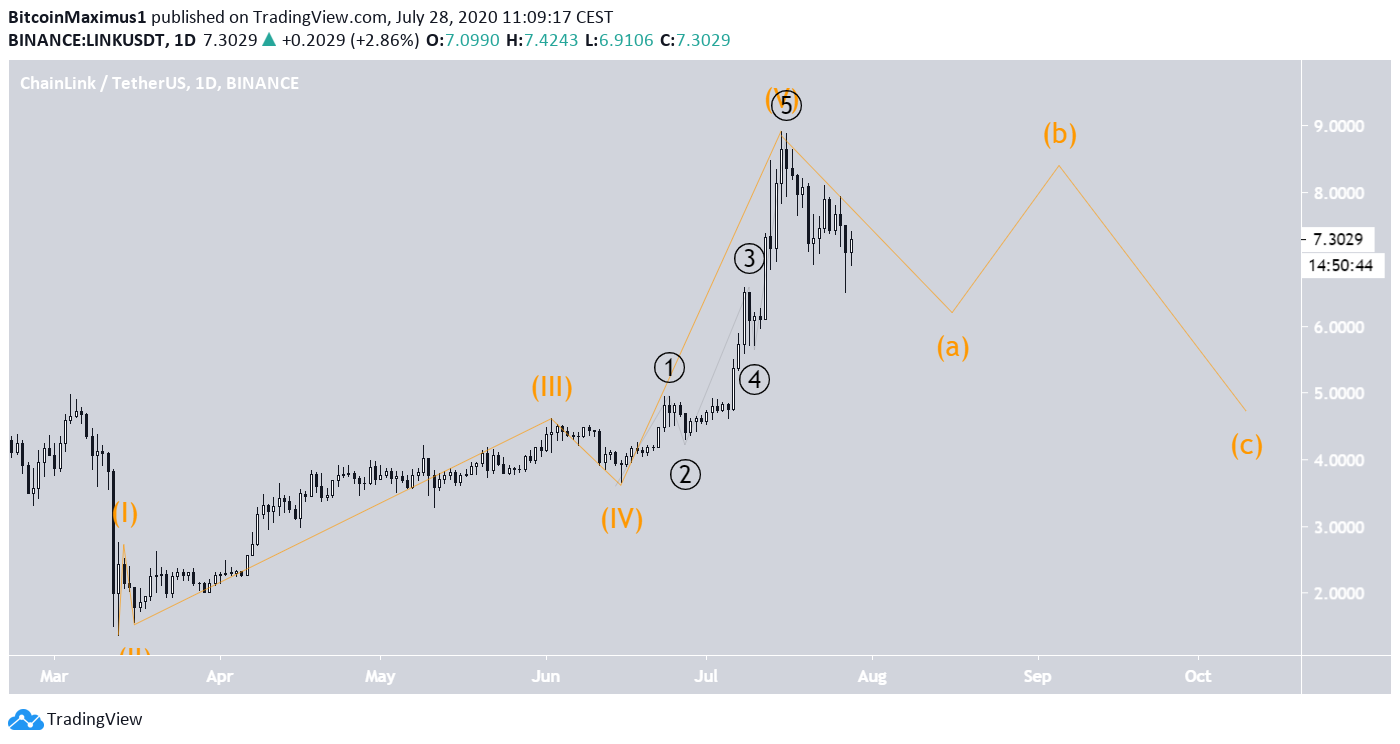
Wave Count
Measuring from the March 13 bottom, it is possible that LINK already completed a five-wave Elliott formation, in which the fifth wave was extended.
If so, the price is currently in the process of completing an A-B-C correction, the A-wave of which would be expected to end near the minor $6.20 support area. The C-wave could end at the major $4.80 support area, which is also the 0.5 Fib level of the entire correction.
While it is possible that the fifth wave will extend even further, that is likely to be visible only during the B-wave if volume picks up and the move becomes impulsive.
For now, the most likely scenario remains that the price is correcting from the July high.
To conclude, the LINK price has likely reached a high and is expected to correct towards the support areas outlined above.


