
On Feb. 10, the LINK price broke out above a significant resistance area and reached an all-time high price the next day. It returned to validate this area as support on Feb. 26 and has been increasing ever since. On March 4, the price reached yet another all-time high.
Chainlink (LINK) Highlights
- There is support at 36,000 and 48,500 satoshis.
- The LINK price is following a parabolic ascending support line.
- The next target is found at 62,700 satoshis.
- The daily RSI has begun to show weakness.
- The price is possibly in the fifth and final wave of an Elliott formation.
Cryptocurrency trader @TraderLenny outlined a LINK chart which shows that the price has reached yet a new all-time high. He also notes that the coin is getting buy signals in different time-frames.
We've just successfully breached the 52.5k sats area with active buy signals across multiple time frames.#ChainLink marines, assemble.🚀 pic.twitter.com/HqKBfjLioS
— TraderLenny (@TraderLenny1) March 3, 2020
How long will this LINK price increase continue? Keep reading below if you want to find out.
New All-Time Highs
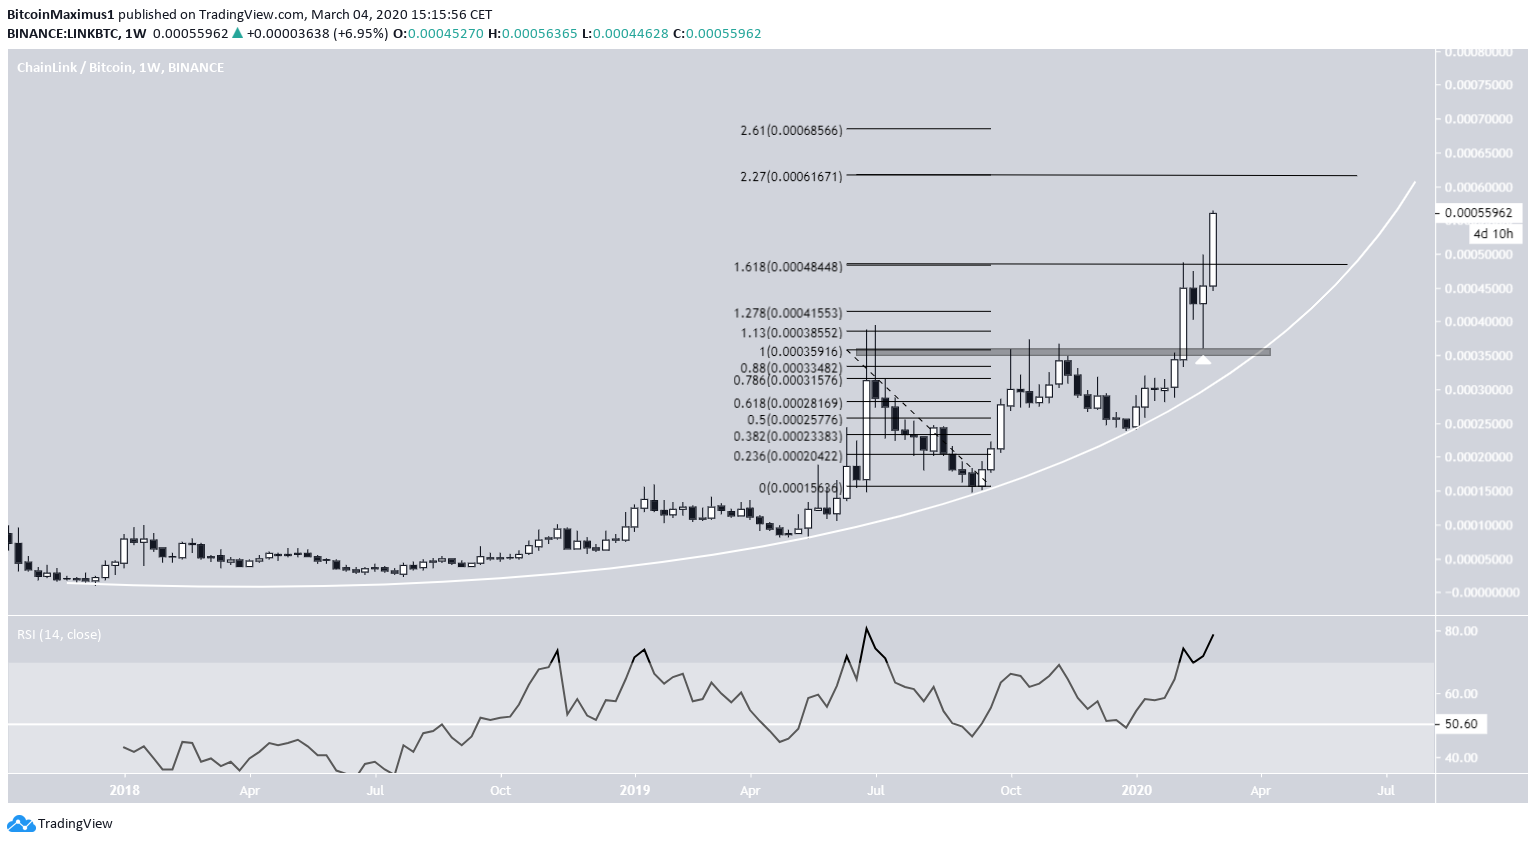
The LINK price has been following a parabolic ascending support line since its inception.
While it initially struggled to break out above the 36,000-satoshi resistance area, it finally did so on Feb. 10 and reached a new all-time high the next day. After validating this area as support on Feb. 26, the price began an upward move that is still ongoing.
While the price initially struggled to move above the 1.618 Fib level at 48,500 satoshis, it was ultimately successful in doing so on March 2. The next target that is expected to provide resistance is found at 61,700 satoshis.
While the weekly RSI is overbought, it has yet to generate any trace of bearish divergence, so it is quite possible that the upward move will continue.
Elliott Waves
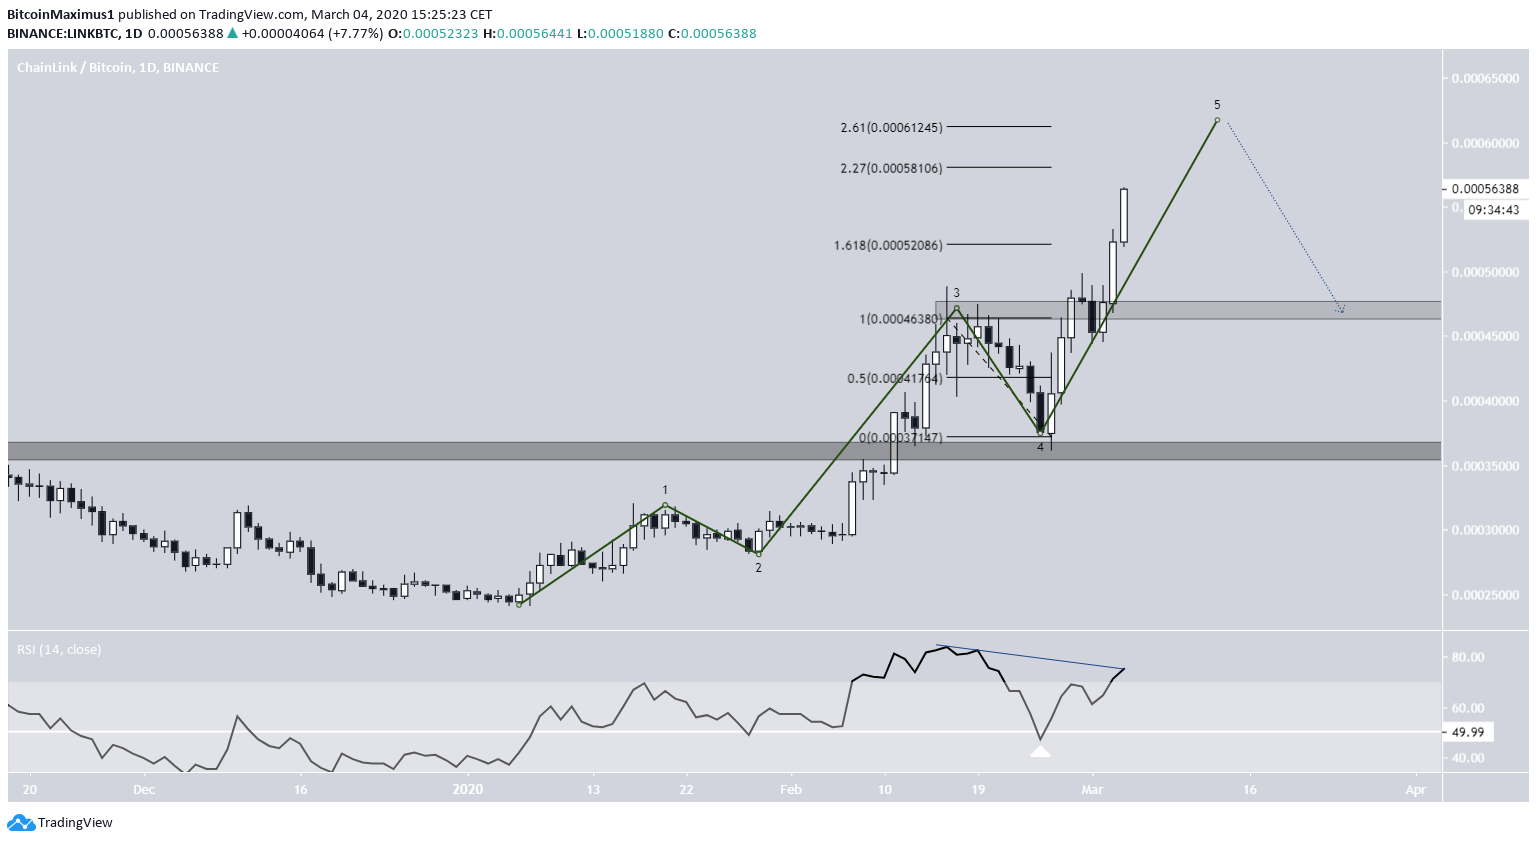
Looking at the daily chart, we can outline a possible five wave Elliott formation that began on Jan. 6. Based on its outline, the price is currently in the fifth and final wave.
There are two interesting features worth noting:
- The daily RSI bounced at the 50-line on Feb. 16, the same day the price bounced at the previous breakout level.
- The Fib targets are aligned on different time-frames, since using a Fib retracement on wave four gives us the same target as the longer-term view.
Therefore, we are expecting the current move to continue at least until the price reaches the 61,700-satoshi area, where a retracement might occur.
The daily RSI has began to generate bearish divergence, a sign indicative of weakness and customary in fifth waves.
To conclude, the LINK price just reached a new all-time high. The increase is expected to continue at least until the price reaches 61,700 satoshis, after which a retracement towards the support area outlined above could transpire.
