
The ChainLink (LINK) price increased by 41% on Sept. 24. While the price has broken out from a bullish pattern, the current movement is still more likely to be a correction than the beginning of a new upward movement.
LINK Bounces at Support
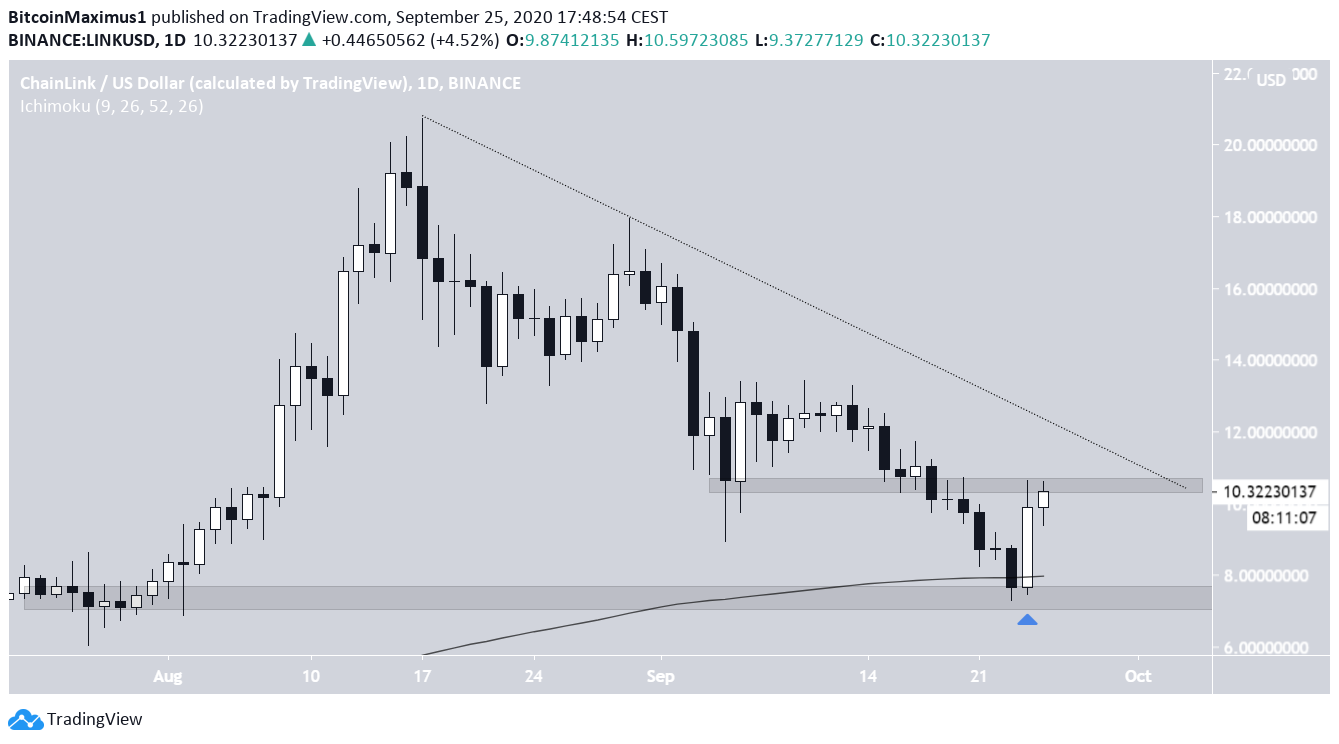
The LINK price has been decreasing alongside a descending resistance line since it reached a high of $20.71 on Aug. 17. The decrease has been significant and continued until the price reached a low of $7.28 on Sept. 23. This movement validated the $7.50 area as support.
The $7.50 area is also strengthened by the presence of the 200-day moving average (MA). Once the price reached this area, it created a bullish engulfing candlestick, increasing all the way to $10.40 in a single day. The increase from low to high measured 41%.
Currently, the price is attempting to move above the minor $10.40 resistance area and possibly the descending resistance line drawn from the highs.
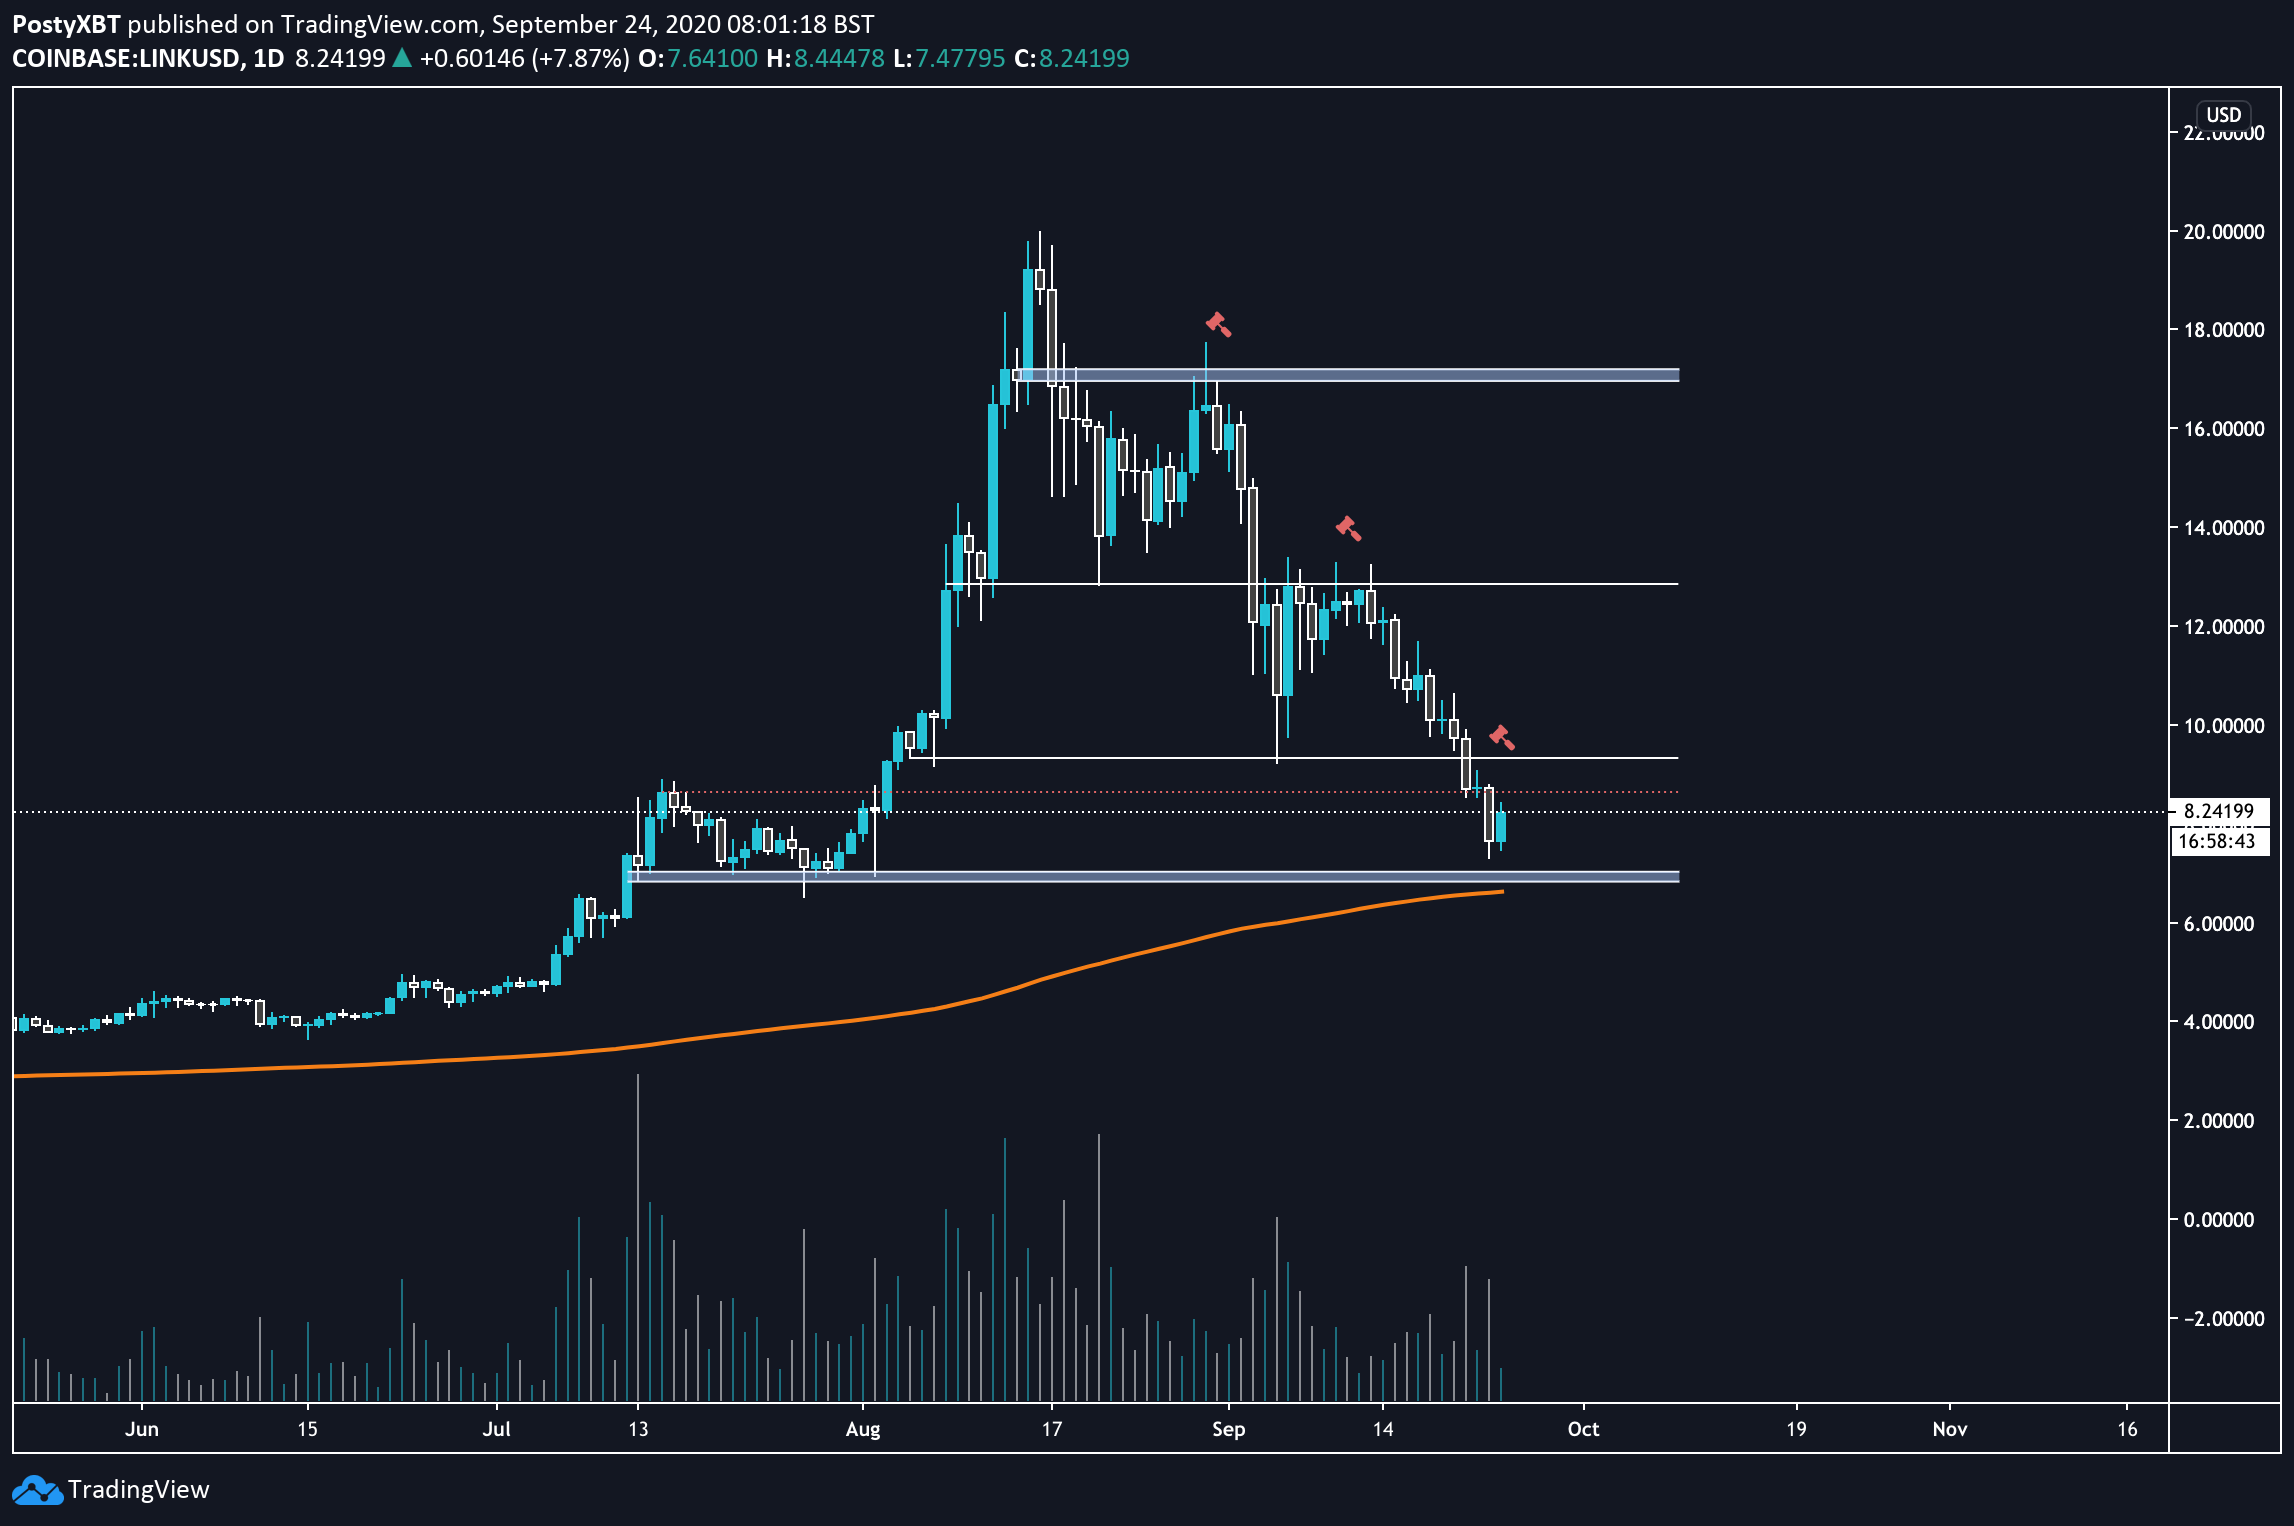
Cryptocurrency trader @PostyXBT tweeted out a LINK chart, stating that the price is approaching the 200-day moving average (MA) support. As seen in the chart above, the price initiated a very strong bounce once it reached the MA.
Reversal or Relief?
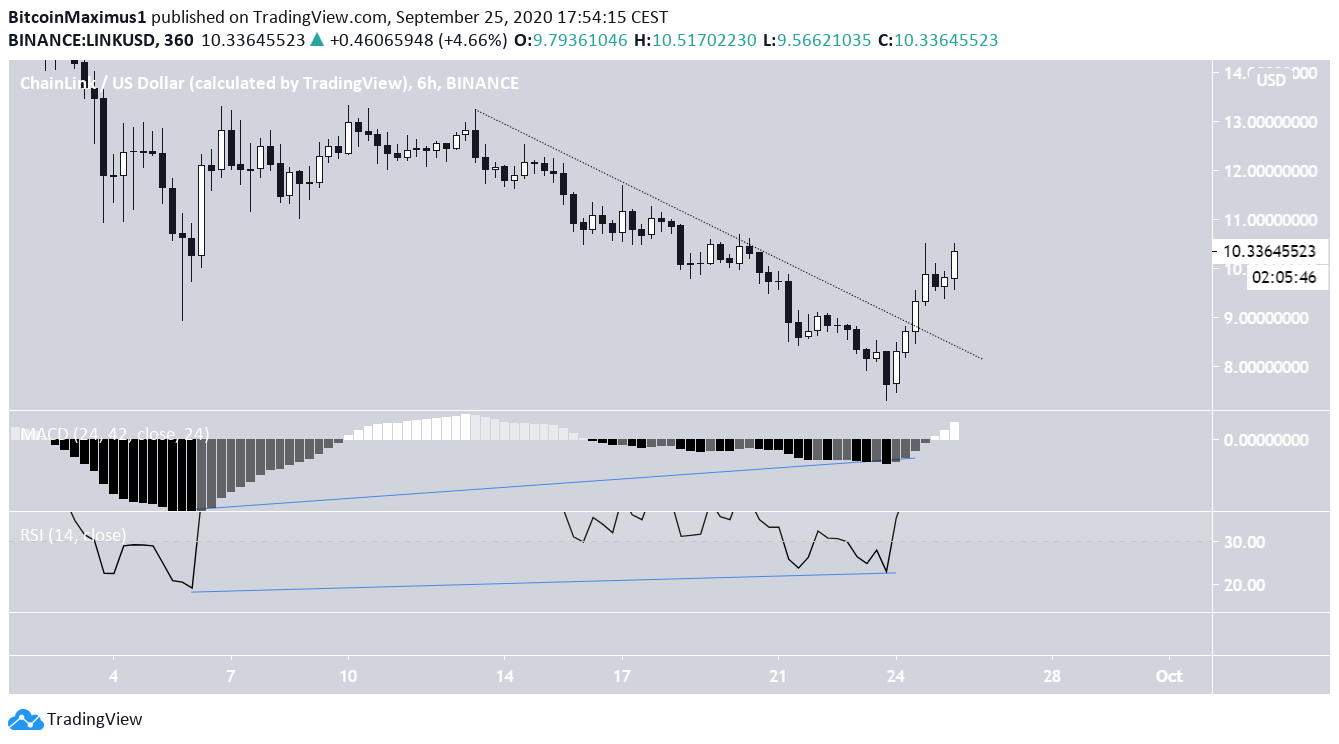
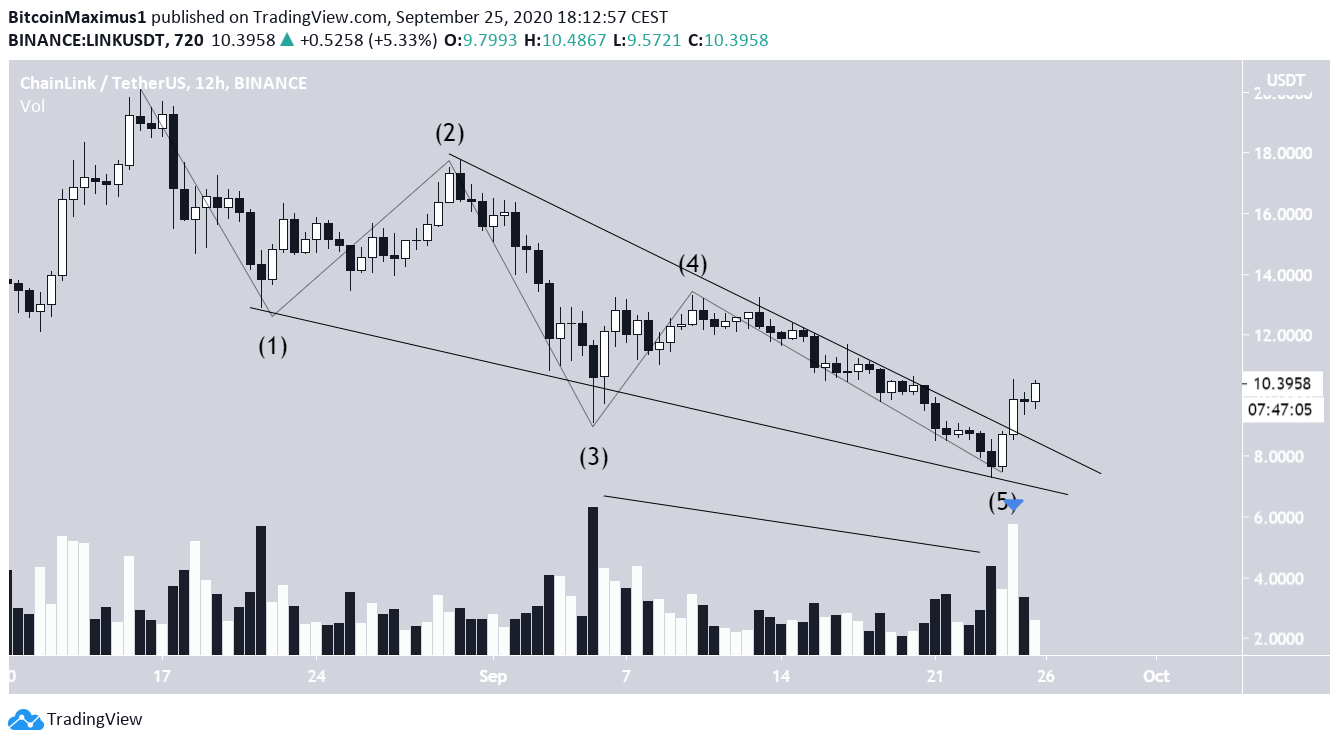
The six-hour chart shows that the price has broken out from a descending resistance line. The breakout was preceded by considerable bullish divergence in the RSI & MACD, increasing its validity.
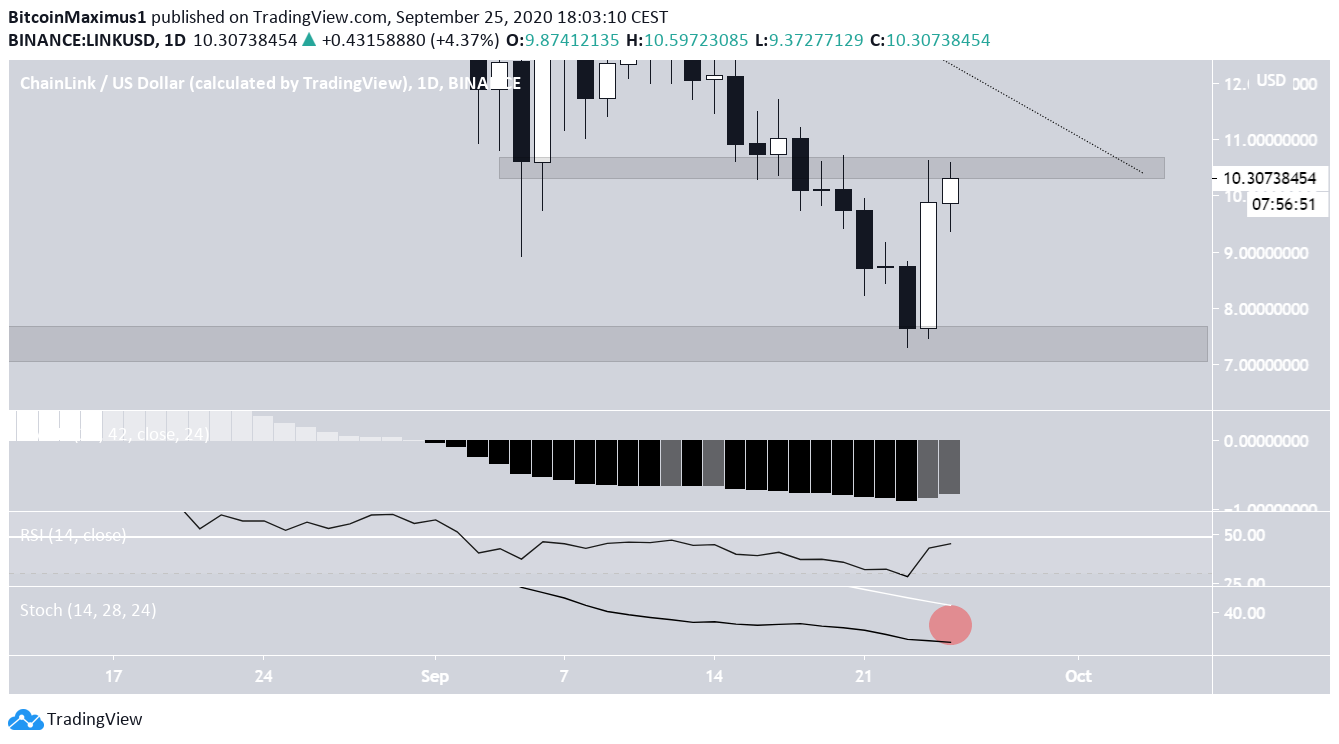
However, the daily chart does not confirm that the trend is bullish. The RSI is below 50, and the Stochastic Oscillator has not made a bullish cross. The MACD has just begun to increase, having created one higher momentum bar.
Until the price breaks out from the longer-term resistance line or a bullish cross transpires in the Stochastic Oscillator, we cannot state that the trend is bullish.
Wave Count
Since the aforementioned Aug. 17 high, the LINK price has completed a five-wave bearish formation (shown in black below). Since waves 1 & 4 overlap, it is likely that the movement was a leading diagonal, also supported by the wedge-like shape.
Furthermore, volume decreased during the wave-5 bottom and picked up during the breakout, customary in such movements.
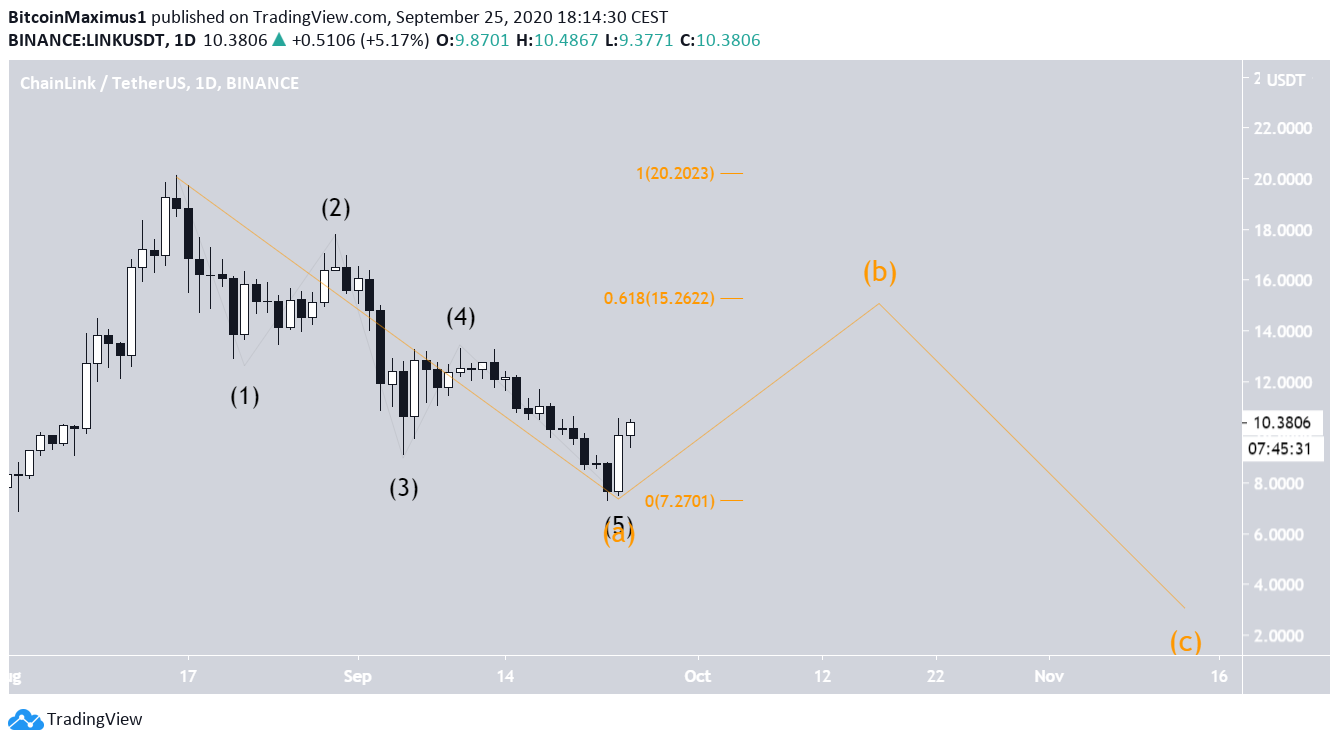
In the longer-term, it is possible that this entire decrease has been the A wave (orange) of a longer-term A-B-C correction.
If so, the price could increase all the way to the 0.618 Fib level at $15.26 before resuming its downward movement.
To conclude, while the LINK price is expected to increase in the short/medium-term, it is more likely that the price is still engulfed in a longer-term correction.
