


The Bitcoin four-year cycle is different this time. Earlier cycles used to feel almost mechanical: halving, bull run, blow-off top, crash, repeat. But so far, the 2024-2028 cycle has not followed the old script cleanly.
In fact, it has already broken one major pattern: Bitcoin hit a new all-time high before the April 2024 halving, not after it.
That changed the usual rhythm. At the same time, spot Bitcoin ETFs brought fresh demand into the market earlier than past cycles would have suggested. Institutions now carry more weight, and macro liquidity has become harder to ignore. Still, the old cycle debate has not gone away. Bitcoin’s October 2025 peak near $126,200 and its early 2026 correction look familiar enough to keep the comparison alive.
This guide compares the current Bitcoin cycle with previous ones and analyzes what has changed, what still looks familiar, and which signals, from ETF flows to liquidity conditions, matter most in 2026.
KEY TAKEAWAYS
➤ The Bitcoin four-year cycle has evolved rather than vanished, with the halving still anchoring supply changes.
➤ BTC hit an all-time high before the 2024 halving for the first time, breaking a key historical pattern.
➤ Spot Bitcoin ETFs, approved in January 2024, front-loaded demand and changed the traditional cycle timeline.
➤ The October 2025 peak and early 2026 drawdown still partly fit the old four-year timing pattern
➤ ETF flows, MVRV, volatility, stablecoin liquidity, and derivatives leverage now matter as much as halving dates.
- What is the Bitcoin four-year cycle?
- What did past Bitcoin cycles have in common?
- Is the Bitcoin four-year cycle still relevant in 2026?
- Has the Bitcoin four-year cycle ended or evolved?
- Which Bitcoin cycle signals matter most in 2026?
- How to read the Bitcoin cycle in 2026 (and what does this mean for investors)?
- Frequently asked questions
What is the Bitcoin four-year cycle?
The Bitcoin four-year cycle refers to a recurring market pattern tied to the Bitcoin halving. This event occurs roughly every four years, or every 210,000 blocks, and cuts the block reward miners receive by half. After the April 2024 halving, the reward fell from 6.25 BTC to 3.125 BTC per block.
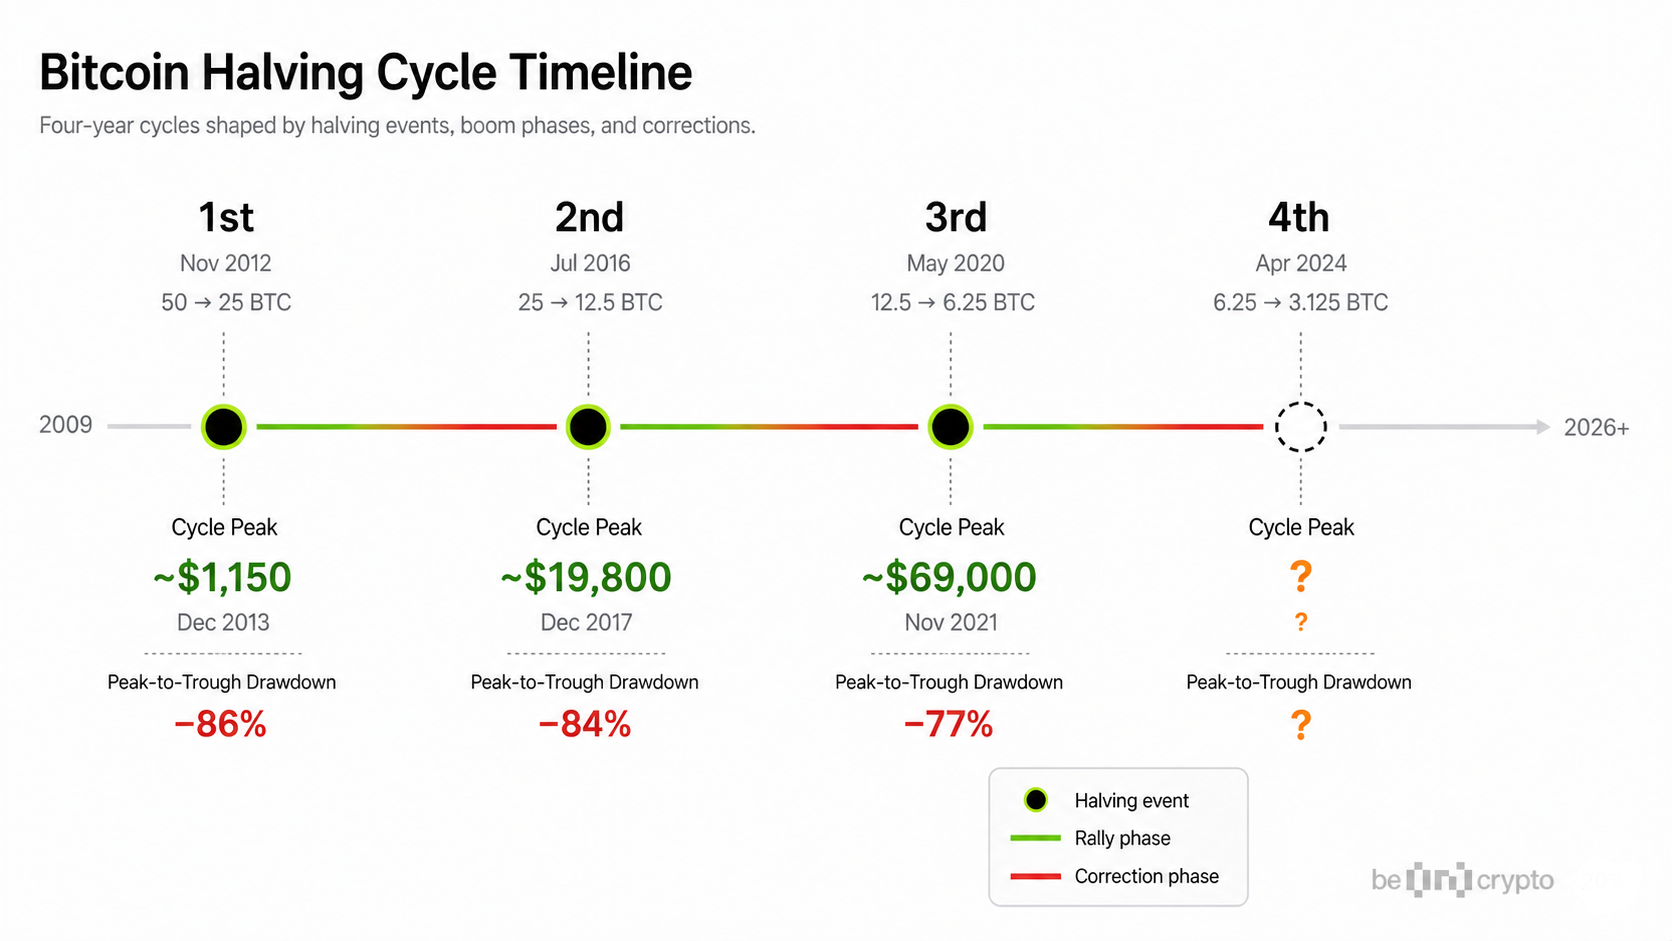
Past cycle tops appeared around four-year intervals. The first major peak came in 2013, the second in 2017, the third in November 2021, and the most recent in October 2025, when BTC traded just above $126,200. Fidelity calls it the latest point in the four-year cycle framework.
The pattern has been consistent enough to become a widely tracked framework among market watchers. However, the cycle is a market pattern, not a guaranteed law. Each cycle played out under different conditions, and the 2024-2026 period has introduced forces that challenge the old model.
What did past Bitcoin cycles have in common?
Each prior cycle shared a basic structure. A halving reduced the new supply, demand eventually outpaced the lower issuance rate, price climbed to a euphoric peak, and a steep correction followed. The details, however, varied significantly across each period.
Here’s a quick recap of how it played out:
| Cycle | Halving year | Peak year | Main driver | What made it distinct |
| 2012-2013 | 2012 | 2013 | Early retail awareness | Small market, weak infrastructure |
| 2016-2017 | 2016 | 2017 | Retail mania and ICO boom | First major mainstream crypto wave |
| 2020-2021 | 2020 | 2021 | Liquidity, stimulus, institutions, retail | Pandemic-era money growth and public-company BTC purchases |
| 2024-2026 | 2024 | 2025 (debated) | ETFs, institutions, macro, derivatives | First cycle with spot Bitcoin ETFs before the halving |
The 2012-2013 cycle brought early adopters into a small market with thin liquidity and limited exchange infrastructure. By 2016-2017, retail mania and the initial coin offering (ICO) boom helped push BTC past $19,000 before a prolonged crash.
The 2020-2021 cycle had a different setup, with pandemic-era fiscal stimulus, near-zero interest rates, and public companies adding BTC to their balance sheets.
The Bitcoin 4-year cycle is not a fixed rule. It is a pattern shaped by supply changes, demand shifts, and macro conditions that happened to repeat at roughly four-year intervals.
Each of these cycles ended with drawdowns of at least 77% from the peak, according to Fidelity Digital Assets research. The current cycle has started to break that pattern, which is one reason the debate over whether the old model still holds has grown much louder in 2026.
Is the Bitcoin four-year cycle still relevant in 2026?
The Bitcoin four-year cycle is still relevant in 2026, but only as a broad framework. It can still help explain timing, drawdowns, and market psychology. However, it no longer works as a simple calendar-based price model because ETFs, institutions, derivatives, and macro liquidity now play a larger role.
What still looks familiar in the current Bitcoin cycle
Despite the structural changes, several elements of the 2024-2026 cycle still echo prior periods.
First, the timing still partly lines up. Bitcoin’s major cycle peaks have historically appeared around four-year intervals, with tops in 2013, 2017, 2021, and 2025. The Oct. 6, 2025, peak near $126,200 landed within the window that the old cycle model would have predicted. For anyone who still follows the traditional framework, that timing is hard to dismiss.
Second, steep drawdowns still follow euphoric phases. BTC fell roughly 52% from its October 2025 all-time high by early 2026 and reached about $60,000 at its lowest, according to a NYDIG study. The decline lasted 122 days and ranked as the seventh-largest drawdown in Bitcoin’s history. The study classified Oct. 6, 2025, as a cyclical top and argued that the timing and depth of the drop supported the cycle-intact view.
Third, investor psychology still matters. Fear, greed, and herd behavior continue to drive short-term price swings. Macro shocks can still accelerate selling, and the early 2026 correction coincided with broader risk-off sentiment in global markets. Even in a more institutional market, crowd behavior has not disappeared from Bitcoin price action.
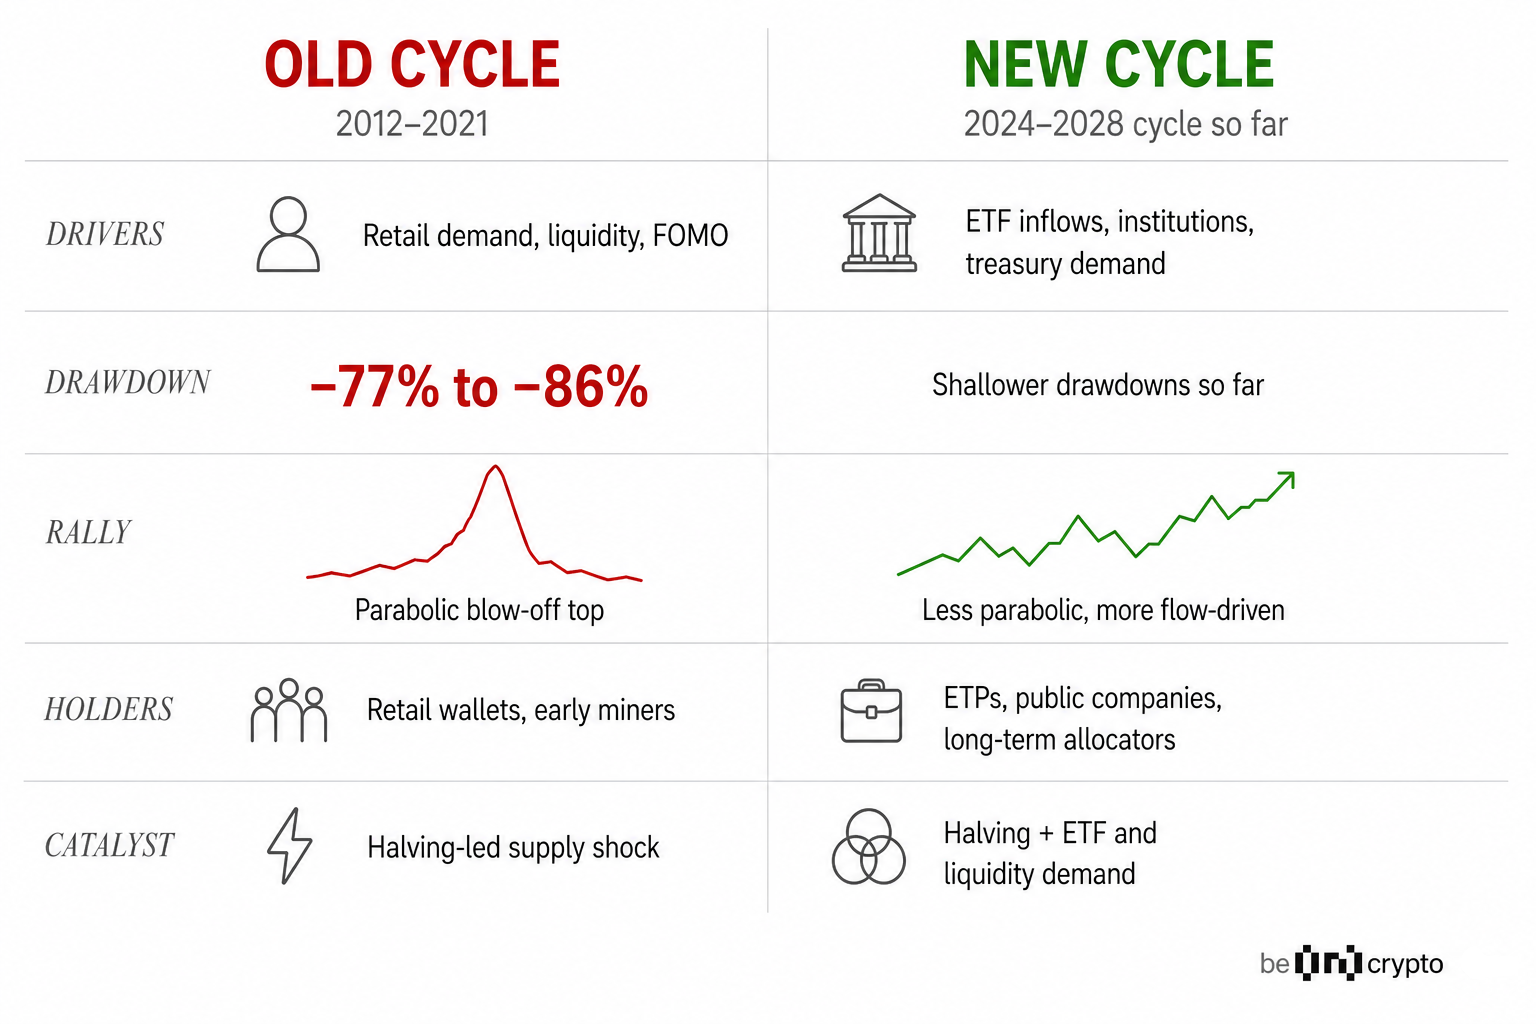
Why the 2024-2028 Bitcoin cycle looks different
The current Bitcoin cycle looks different because demand arrived earlier, market access changed, and price discovery now depends on more than the halving. Several structural changes separate the 2024-2026 period from every prior cycle, which means the old model alone is no longer enough.
Here’s a rundown of the primary reasons the current cycle doesn’t follow the established structure:
BTC hit a new high before the halving
Bitcoin reached a new all-time high in March 2024, before the April 2024 halving. That had never happened in a prior cycle. Previous peaks came well after halvings, not before them.
Grayscale noted that Bitcoin fully recovered from its 2021-2022 drawdown and set a new record in March 2024, driven largely by ETF-related demand. This single data point is one of the strongest reasons to argue that the cycle mechanics have shifted. In all three prior cycles, the all-time high came at least 12 months after the halving.
Spot Bitcoin ETFs changed demand timing
The SEC approved spot Bitcoin ETP shares on Jan. 10, 2024. That decision opened a regulated channel for direct Bitcoin exposure in U.S. markets for the first time.
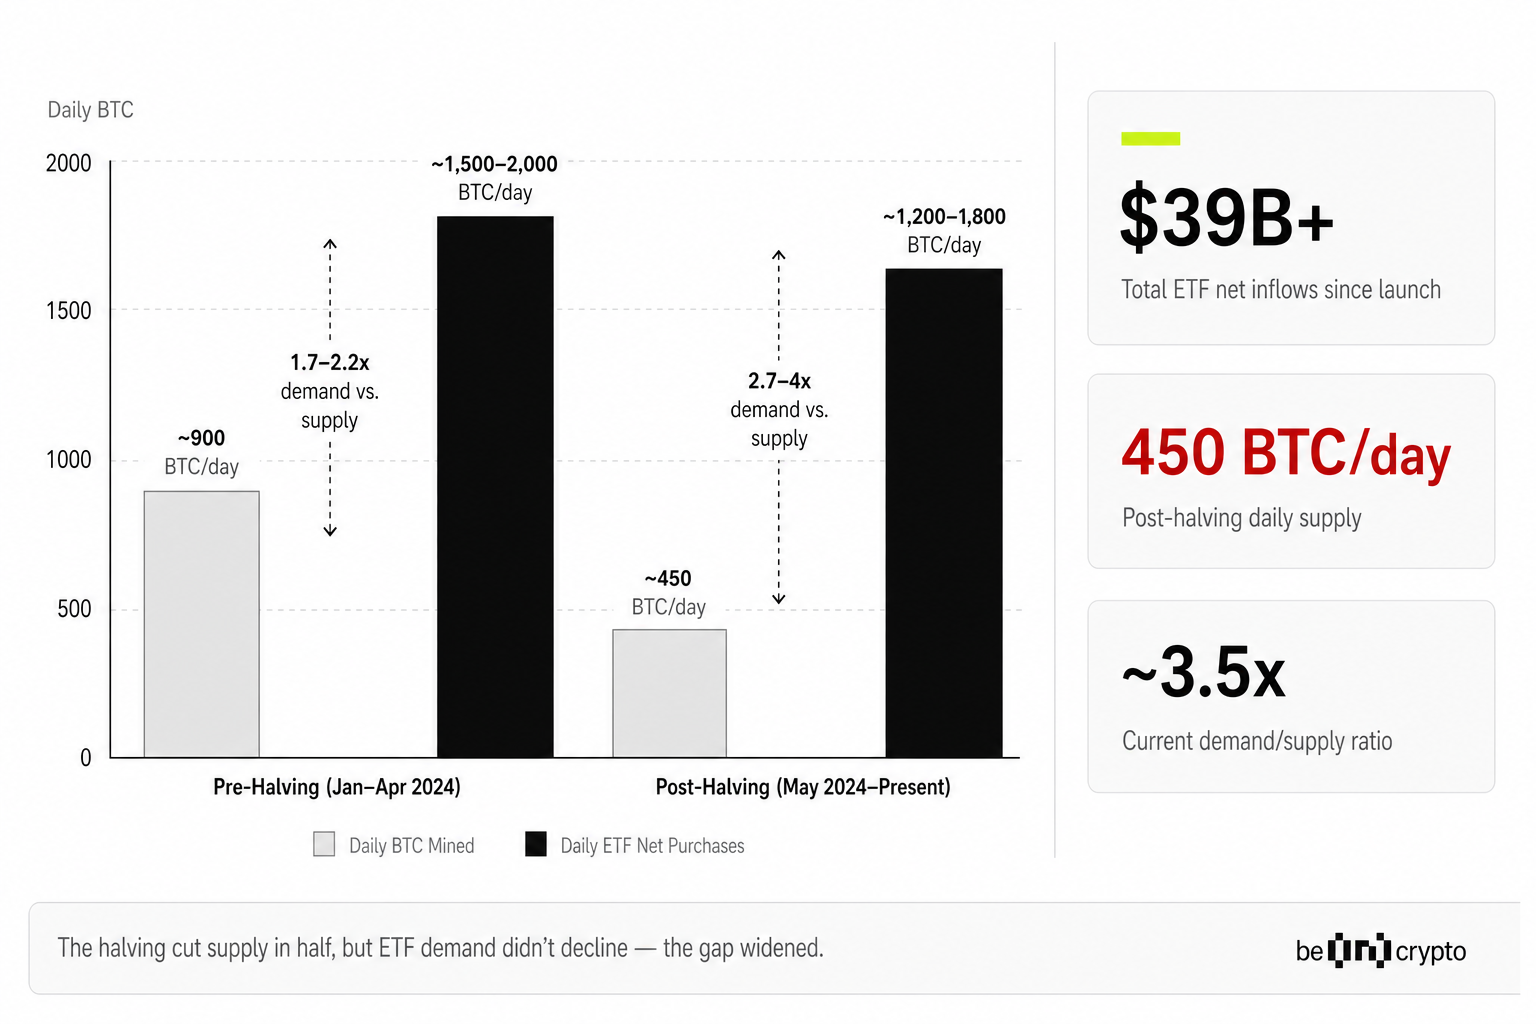
The effect on demand was immediate. CME Group noted that during February 2024, net inflows into US-listed spot Bitcoin ETFs averaged $208 million per day, far outstripping the pace of new BTC supply even before the halving took place. The daily issuance at that time was around 900 BTC, worth roughly $54 million at March 2024 prices.
Exchange-traded funds (ETFs) can pull BTC into:
- Long-term investment products,
- Create regulated access for advisors and retirement accounts,
- Link Bitcoin to asset-allocation models, and
- Make flows more sensitive to macro risk appetite.
As of late April 2026, total global crypto ETP assets under management reached approximately $155 billion, according to CoinShares data, with digital-asset investment products recording $1.2 billion in net inflows in the most recent weekly report.
ETFs did not just add a new buyer. They changed when demand arrives. By front-loading institutional buying before the halving, ETFs compressed the supply-demand gap that previously took months to build after each halving event.
Institutions now influence price discovery
Grayscale’s 2026 outlook reports that global crypto ETPs saw $87 billion in net inflows since U.S. Bitcoin ETPs launched, while advised U.S. wealth still had less than 0.5% crypto allocation. That gap suggests significant room for additional institutional capital to enter in future quarters.
Coinbase’s 2026 outlook frames the year as one of institutional integration and regulatory maturity rather than another retail-driven boom-and-bust cycle. Regulatory progress, including new spot crypto ETFs and digital asset treasury models, has enabled broader participation from financial advisors, pension allocators, and corporate treasuries.
The result is a market where allocation flows, not just retail mania, increasingly drive price discovery.
Volatility has cooled near record prices
Fidelity Digital Assets research shows that 2025 was the least volatile year in Bitcoin’s history based on annualized realized volatility.
In January 2026, Fidelity recorded 17 new instances of all-time lows in one-year realized volatility, occurring just months after BTC reached record prices. That combination of record highs and record-low volatility had never appeared in previous bull markets.
As of late 2025, roughly 12% of bitcoin’s circulating supply was held by public companies and ETPs. The presence of long-term, less reactive holders may help explain why price swings near the top were smaller than in prior blow-off phases.
Derivatives markets are deeper
CME Group Bitcoin futures average daily open interest rose to $11 billion in March 2024, reflecting growing demand for regulated Bitcoin exposure. Regulated derivatives enable hedging, risk management, and actionable price discovery, all of which reduce the kind of one-directional retail-driven spikes that defined earlier cycles.
Kaiko’s 2026 outlook notes that derivatives dominance reached 73.2% of total crypto market volume in February 2026. The depth of the derivatives market now plays a larger role in price formation than narrative-driven retail flows did in previous cycles.
Macro liquidity matters more
Bitcoin in 2026 has become more sensitive to monetary policy, interest rate expectations, and global risk appetite. Fidelity identifies monetary policy as a key cycle factor, and Kaiko notes that regulatory clarity, stablecoin liquidity, and market structure now play a larger role in price formation than retail sentiment alone.
Bitcoin increasingly trades alongside traditional risk assets during macro events, a shift from earlier cycles when crypto markets moved more independently.
Has the Bitcoin four-year cycle ended or evolved?
The Bitcoin four-year cycle has not clearly ended. A better reading is that it has evolved. Market experts and research teams often disagree on this question, and that disagreement makes the analysis more useful. The main views fall into three camps:
| View | Main argument | Best evidence | Main risk |
|---|---|---|---|
| Cycle intact | The October 2025 top and 2026 drawdown fit old timing | Fidelity and NYDIG | It may ignore how market maturity changes drawdown severity |
| Cycle ended | ETFs and institutions have weakened the old model | Grayscale, Fidelity Digital Assets, CME | It may understate human psychology and herd behavior |
| Cycle evolved | The halving still matters, but macro conditions and flows now matter more | Best synthesis of both camps | It is harder to reduce to a simple trading rule |
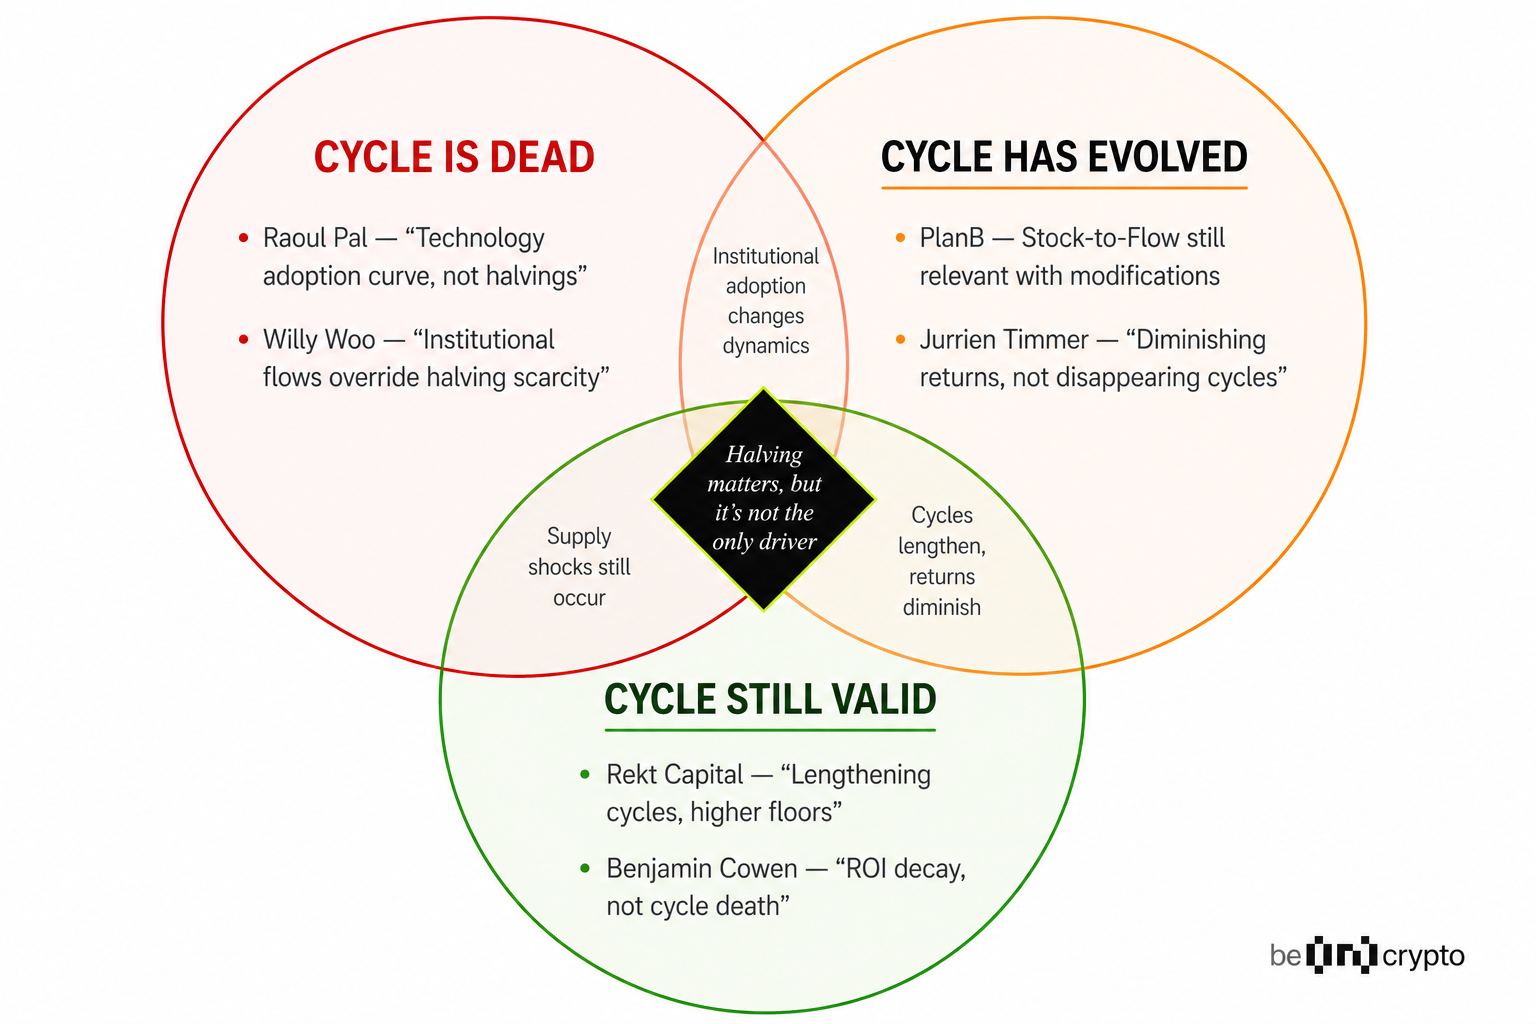
NYDIG argues that Bitcoin’s early 2026 decline looked consistent with the historical four-year cycle. The firm classified the October 2025 high as a cyclical top and said the drawdown’s timing and depth supported the cycle-intact view. NYDIG’s MVRV analysis shows the ratio approaching levels historically associated with cycle bottoms, with a 1.0x MVRV corresponding to approximately $55,326 as of Q1 2026.
Grayscale, in contrast, expects the four-year cycle thesis to prove wrong. The firm sees 2026 as part of an institutional era where steadier capital inflows and deeper integration with traditional financial markets replace the old boom-bust rhythm.
Fidelity’s own analysts are split, with some supporting the supercycle thesis and others, like Jurrien Timmer, arguing the traditional pattern remains intact.
The balanced answer is that the Bitcoin four-year cycle has changed, not vanished. The halving still matters, but it no longer explains the full cycle by itself. In 2026, Bitcoin’s market cycle depends on supply, ETF demand, institutional allocation, derivatives positioning, and global liquidity conditions.
Which Bitcoin cycle signals matter most in 2026?
As of April 2026, the better question is not whether the old cycle still works. It is whether the underlying data supports the move. These seven signals help separate real demand, excess leverage, liquidity stress, and long-term holder behavior:
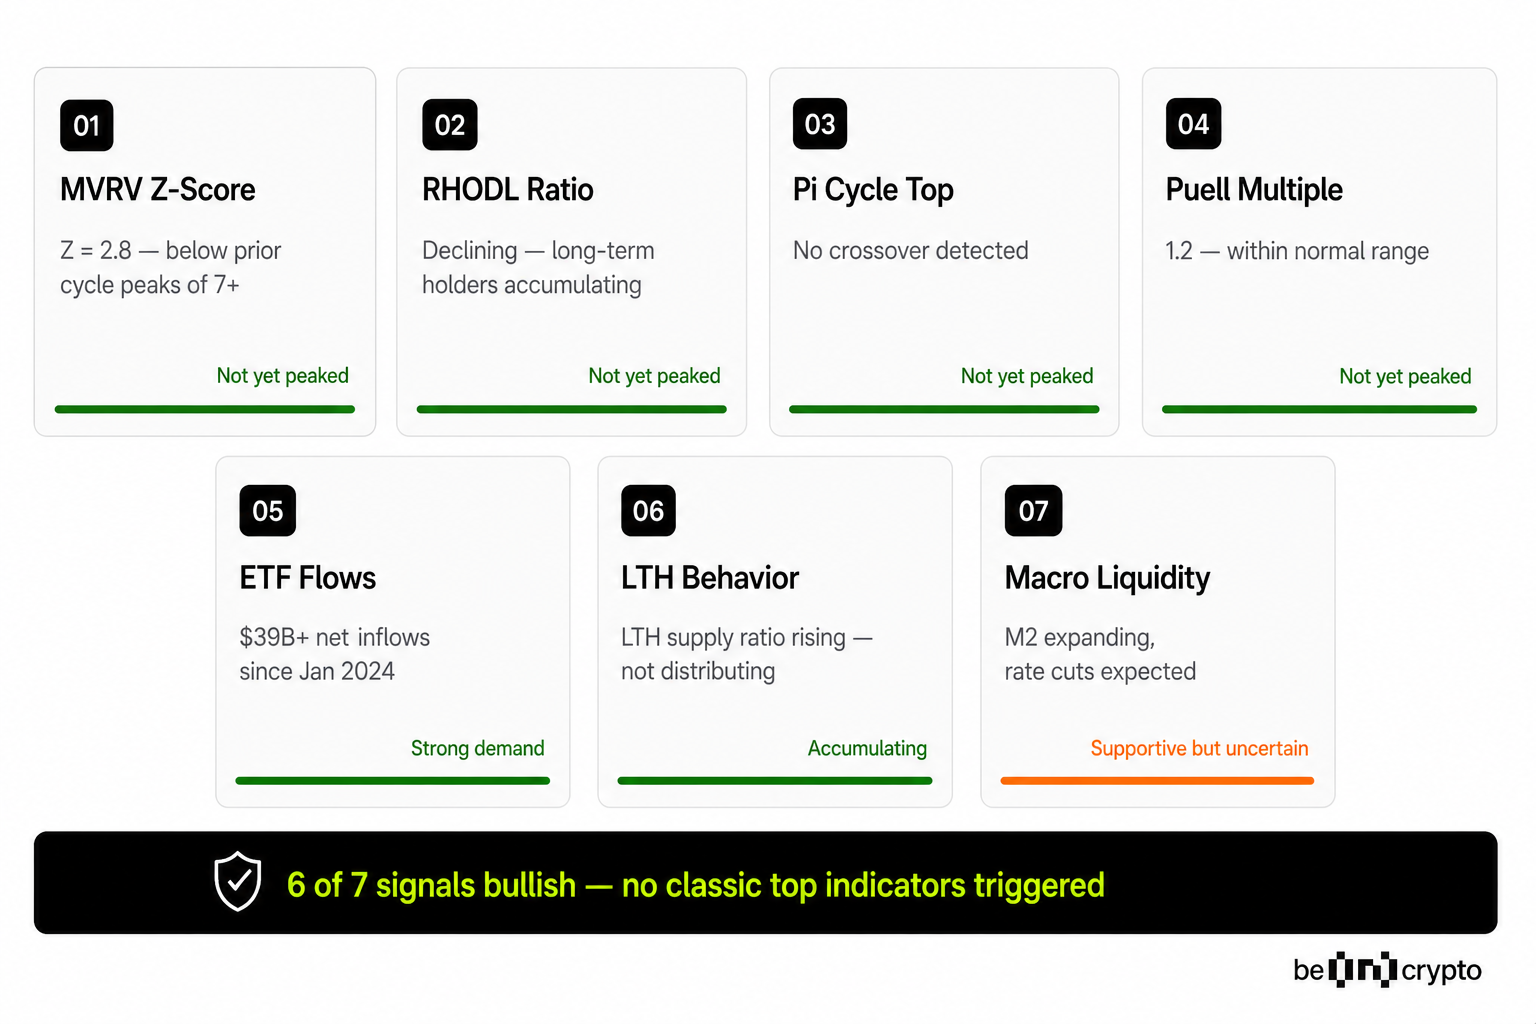
ETF Inflows and Outflows
ETF flows can now support or weaken BTC demand faster than in earlier cycles. As of the week ending Apr. 20, 2026, CoinShares reported $1.2 billion in digital-asset inflows, extending a four-week streak. Sustained inflows compress available supply and support price, while outflows during risk-off periods can accelerate declines sharply.
MVRV and Realized Price
The Market Value to Realized Value (MVRV) ratio compares Bitcoin’s current market price to its realized price, the average cost basis of all BTC on the network weighted by the price at which each coin last moved on-chain.
NYDIG notes that in every prior major cycle drawdown, MVRV fell below 1.0 before a durable price floor formed. A reading below 1.0 typically signals capitulation, when most holders are sitting on losses. As of Q1 2026, a 1.0x MVRV corresponds to roughly $55,326 in BTC price, according to NYDIG.
Volatility
Volatility measures how much BTC price fluctuates over a given period. Lower volatility near all-time highs may signal a more mature market with fewer extreme swings. Fidelity Digital Assets found that 2025 was BTC’s least volatile year on record.
If volatility stays low relative to prior cycles, it supports the argument that the cycle has evolved rather than simply repeated.
Stablecoin Liquidity
Stablecoin dominance measures the share of total crypto market capitalization held in stablecoins like USDT and USDC. Kaiko reported that stablecoin dominance surged to approximately 10.3% during the early 2026 drawdown, exceeding levels seen after the FTX collapse in Q4 2022.
Historically, stablecoin dominance peaks have coincided with cycle bottoms. A decline in stablecoin dominance can signal that capital is rotating back into risk assets.
Derivatives Leverage
Derivatives leverage refers to the amount of borrowed capital used in futures and options markets. High leverage can amplify price moves in both directions. Kaiko notes that derivatives dominance reached 73.2% of total crypto market volume in February 2026.
Watching open interest, funding rates, and leverage ratios can help distinguish between organic buying and leveraged speculation.
Miner Economics
After the April 2024 halving, miners earn 3.125 BTC per block. The reduction from 900 BTC to 450 BTC per day in new issuance still matters, but it now affects a larger and more mature market than in previous halvings. When BTC price falls below miner breakeven costs, miners may sell reserves to cover operating expenses, adding selling pressure at vulnerable moments. Hash rate trends and miner reserve data can signal whether miners are accumulating or distributing their holdings.
Long-Term Holder Behavior
Long-term holders (LTHs) are addresses that have held BTC for at least 155 days without moving it. When LTHs begin distributing coins during price rallies, it often signals that experienced participants are taking profit near cycle peaks. When LTHs accumulate during drawdowns, it can indicate that conviction holders see value at lower prices.
In Q1 2026, the shift of roughly 12% of circulating supply into ETPs and public companies, according to Fidelity, added a new layer to this signal because ETF-held BTC behaves like a long-term holding even though its owners may rotate at the fund level.
How to read the Bitcoin cycle in 2026 (and what does this mean for investors)?
All factors considered, the old Bitcoin four-year cycle can still help with understanding broad timing and market psychology. It should not be used as a standalone strategy.
| Same as past cycles | Different this time |
| Halving still cuts new supply | Bitcoin hit an ATH before the 2024 halving |
| Cycle timing still partly lines up | Spot ETFs changed demand timing |
| Drawdowns still happen | Institutions now influence flows |
| Investor psychology still matters | Volatility cooled near record highs |
| Macro shocks still move price | Derivatives and ETF flows amplify moves |
Looking ahead, this shift may accelerate. Grayscale estimates that less than 0.5% of U.S. advised wealth is allocated to crypto as of early 2026. If that figure rises to even 1-2% as regulatory clarity improves and more platforms integrate crypto into model portfolios, ETF-driven demand could structurally outweigh the supply impact of future halvings.
The next halving, expected around April 2028, will reduce the block reward to 1.5625 BTC. By then, the marginal supply shock will be smaller still, while the institutional base will likely be larger. The practical implication is that the signal framework outlined above may matter more with each passing cycle, not less.


