


The Kusama (KSM) price could be close to completing its five-wave downward movement, after which a relief rally is expected to occur.
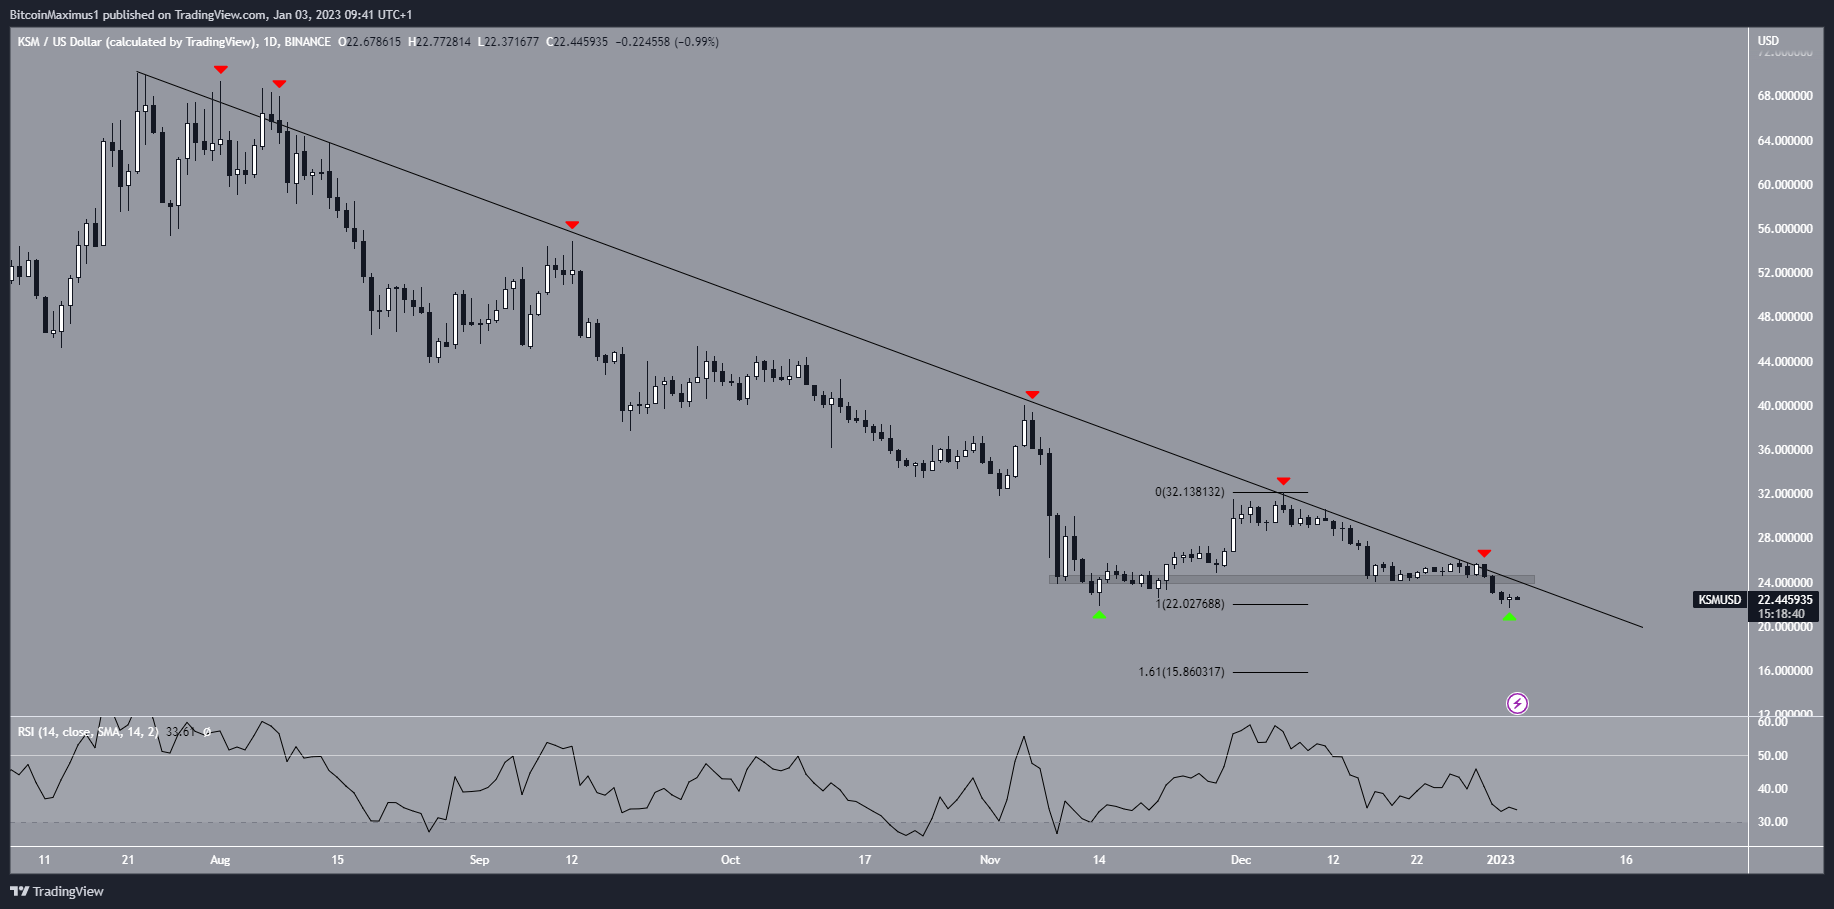
The KSM price has fallen below a descending resistance line since July 2022. The line has caused six rejections (red icons) so far, the most recent on Dec. 30. This led to a minimum price of $20.62 on Jan. 2.
There is no clear horizontal support below the current price. The main support area was at $24.30, but that has now been broken. So, the next closest support area is created by the 1.61 external Fib retracement at $15.86.
While there is hope for a potential double bottom (green icons), the pattern has not been combined with bullish divergence in the RSI. On the contrary, the RSI is below 50 and decreasing.
As a result, the KSM price analysis from the daily time frame is leaning bearish. In turn, this would lead to a bearish KSM price prediction for Jan., suggesting that the future price will drop below $20.
A breakout above the descending resistance line and the $24.30 resistance area would invalidate this bearish price forecast.
KSM Price Prediction For Jan: New Lows Before Relief
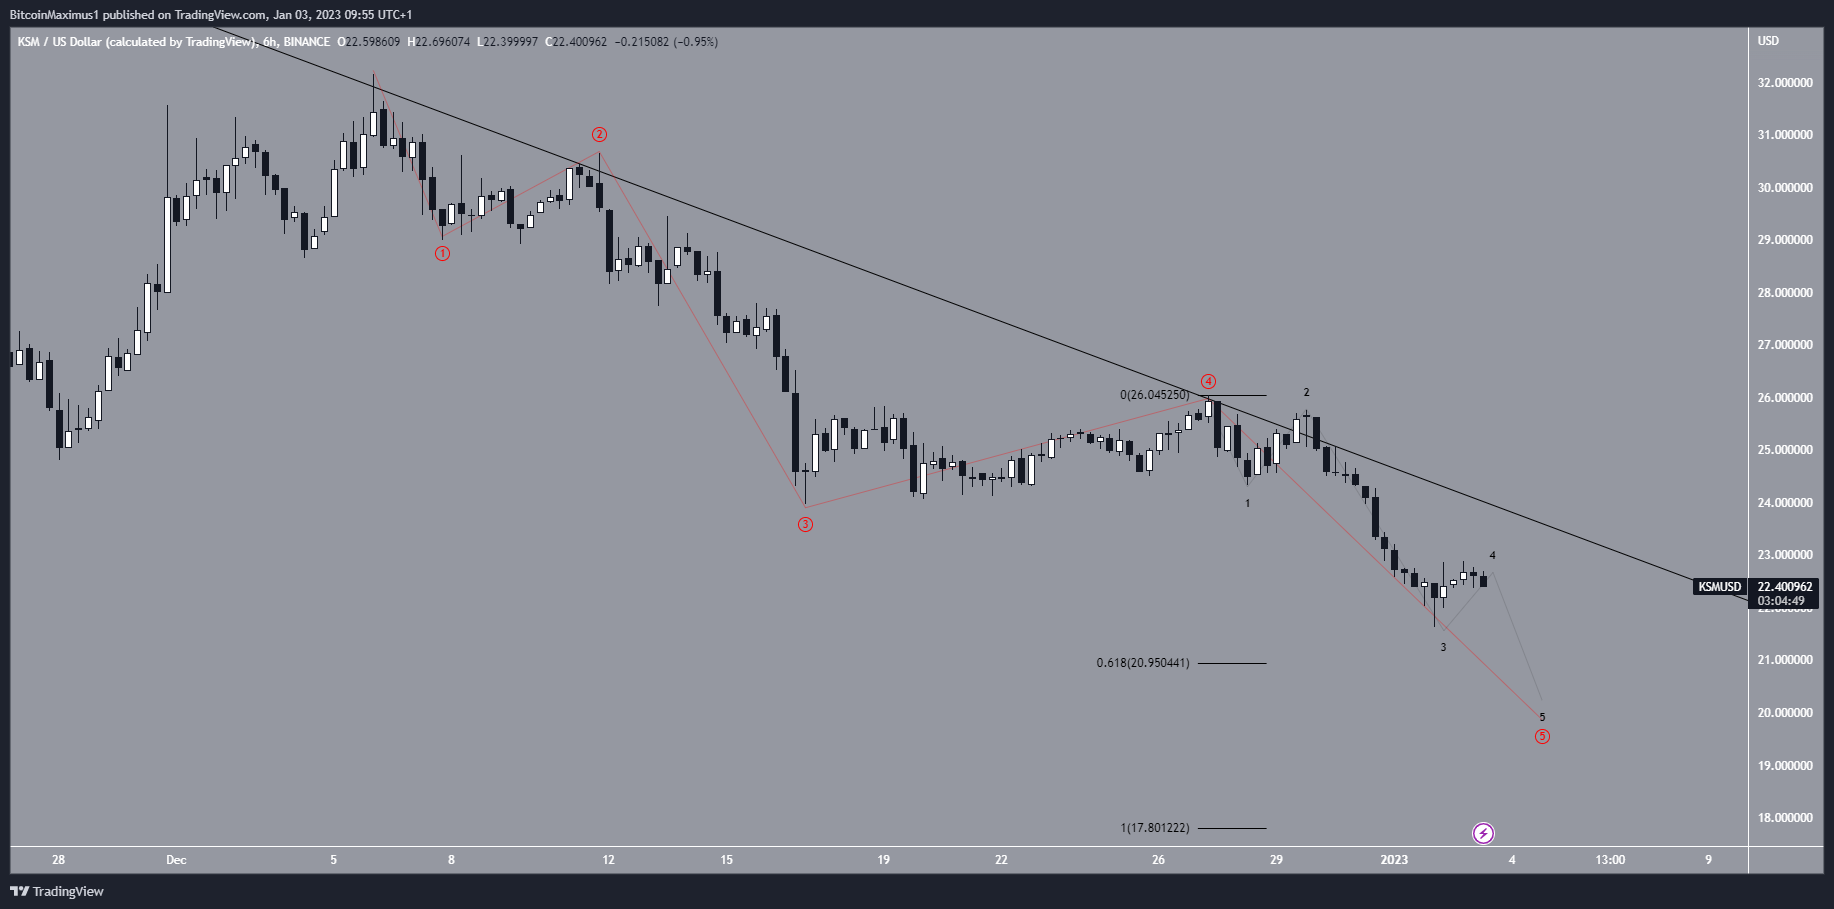
The technical analysis from the six-hour chart shows that the KSM price is in the process of completing a five-wave downward movement (red). If so, it is currently in wave five. The short-term sub-wave count indicates that the Kusama price is also in sub-wave five (black), which could potentially be completed over the next 24 hours.
If the count is correct, the Kusama price will fall toward either $20.95 or $17.80. The targets are found using the 1:0.618 and 1:1 projections of waves one and three (red). The latter is also close to the previously outlined Fib support area, so it could be reached if the final downward movement extends.
However, what follows a five-wave downward movement is usually a sharp retracement. If that occurs, the KSM price will eventually break out from the descending resistance line.
To conclude, the future KSM price movement is unclear. However, due to the relatively bearish short-term price action and wave count, a fall below $20 is the most likely scenario. If this occurs, it would presumably be followed by a relief rally.
A breakout from the long-term descending resistance line would indicate that the downward movement is complete.
For BeInCrypto’s latest crypto market analysis, click here.


