


Komodo (KMD) is currently retracing after a sharp upward movement on July 13 which left a long upper wick of 42%. It could soon make another attempt at breaking out.
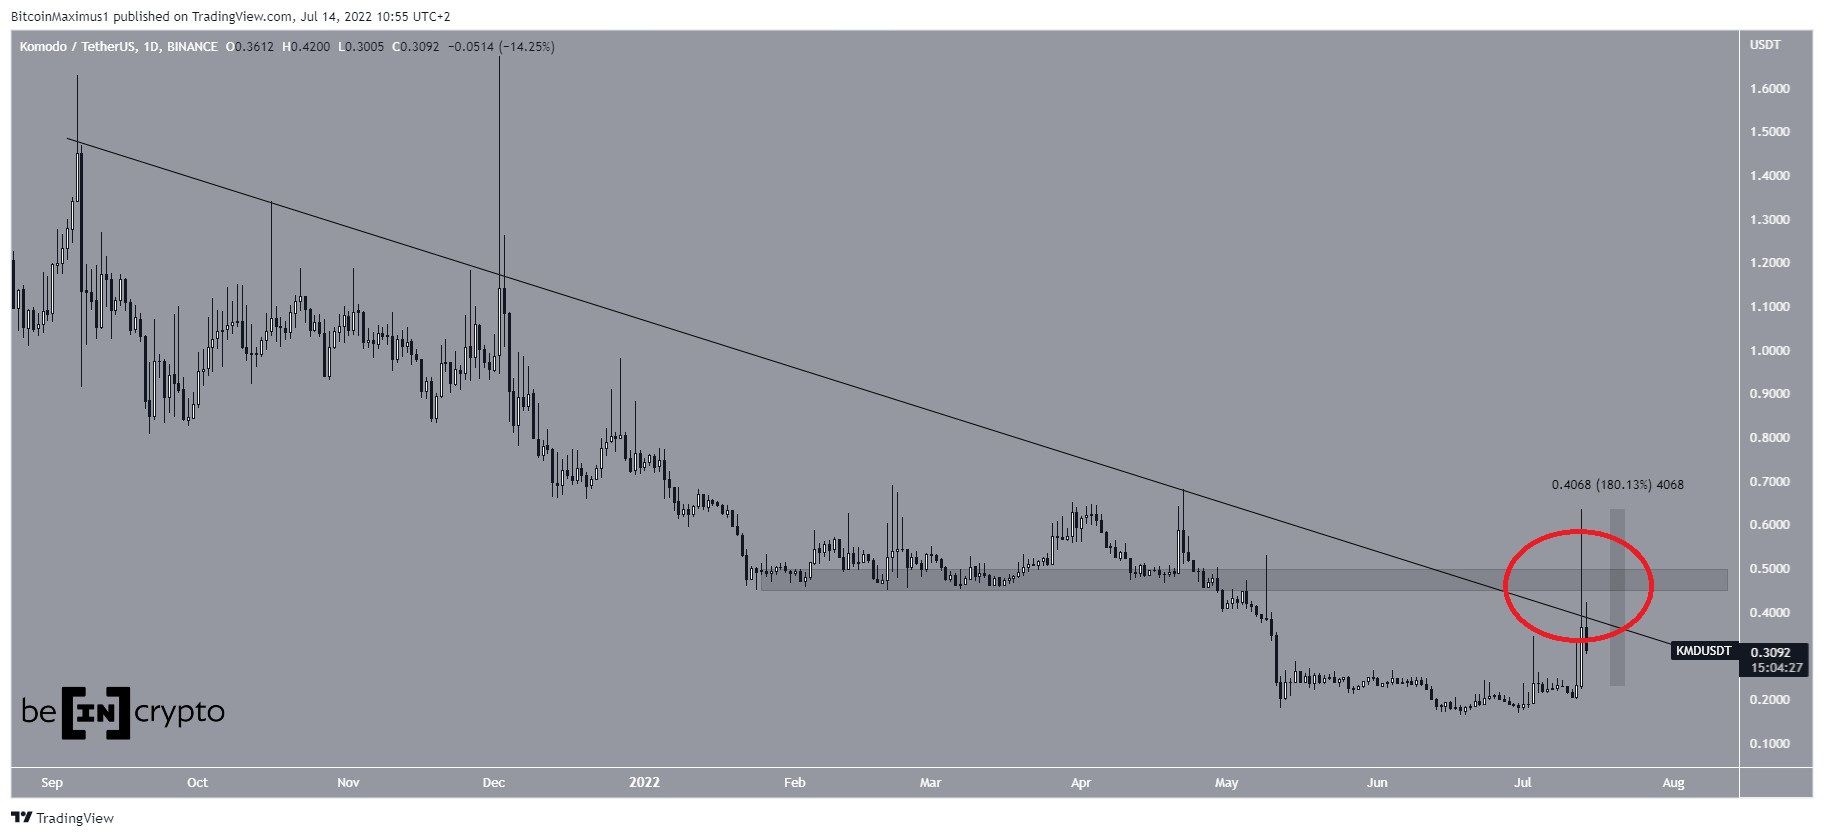
KMD has been falling underneath a descending resistance line since Sept. So far, this downward movement has led to a low of $0.158 in June.
The price initiated an upward movement afterwards and increased by 180% on July 13.
Despite this massive increase, the price failed to break out from the descending resistance line and created a long upper wick instead.
Such wicks occur after considerable selling pressure. Additionally, it validated the $0.475 horizontal area as resistance (red circle).
So, the trend cannot be considered bullish unless the price manages to break out from both these levels.
So far, the resistance line has been in place for 310 days.
Bullish RSI readings
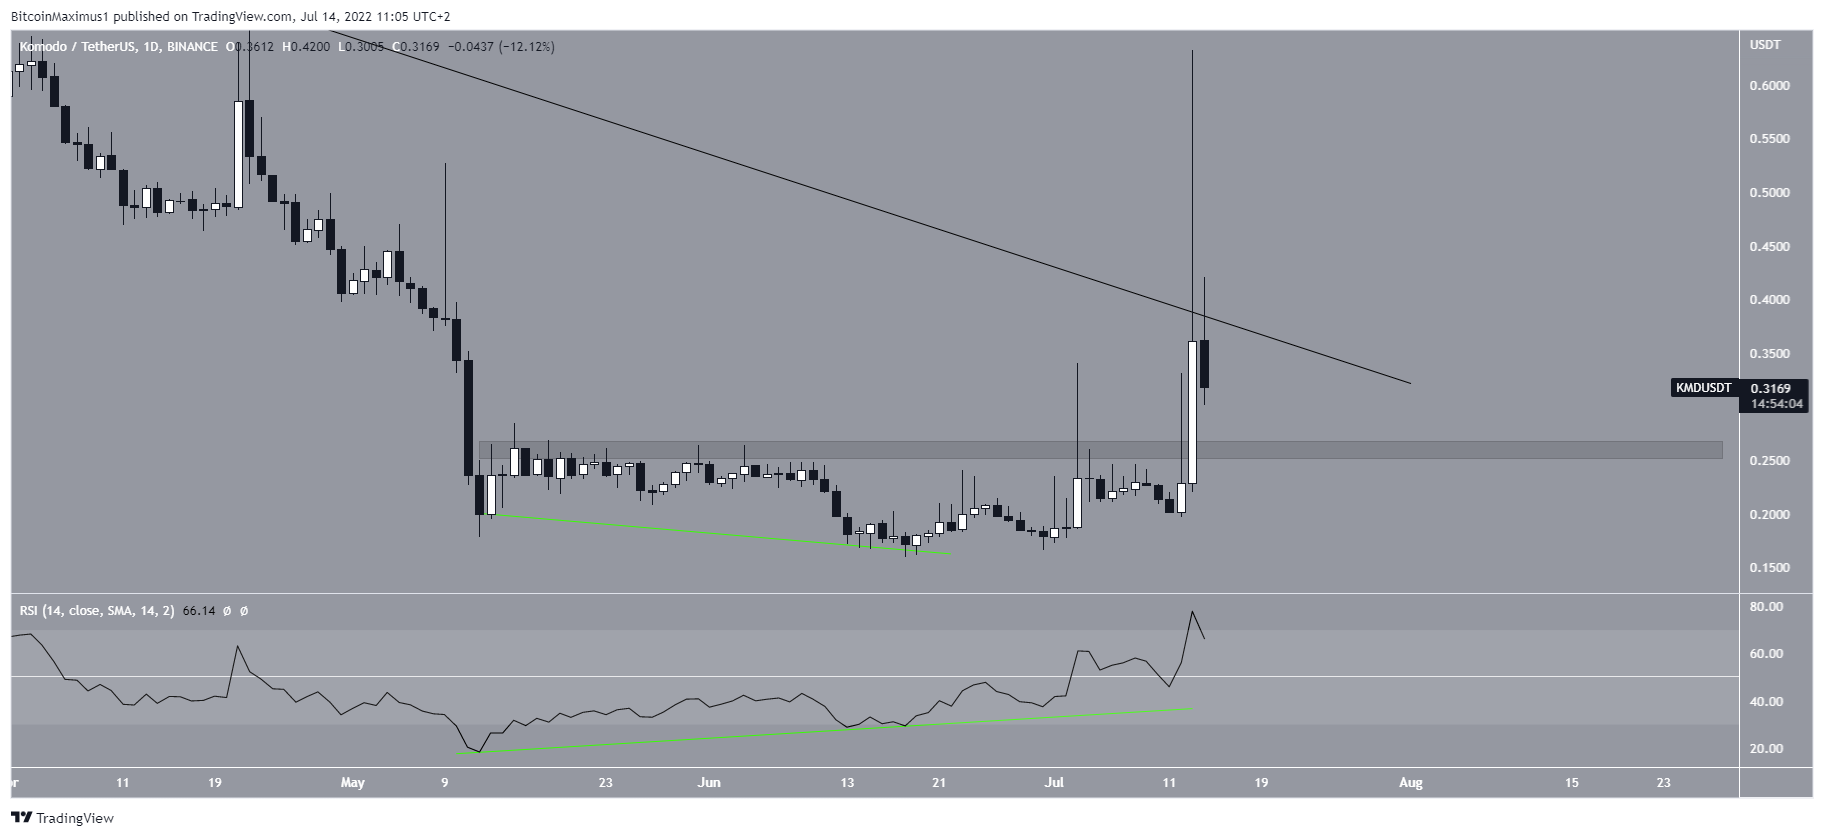
The daily RSI does provide a more bullish outlook and adds legitimacy to the breakout attempt.
The reason for this is that the RSI has been generating bullish divergence in the period between May 12 and June 18 (green line). Such divergences often precede sharp upward movements, as was the case for KMD. The RSI has also moved above 50.
Moreover, the price has moved above the $0.26 horizontal area, which is now expected to provide support in case the price retraces prior to another breakout attempt.
Future KMD movement
Cryptocurrency trader @TehLammbox tweeted a chart of KMD which shows that the price is breaking out.
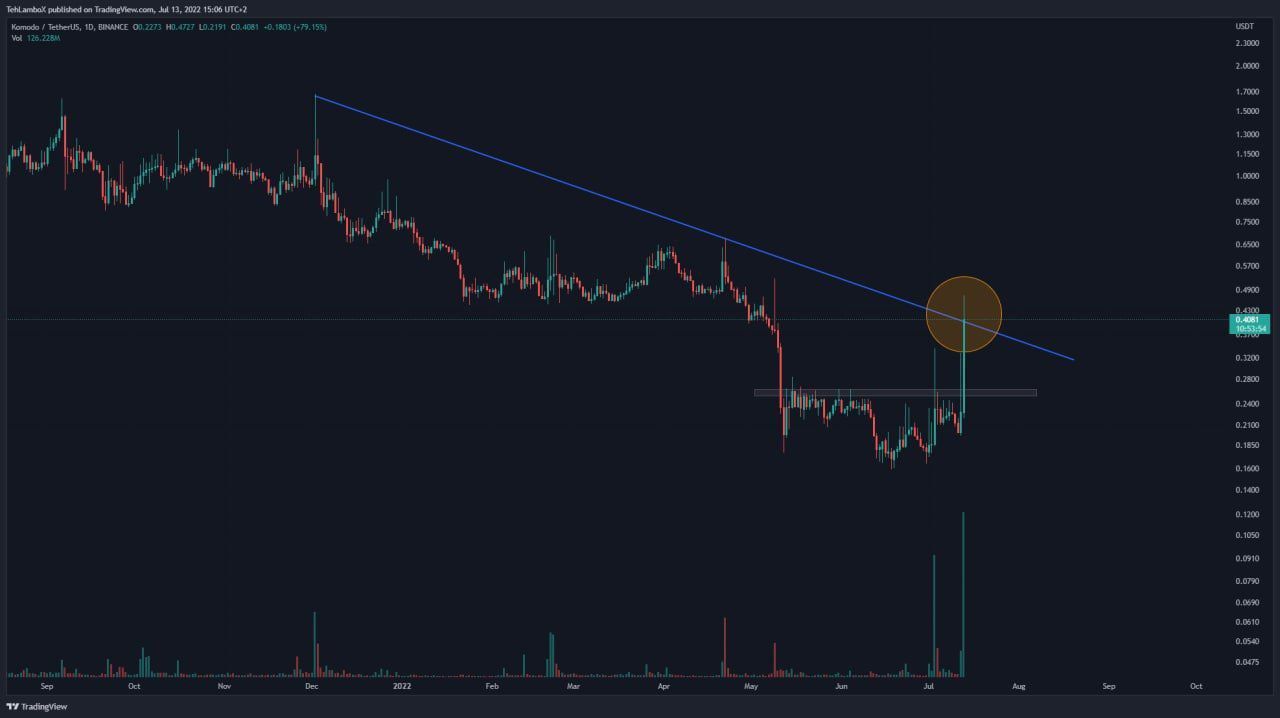
As seen in the previous sections, the price failed to break out and created a long upper wick instead.
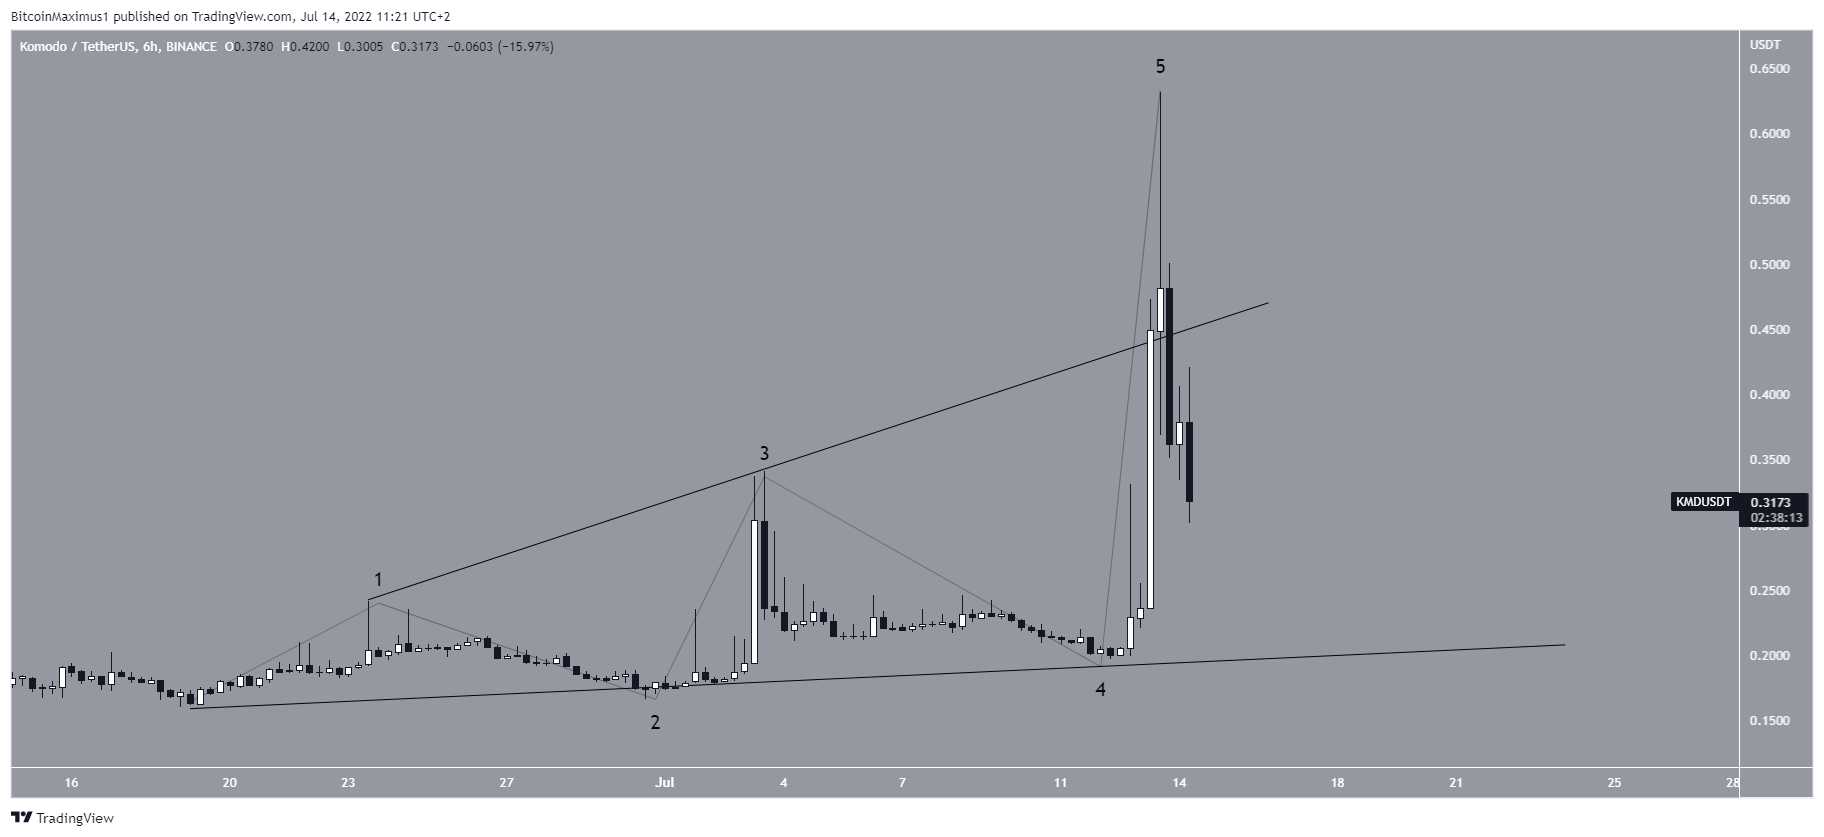
However, the entire increase does look like a five-wave upward movement that has taken the shape of a leading, expanding diagonal, in which wave five is extended.
If so, it is likely that this is the beginning of an extended upward movement, aligning with the daily RSI readings.
For Be[in]Crypto’s latest Bitcoin (BTC) analysis, click here.


