


The Kava.io (KAVA) price reached an all-time high of $7.40 on March 14.
However, KAVA has retested its previous all-time high, validating it as support.
It’s expected to continue moving upwards, possibly reaching an eventual high near $12.
KAVA Retests All-Time High
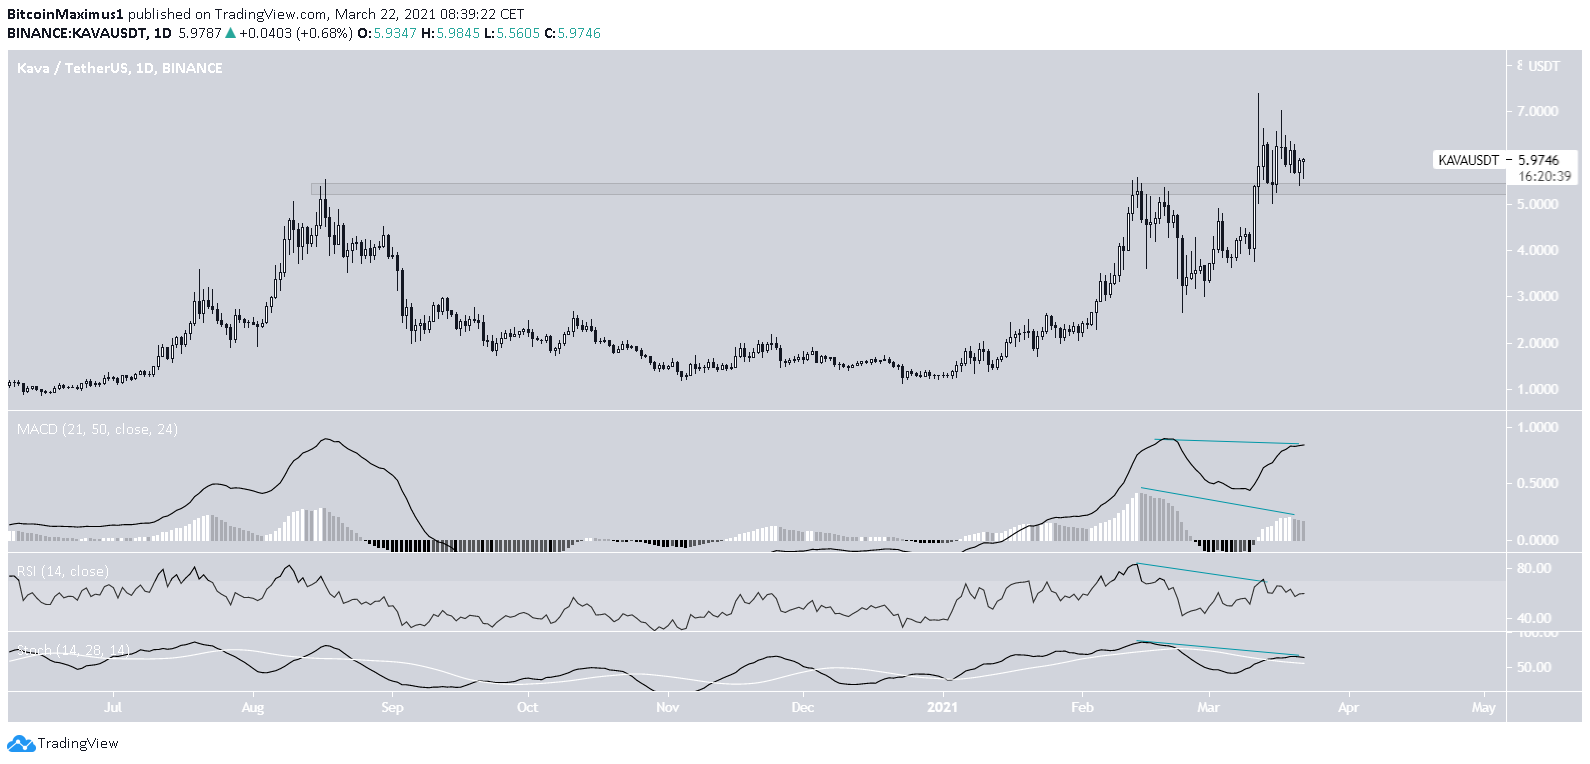
KAVA has been decreasing since reaching a new all-time high price of $7.40 on March 13.
While the token price has been decreasing since the drop served to validate the previous all-time high resistance at $5.90 as support.
Technical indicators provide a slightly unusual outlook.
The MACD, RSI, and Stochastic oscillator are bullish. The MACD is positive, the RSI is above 50, and the Stochastic oscillator has made a bullish cross. All three are increasing.
However, all three have also generated considerable bearish divergences.
Nevertheless, since a drop has already occurred as a result of the divergence, it’s possible that the occurrence played out and the trend is now bullish.
Short-Term Triangle
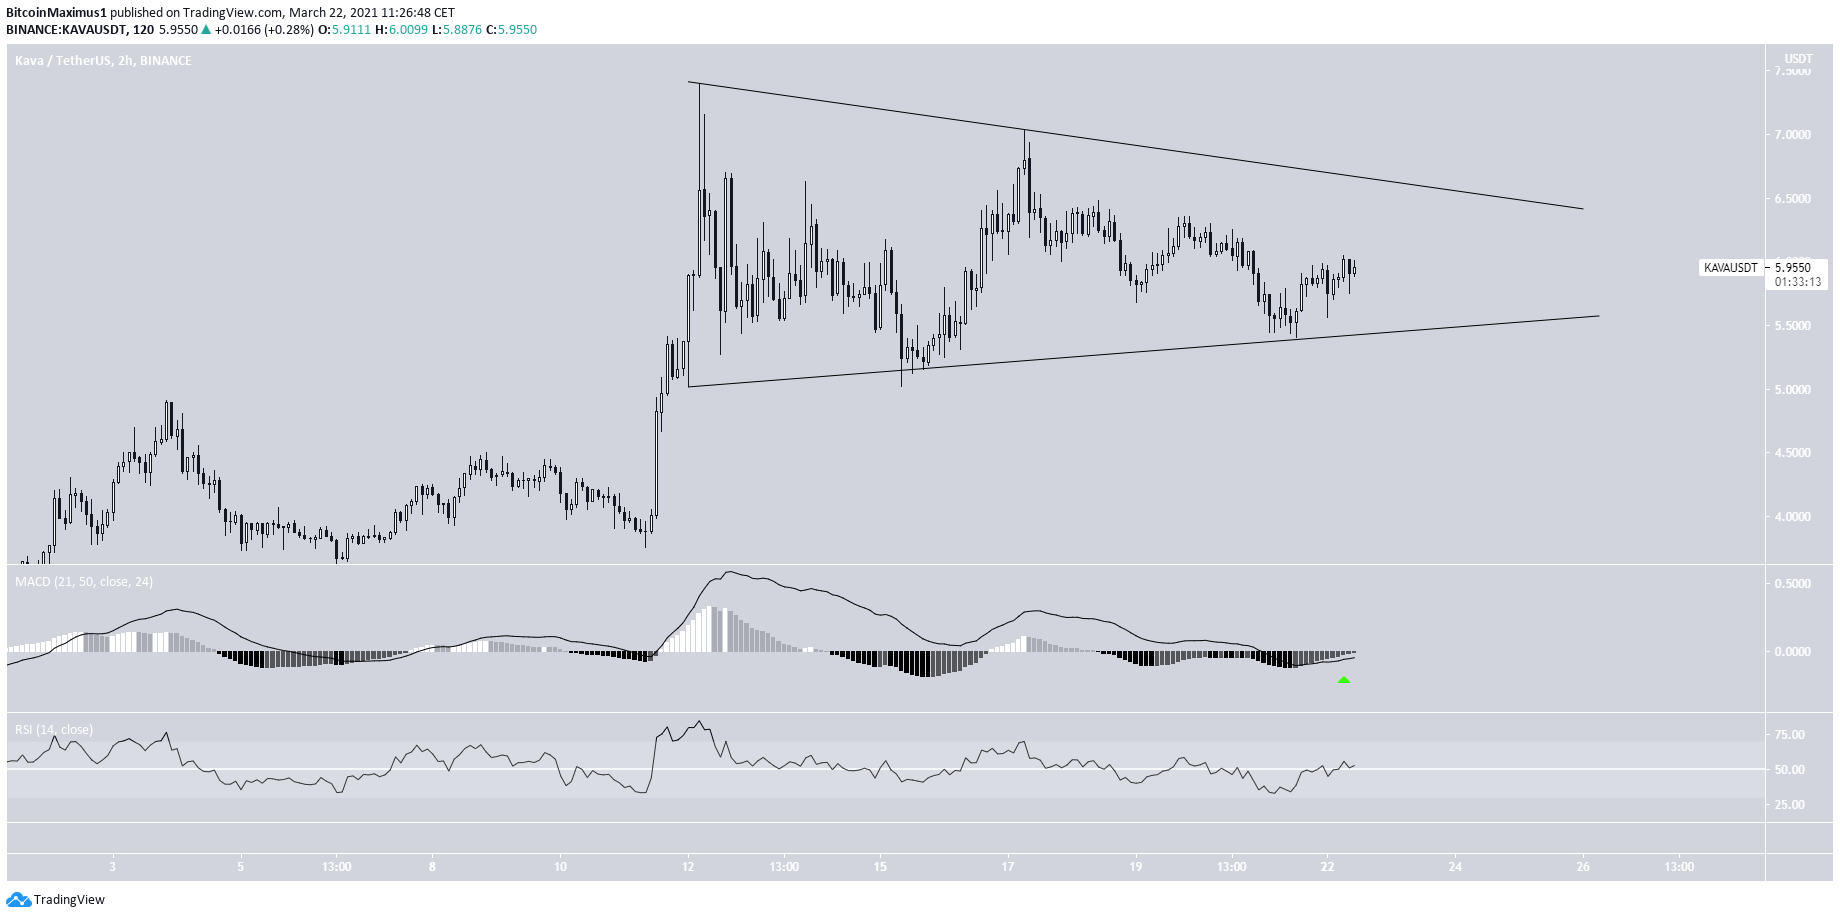
The two-hour chart shows a symmetrical triangle. This is normally considered a neutral pattern.
However, it is transpiring after an upward movement, thus a breakout would be more likely.
This possibility is also supported by the MACD, which has given a bullish reversal signal.
Wave Count For KAVA
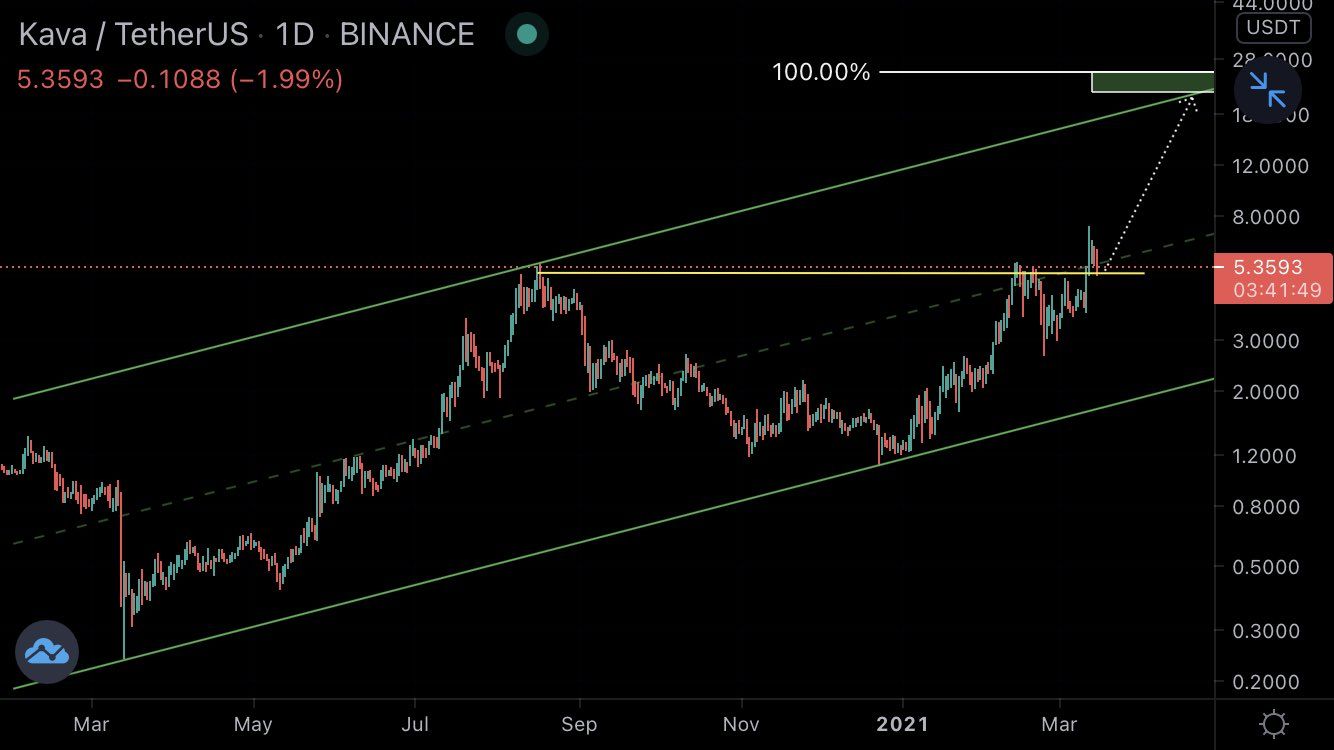
Cryptocurrency trader @Mesawine1 outlined a KAVA chart, stating that the price could go all the way to $25 in a few months.
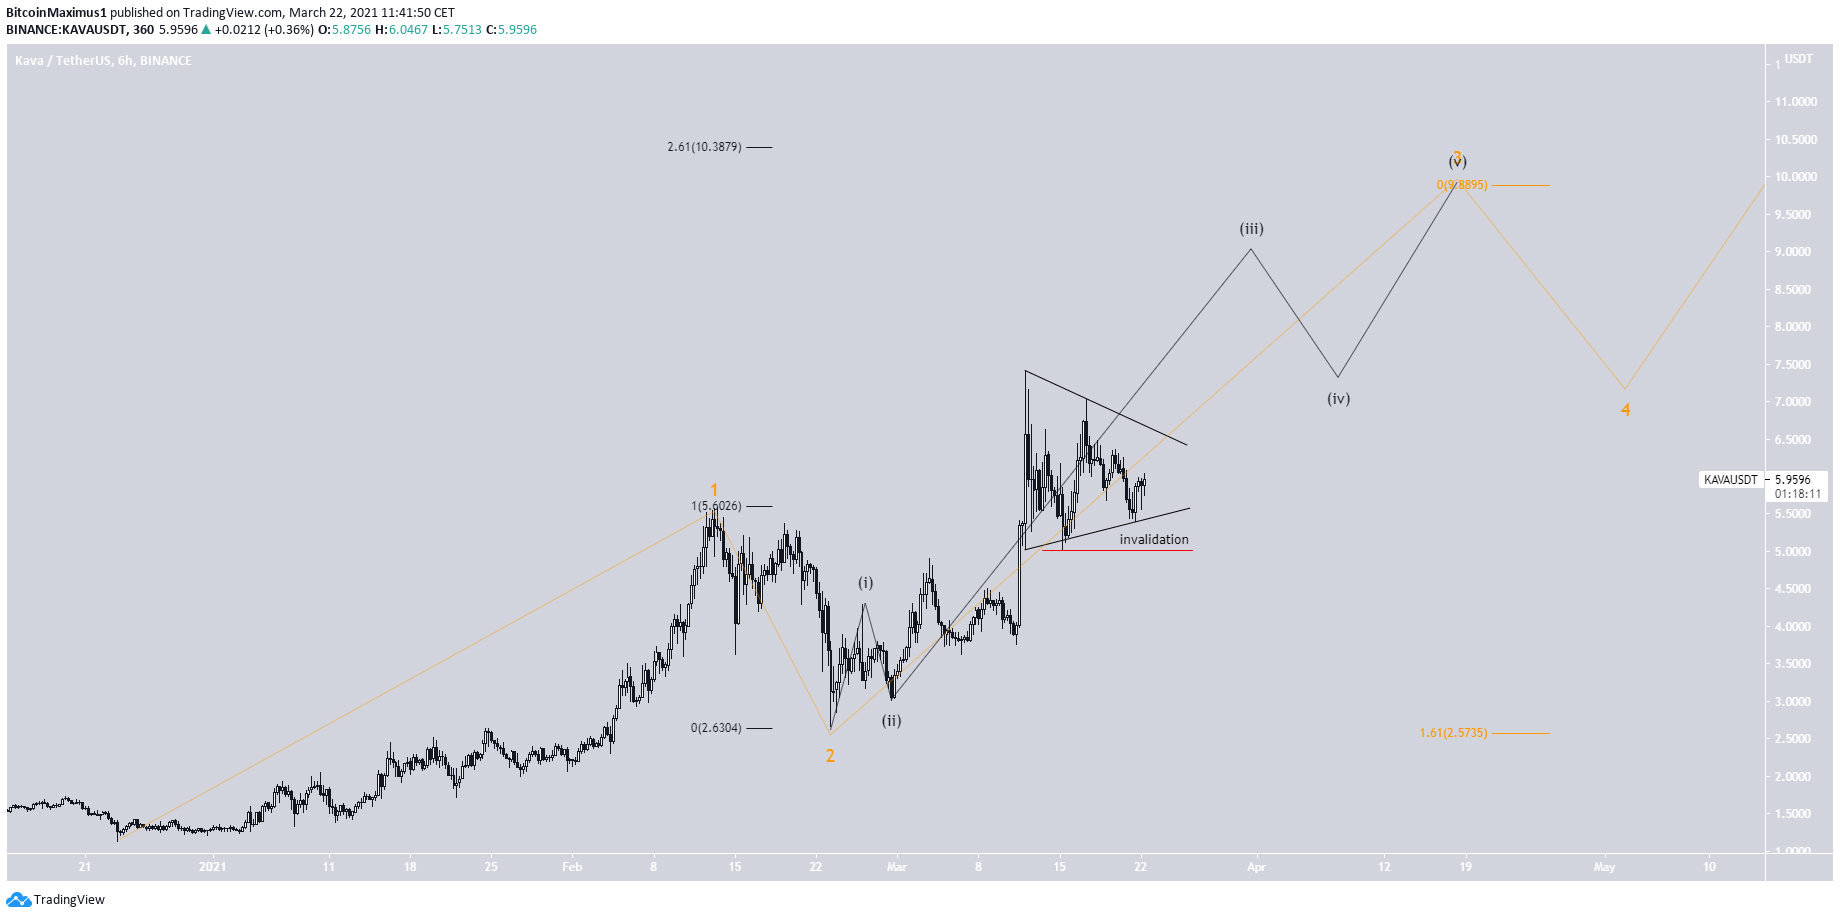
The wave count suggests that the token is in an extended wave three (white). A potential target for the top of the move is found near $12.90.
This is found by using an external Fib retracement on wave two.
The sub-wave count is shown in orange.
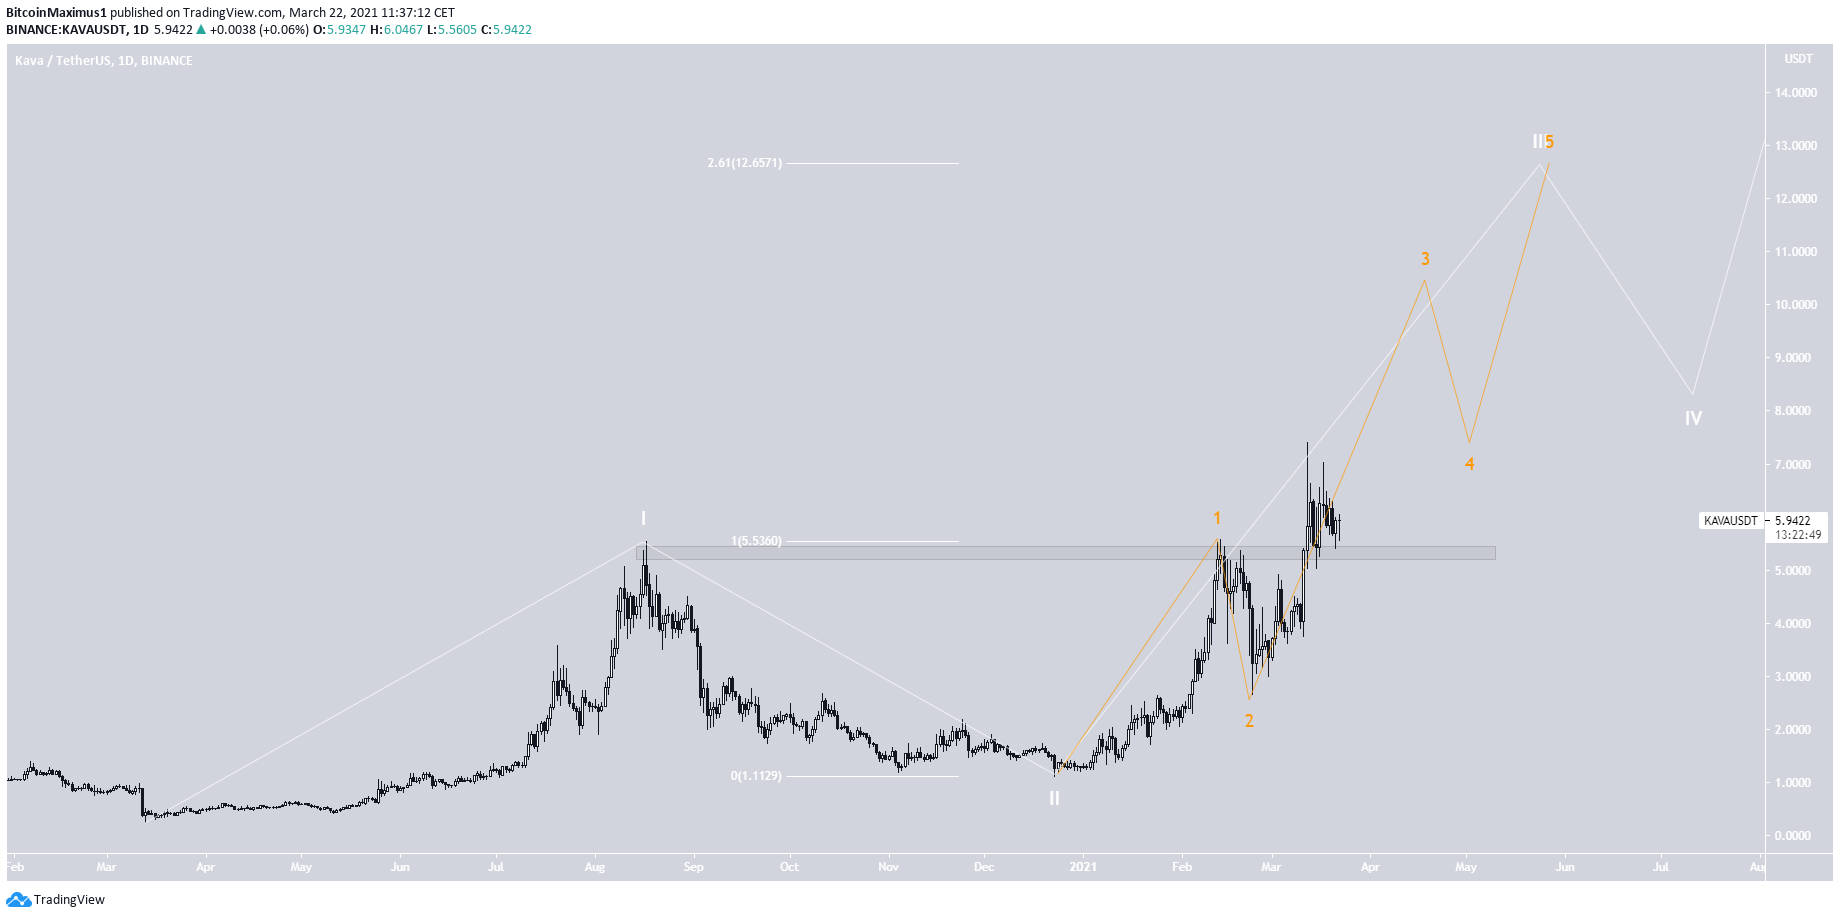
An even closer look shows another extended minor sub-wave three (black).
An intermediate target would be found between $9.88-$10.40. If it continues past this range, the price could move toward the previously given $12.90 level.
Conclusion
KAVA is expected to continue increasing as long as it is trading above the previous all-time high resistance at $5.40.
A potential intermediate target for the top of the movement is found near $10, while a longer-term target could possibly reach $12.90.
For BeInCrypto’s latest Bitcoin (BTC) analysis, click here.


