


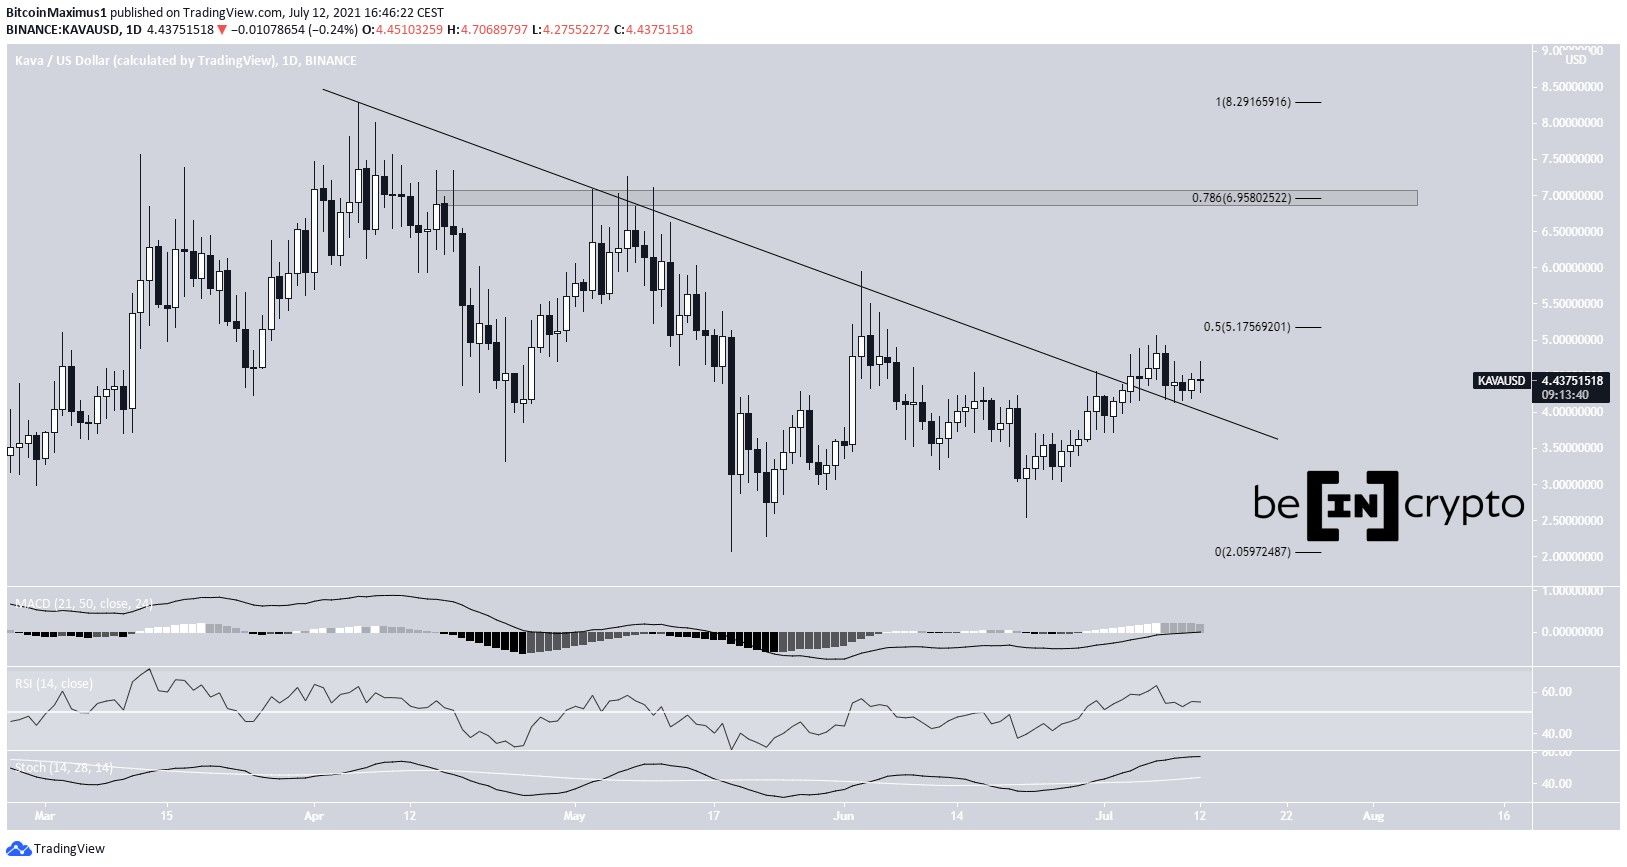
Kava.io (KAVA) has broken out from a descending resistance line that had been in place since the April 6 all-time high price.
It has validated the line as support afterwards and could continue moving towards the resistance levels outlined below.
KAVA breaks out
KAVA had been decreasing alongside a descending resistance line since April 7, when it reached an all-time high price of $8.28. It continued its descending until it reached a low of $2.07 on May 19.
However, it has been moving upwards since. It broke out from the descending resistance line on July 4 and is currently in the process of validating it as support.
The closest resistance areas are at $5.17 and $6.95. The latter is both the 0.786 Fib retracement resistance level and a horizontal resistance area.
Technical indicators are relatively bullish. The MACD is positive and the RSI is above 50. The Stochastic oscillator has made a bullish cross and is moving upwards.
Therefore, a movement towards at least one of these resistance areas seems to be the most likely scenario.
Wave count
Cryptocurrency trader @Mesawine1 outlined two KAVA charts, showing both the bullish and bearish counts in place. The bearish one below indicates that the token will reach a high near $7 before falling once more.
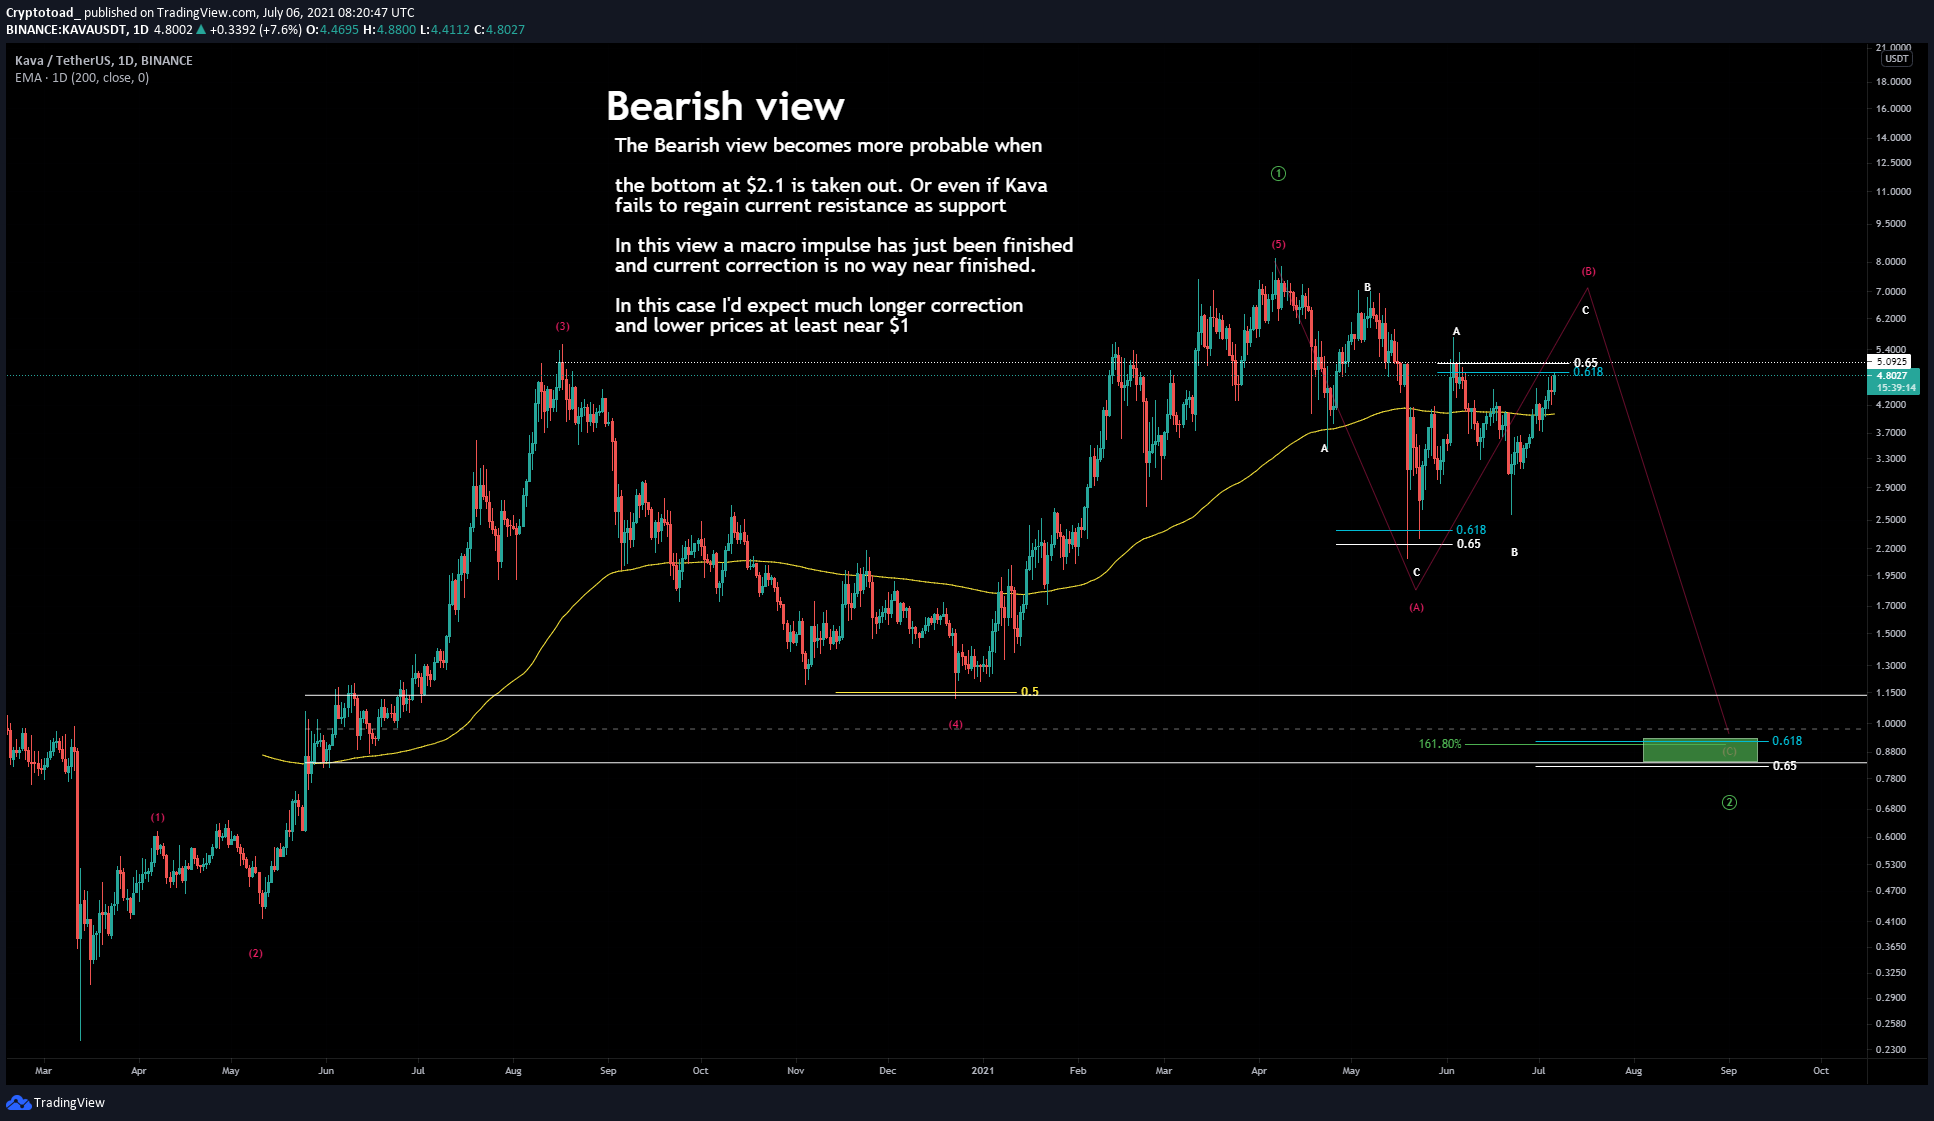
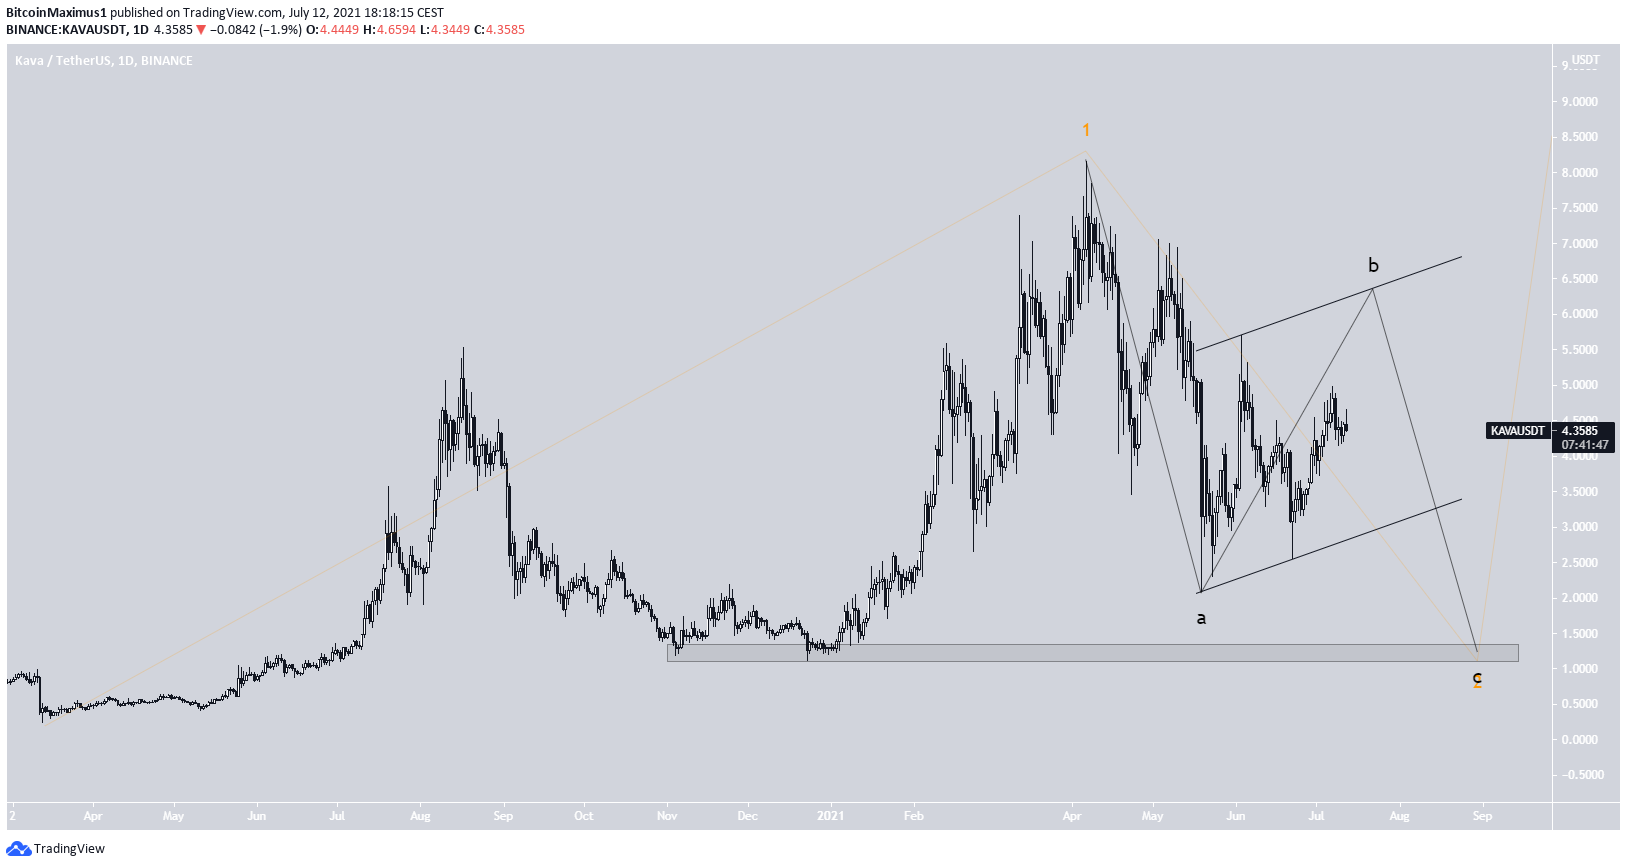
The bearish case indicates that KAVA is in sub-wave B (black) of an A-B-C corrective structure. In this possibility, the token will increase towards the previously outlined $6.95 resistance area before falling once more.
A potential low for the entire movement could be reached near the $1 area.
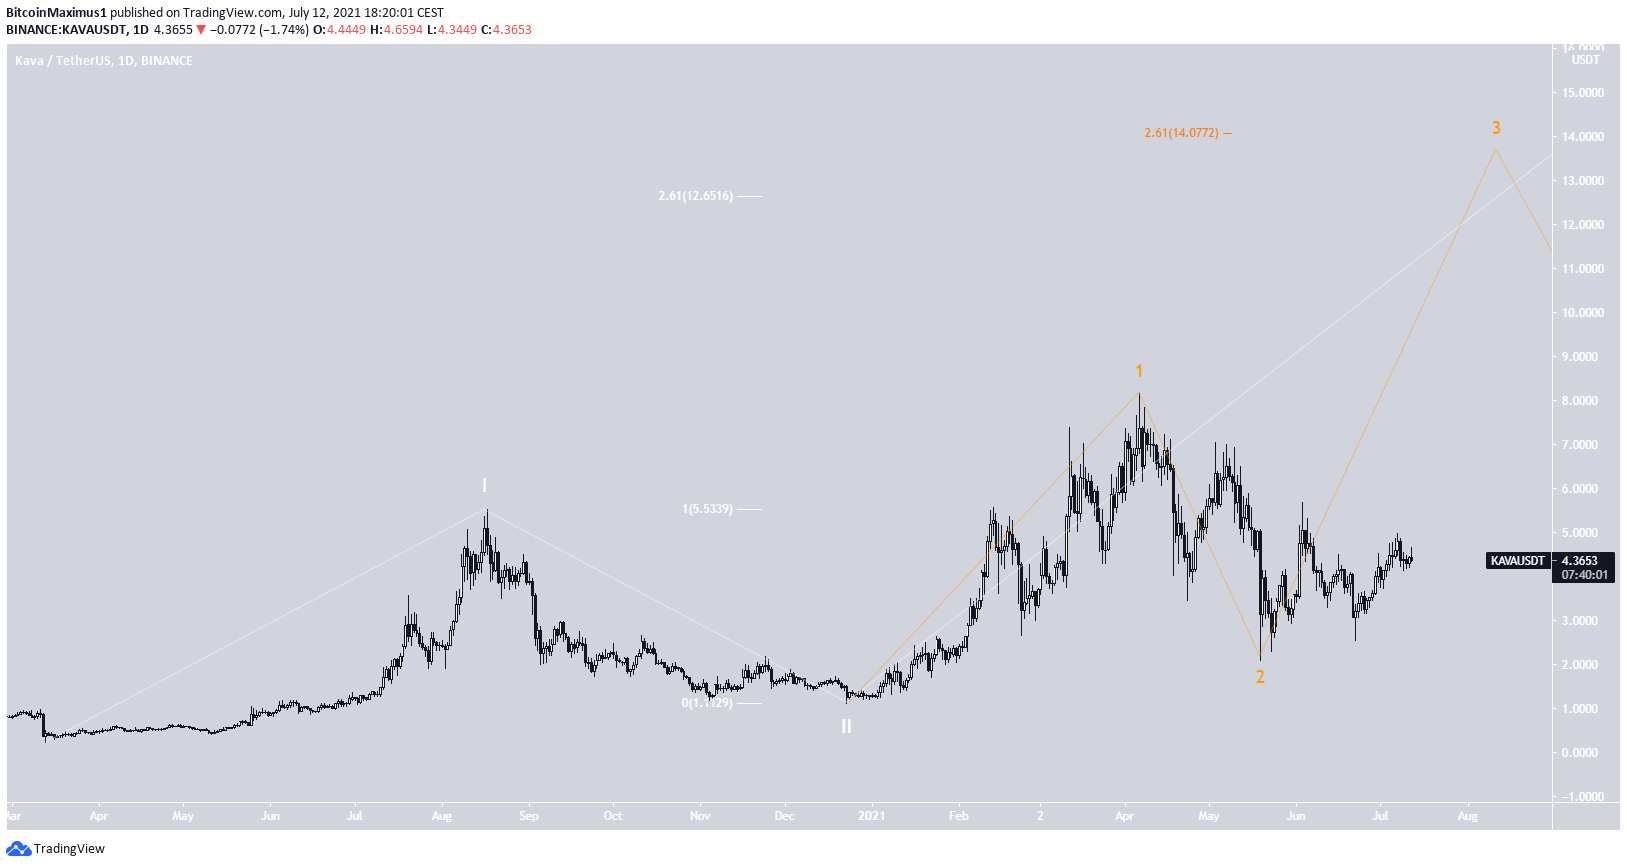
The bullish count suggests that the entire movement since March 2020 is part of a 1-2/1-2 wave structure. In this case, KAVA would continue towards a new all-time high.
In any case, a movement towards the $6.95 area would be likely either way. The reaction once it gets there will be key in determining the future movement
KAVA/BTC
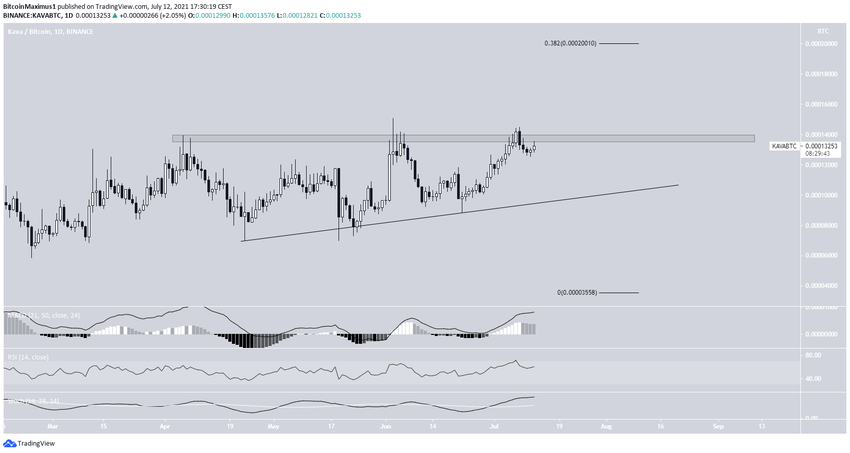
The KAVA/BTC chart looks more decisively bullish than its USD counterpart. It has been following an ascending support line since April 23.
While following the line, it has made three attempts at moving above the 13,800 satoshi resistance area. It is possible that it is trading inside an ascending triangle, which is considered a bullish pattern.
Technical indicators in the daily time-frame are also bullish. The Stochastic oscillator has made a bullish cross, the MACD is positive and the RSI is above 50.
If KAVA breaks out, the next closest resistance would be at 20,000 satoshis, the 0.382 Fib retracement resistance level.
For BeInCrypto’s latest bitcoin (BTC) analysis, click here.



