


Kadena (KDA) is in the process of reclaiming the resistance area of its previous trading range.
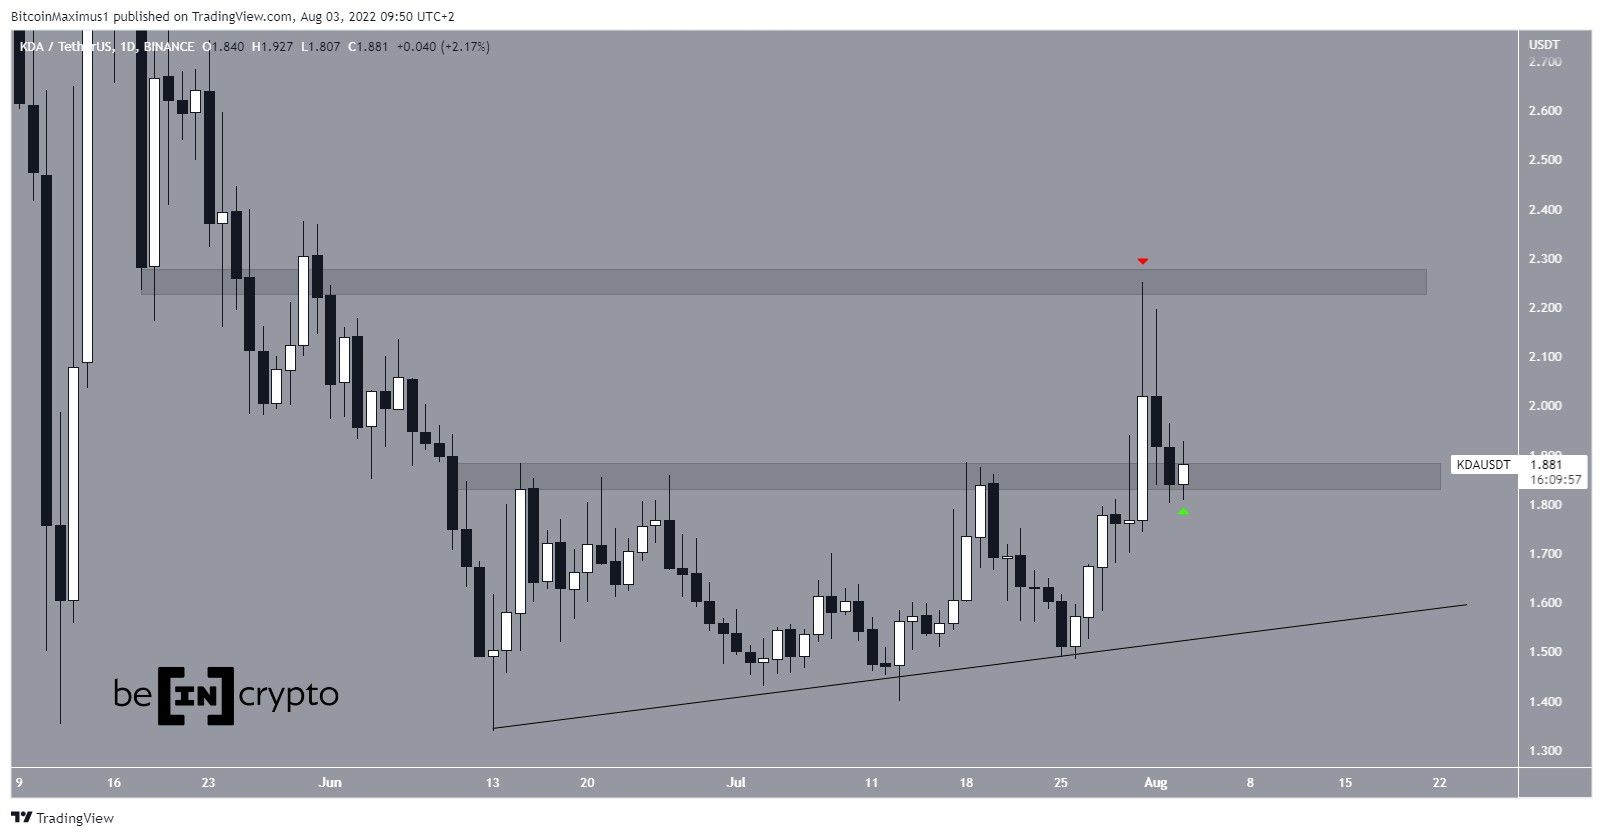
KDA has been increasing alongside an ascending support line since June 13. More recently, it bounced at the line on July 26 and proceeded to reach a high of $2.25 on July 31. However, the price has been falling since.
Currently, it is trading just above the $1.85 horizontal area, validating it as support (green icon). Conversely, the $2.25 high (red icon) served to validate the $2.25 area as resistance.
Future movement
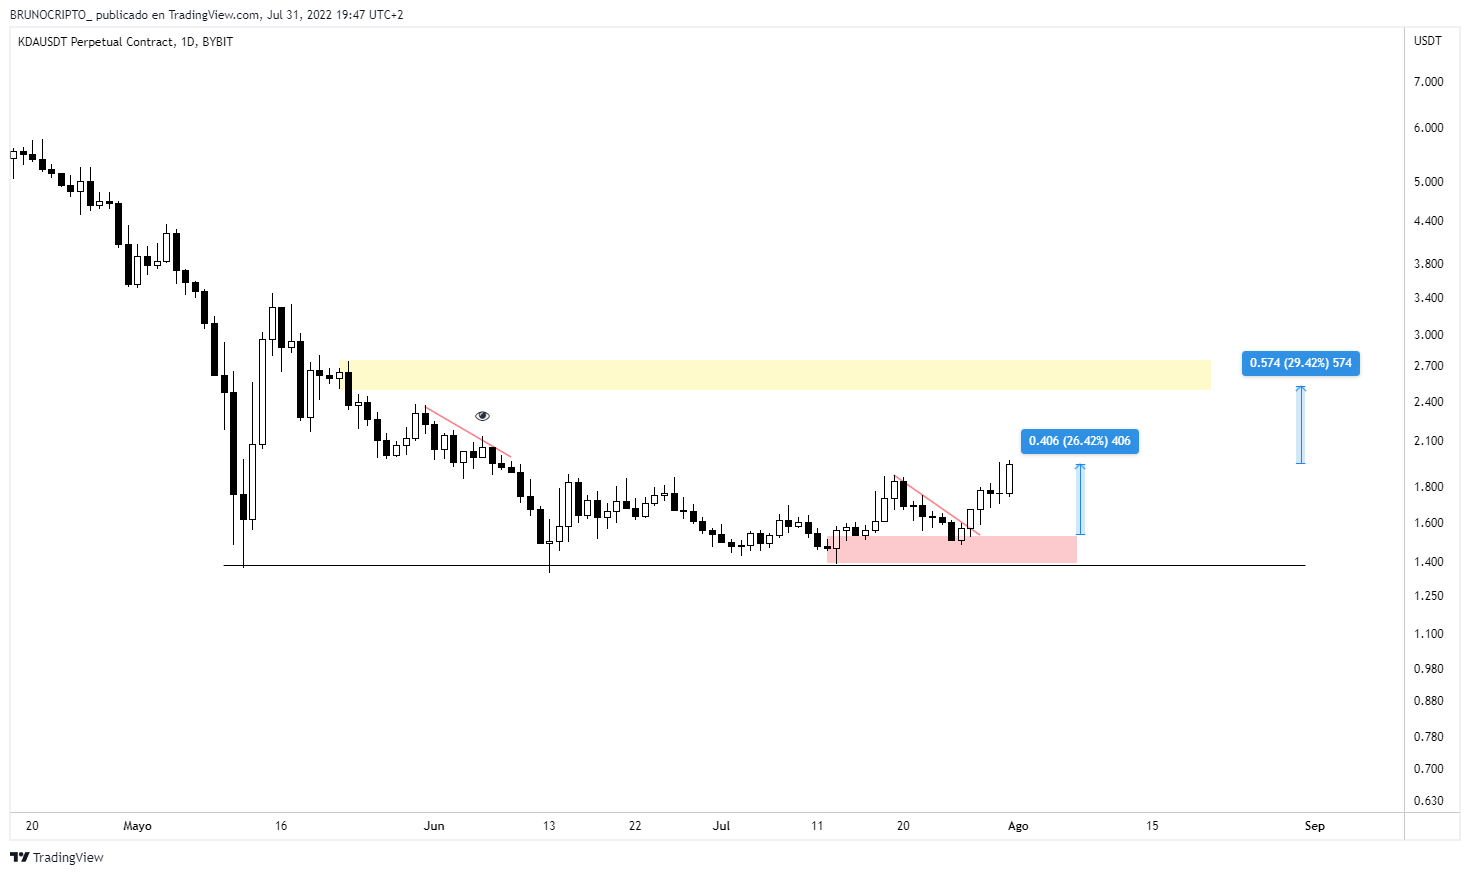
Cryptocurrency investor and trader @BRUNOCRIPTO_ tweeted a chart of KDA, stating that the price could increase all the way to $2.75.
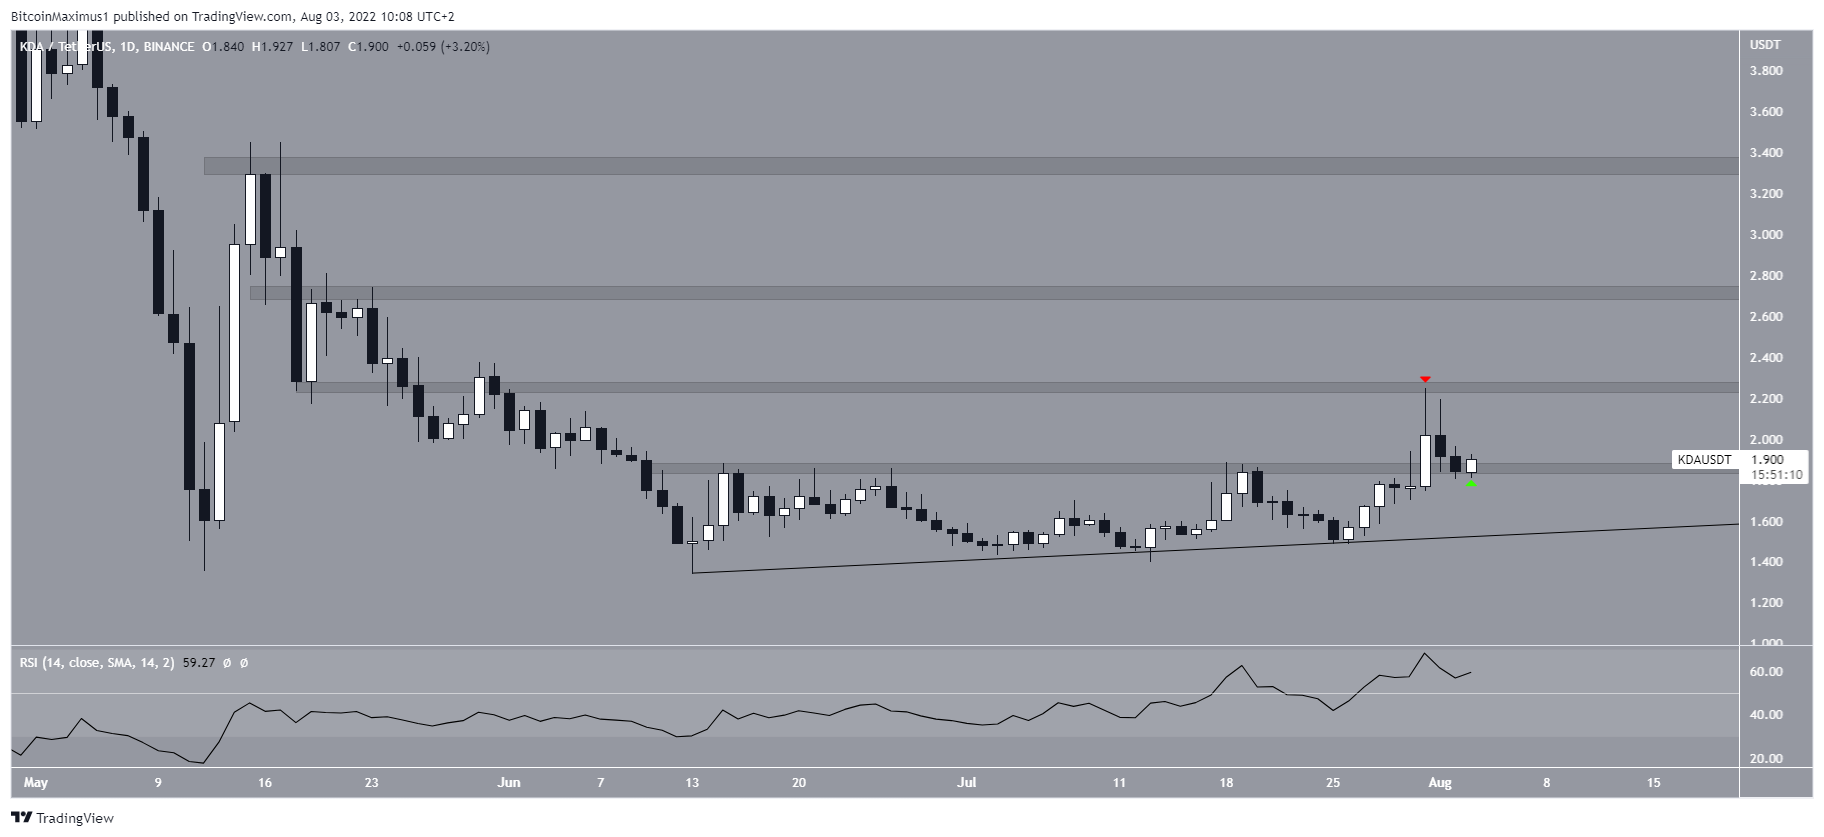
The daily RSI does support this upward movement, since it has decisively broken out above 50. This is often considered a sign of a bullish trend.
If the price manages to move above the $2.25 resistance area, the next closest resistance would be at $2.75, aligning with that given in the tweet.
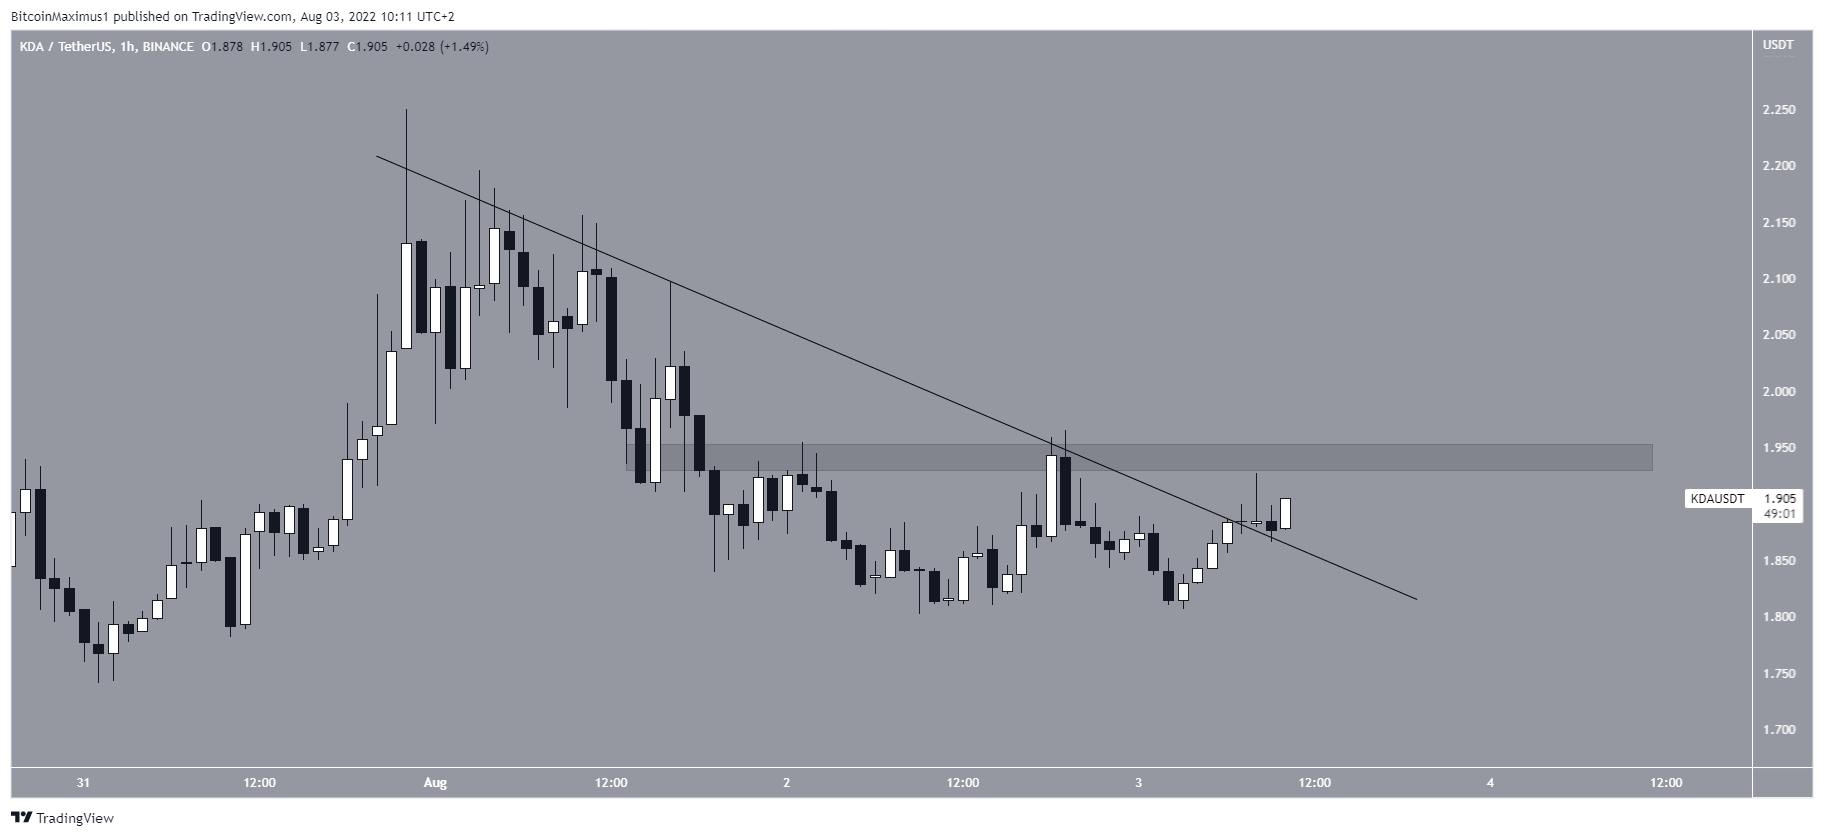
Finally, the two-hour chart aligns with the readings from the daily time frame. It shows that the price has broken out from a descending resistance line and is approaching the minor $1.95 resistance area.
A breakout from this level would likely take it towards the outlined resistance at $2.75.
KDA/BTC
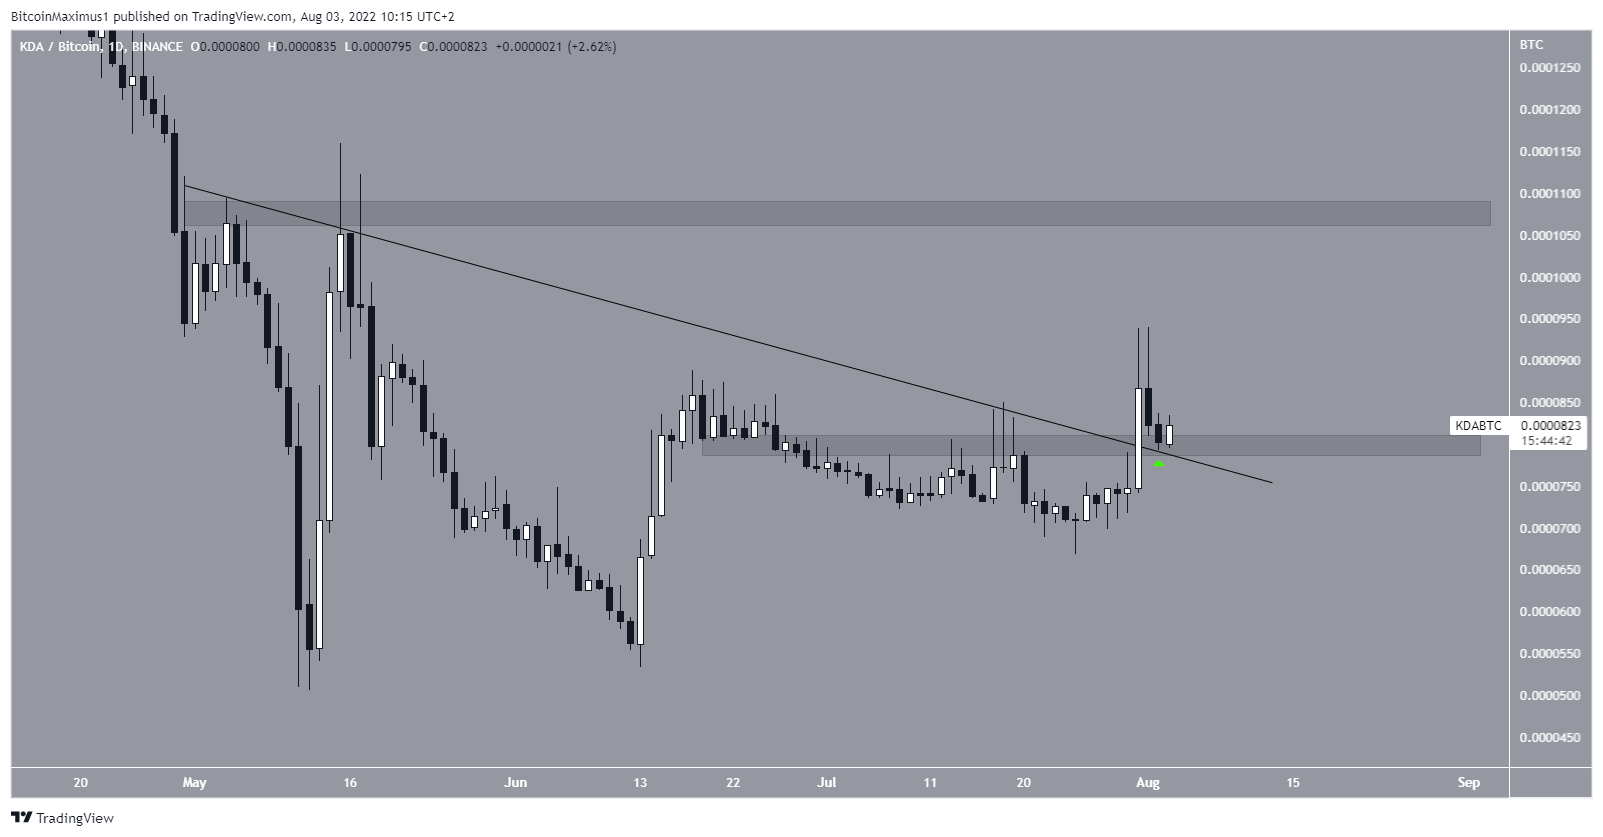
Similar to its USD counterpart, the KDA/BTC chart is bullish. On July 31, the price broke out from a descending resistance line and is currently in the process of validating it as support (green icon). The re-test also coincides with the validation of the 800 satoshi support area. Previously, the line had been in place since April 30.
Since the line has been in place for three months, it is possible that a considerable upward movement will follow. So, if the retest is successful, it would be expected to initiate an upward movement towards the closest resistance at 1,050 satoshis.
For Be[in]Crypto’s latest Bitcoin (BTC) analysis, click here


