Let’s take a close look at price movement and decide whether this bounce will actually occur.Weekly RSI down to the trendline predicted months back. Time for the Xmas bounce…. pic.twitter.com/CCfer4DAjh
— dave the wave🌊🌓 (@davthewave) December 25, 2019
Monthly RSI
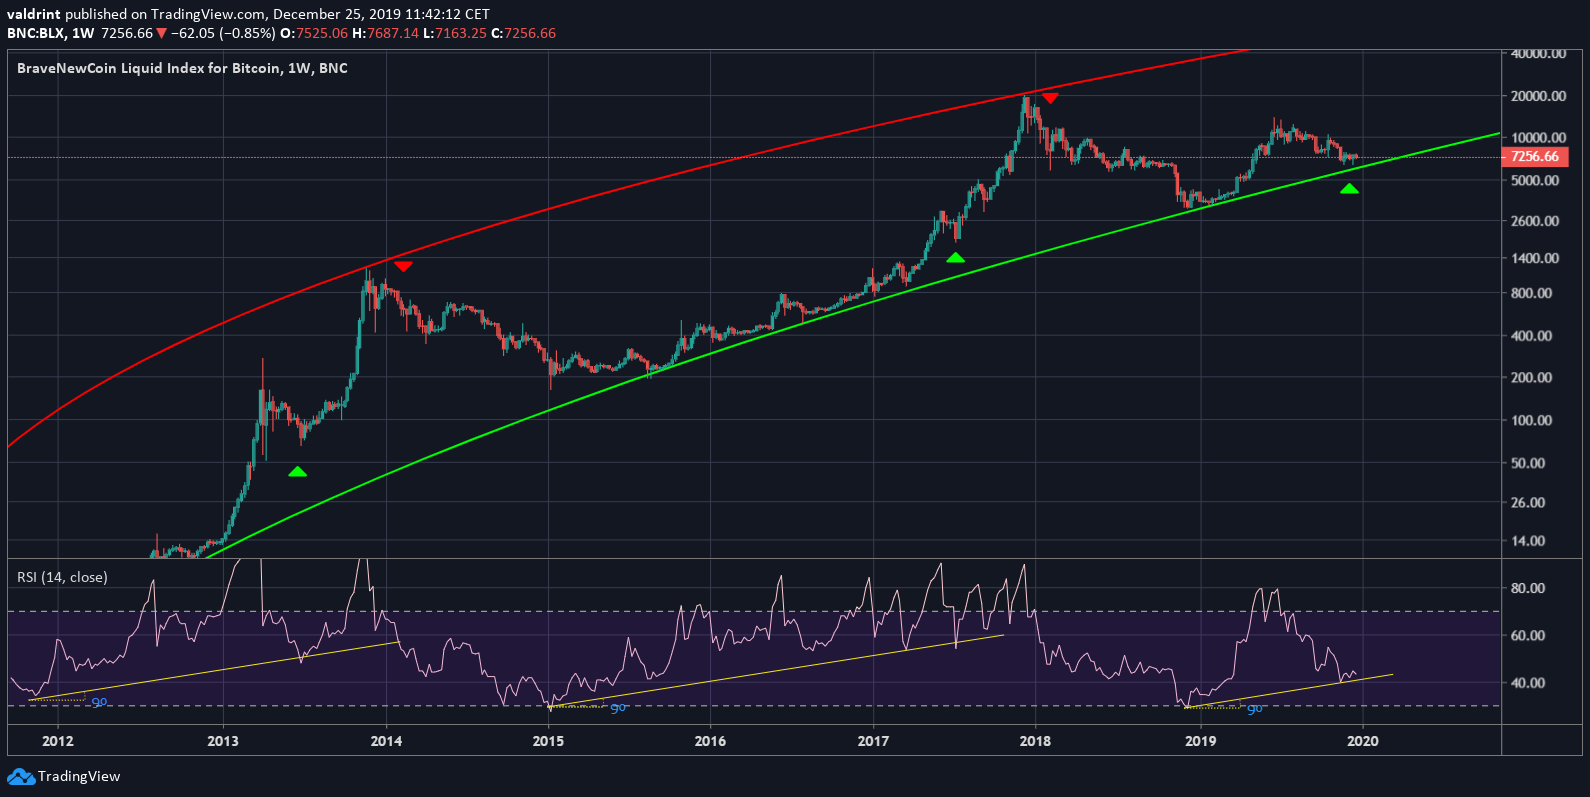
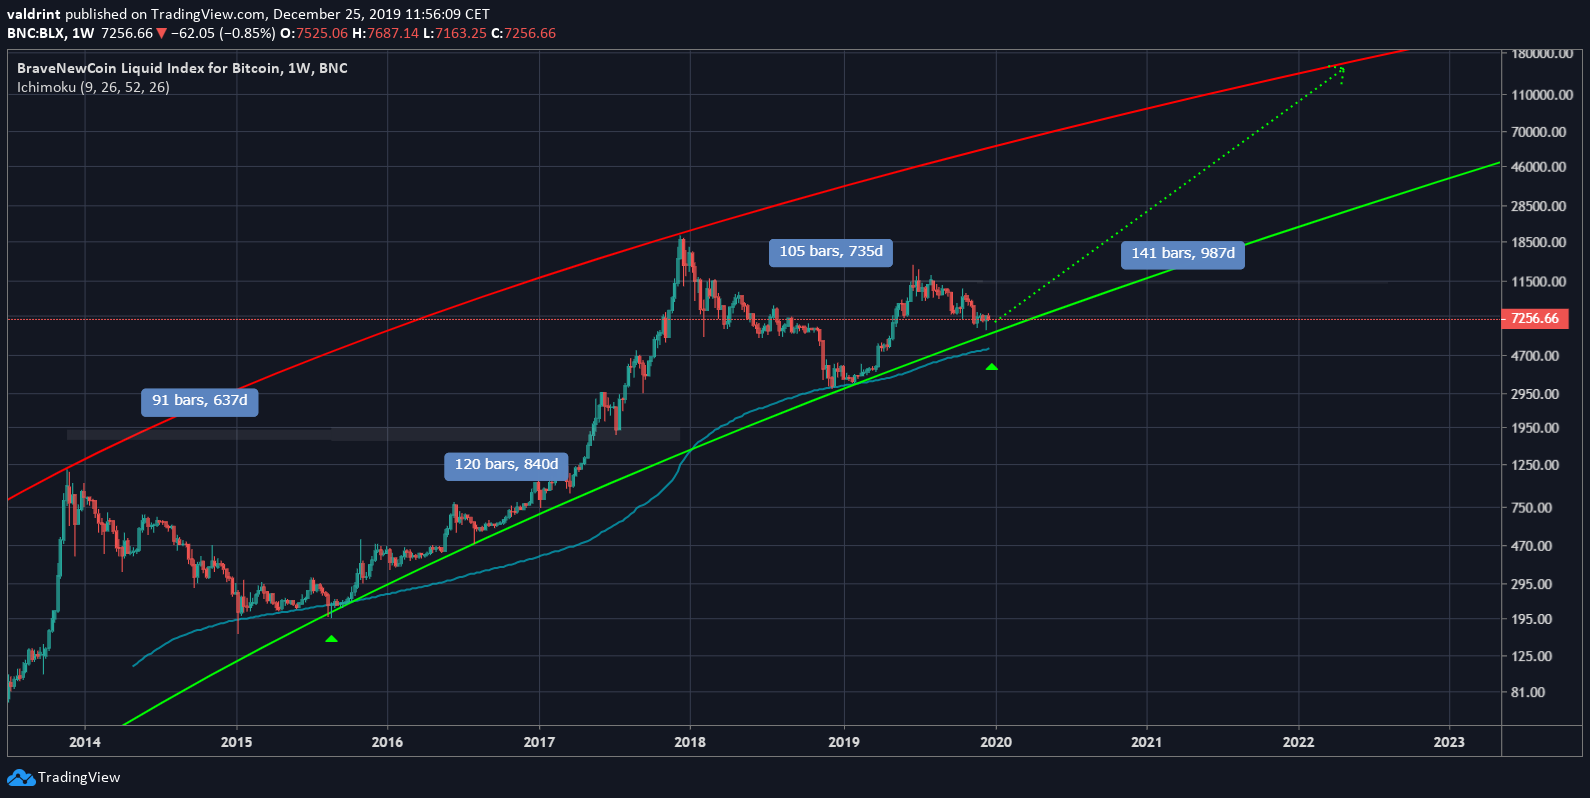
In the logarithmic chart, we can use curved trend-lines to limit the scope of price movement. The Bitcoin price is currently very losing to the support line. Also, the weekly RSI has created an interesting pattern. If we draw a 9° angle trend-line, the bounces on this trend-line indicate the times when the rate of increase accelerates, while an RSI movement below it suggests that the upward move is over and a corrective period has begun. Currently, the RSI is very close to bouncing on this line. Additionally, the Bitcoin price has almost reached the long-term support line, the first time these two events are coinciding with each other. This movement is also supported by the 200-week moving average (MA). In August 2015, the Bitcoin price bounced at the 200-week MA and the ascending support line, beginning an 840-day upward trend. This succeeded a bounce at the MA but not the support line in January 2015.
In December 2019, the price again bounced on the MA. Currently, it is decreasing — being very close to the confluence of the MA and the support line.
If we keep the same ratio between downward and upward moves, we expect the Bitcoin price to continue to increase within this channel and reach a high around $150,000 in mid-2022.

Short-Term Rate Of Increase
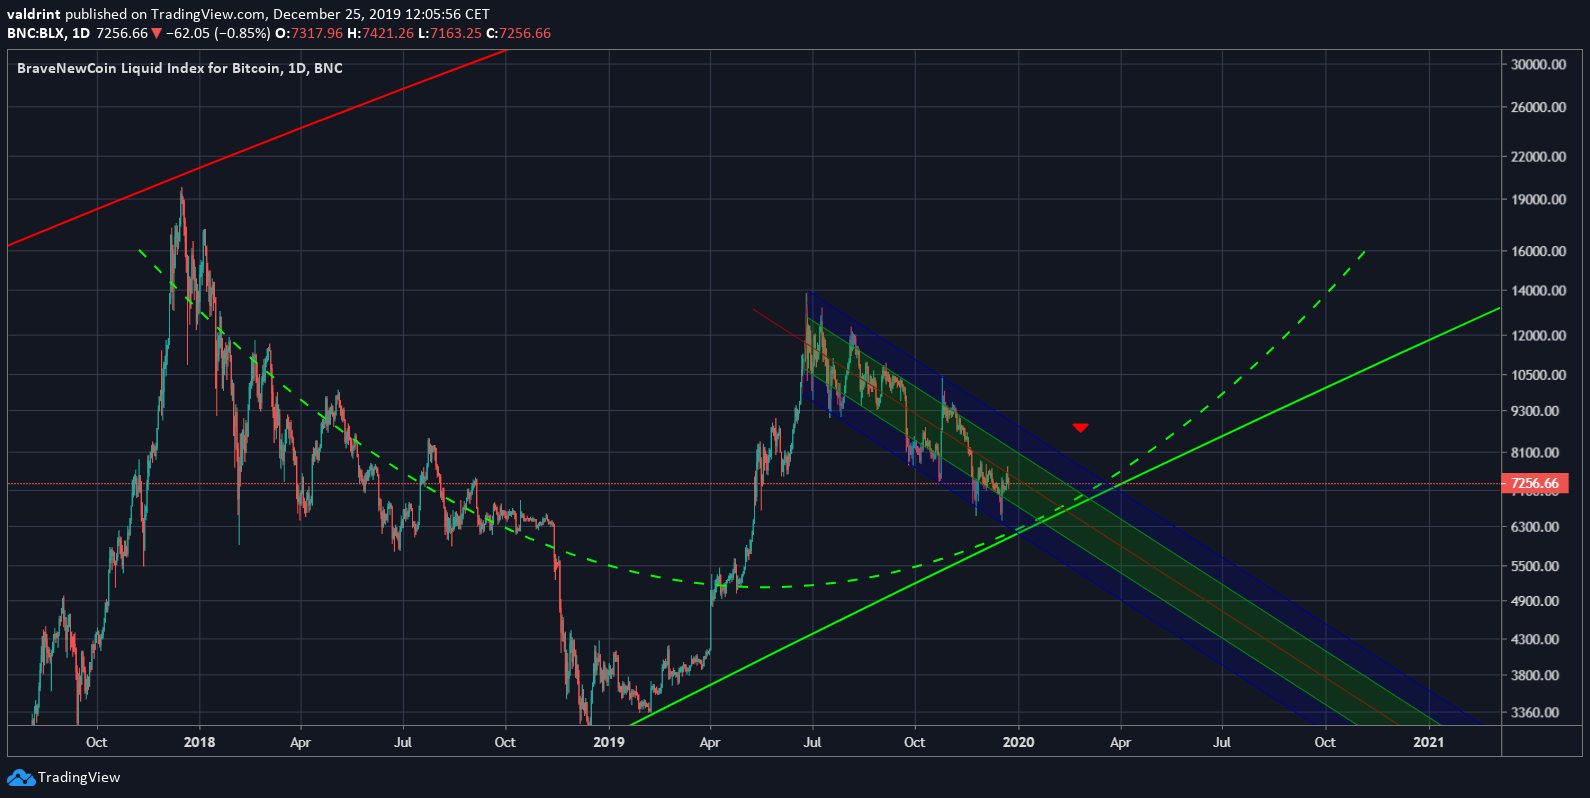
@davthewave also supports his hypothesis with the shorter-term daily chart, outlining the price movement since 2017.He has drawn a curved trend-line that measures the average rate of increase/decrease since the price reached nearly $20,000 in December 2017. Additionally, there is a descending channel in place since the June 24, 2019 high. The rate of increase and long-term trend-lines are coinciding with each other. The price could break out from the descending channel in February/March 2020 and make an attempt at moving above $14,000.Price continuing to track sideways in the horizontal channel mapped out a while back.
— dave the wave🌊🌓 (@davthewave) December 25, 2019
If the medium term trend is to come into alignment with the long term trend [growth curve] as predicted, then price should observe the mean line [heavy green dotted line] as it meets the curve pic.twitter.com/VfqgknGXQY

‘Christmas Bounce’
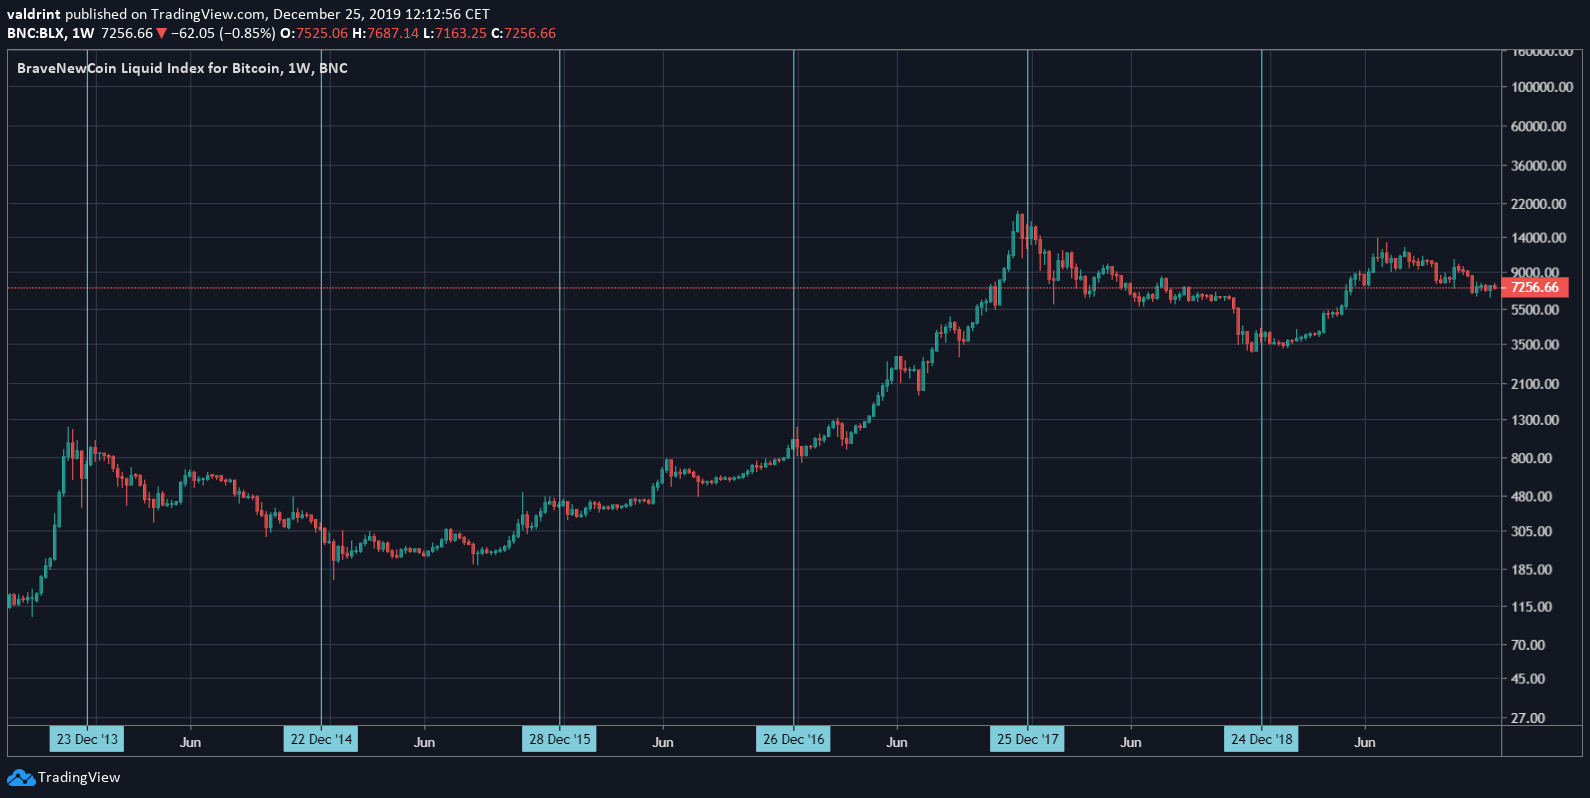
While the term “Christmas Bounce” is used in the original tweet, and there is a logical argument to be made for a price increase in the holidays — that has not been the case. The Bitcoin price has rarely reacted to Christmas time and its rate of increase/decrease since 2013 for the week of December 25 been :- 2013: +20 percent
- 2014: -1 percent
- 2015: +2 percent
- 2016: +14 percent
- 2017: -1 percent
 To conclude, the Bitcoin price has likely reached a long-term bottom and will soon begin a new market cycle. While the rate of increase is expected to initially be gradual, it will eventually accelerate towards the middle of 2020.
Disclaimer
In line with the Trust Project guidelines, this price analysis article is for informational purposes only and should not be considered financial or investment advice. BeInCrypto is committed to accurate, unbiased reporting, but market conditions are subject to change without notice. Always conduct your own research and consult with a professional before making any financial decisions. Please note that our Terms and Conditions, Privacy Policy, and Disclaimers have been updated.

![Is There Really a ‘Bitcoin Bounce’ on Christmas? [Premium Analysis]](https://beincrypto.com/wp-content/uploads/2018/12/christmas_bitcoin.jpeg.optimal.jpeg)