


The Total Cryptocurrency Market Cap (TOTALCAP) is in the process of re-testing a resistance area it has broken out from.
If the area holds, the TOTALCAP should continue moving upwards. The Altcoin Market Cap (ALTCAP) has a very similar price action.
Totalcap
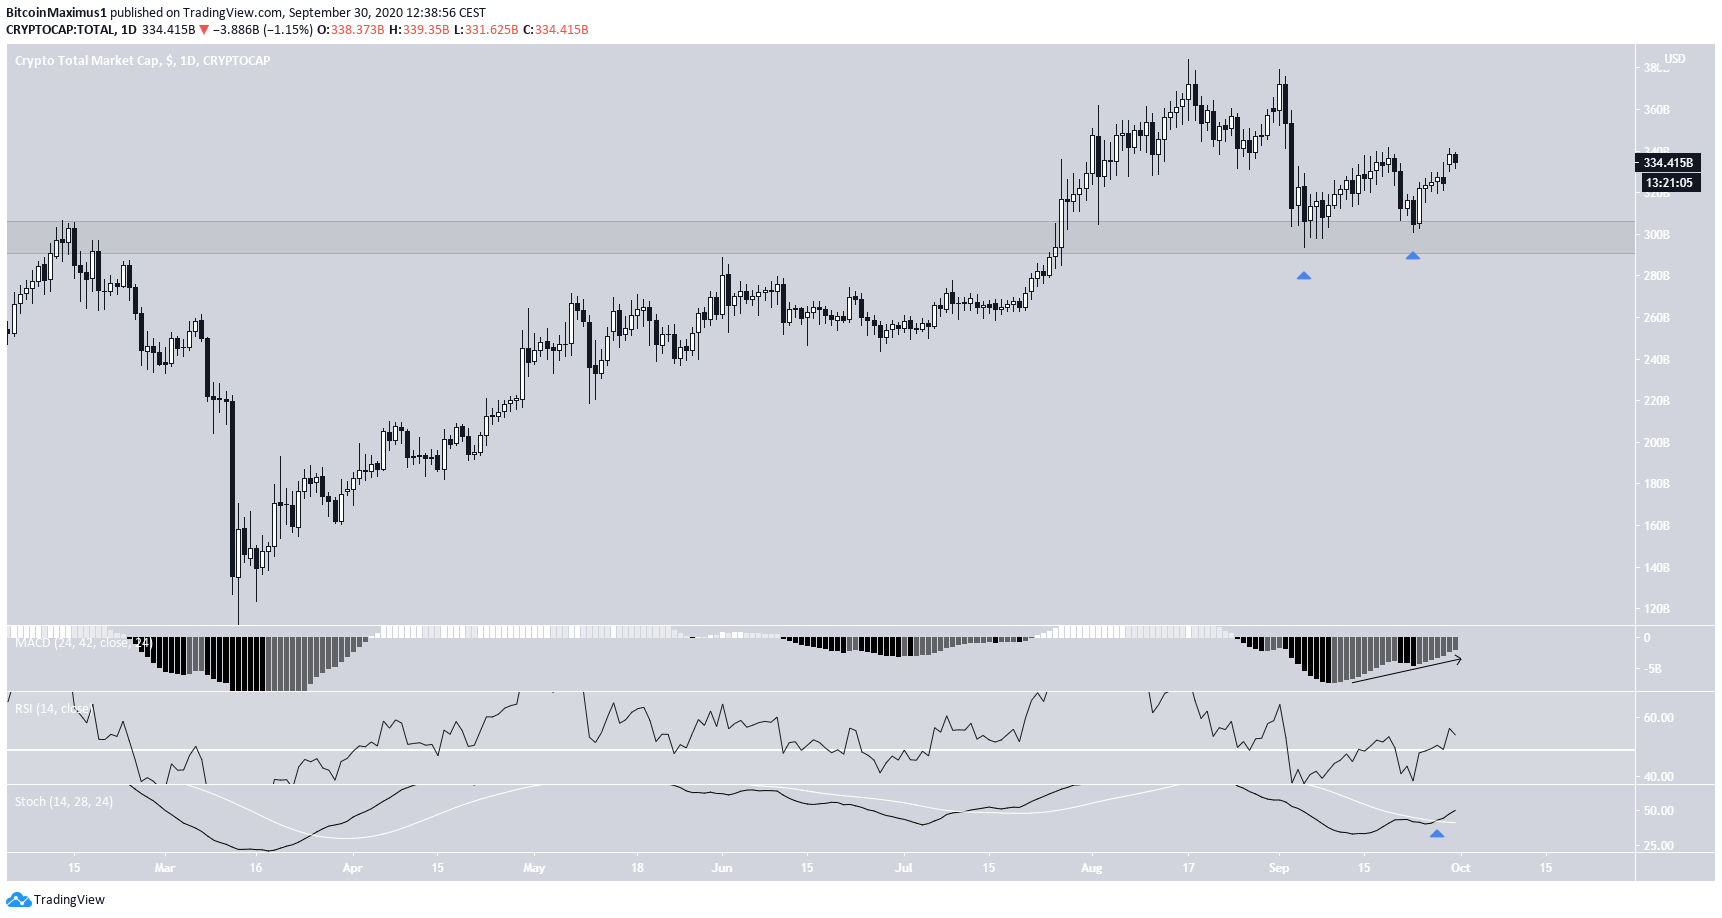
TOTALCAP has been increasing since reaching a bottom on March 13. The upward move continued until it reached a high of $383 billion on Aug 17. The cap has been falling since, dropping to the support area at ~$300 billion.
Inside this support area, a double bottom has been created, which is a bullish reversal pattern. Furthermore, all three indicators (MACD, RSI, and Stochastic Oscillator) are increasing, the latter having made a bullish cross.
All these suggest that an upward move is likely to follow, unless the support area breaks down.
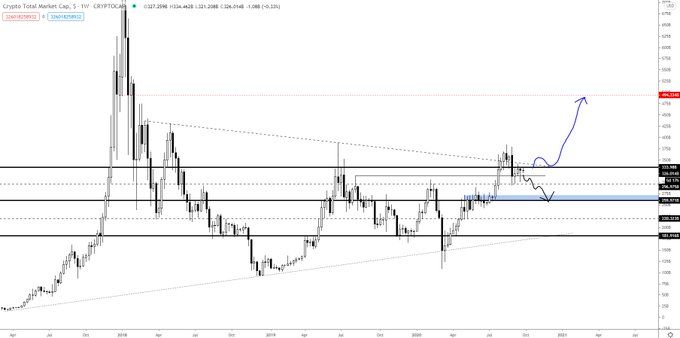
Cryptocurrency trader @TheEuroSniper stated that the total cryptocurrency market cap is at a decision point since it has fallen below the previous range low. A reclaim of the range would indicate that the cap is going to rally.
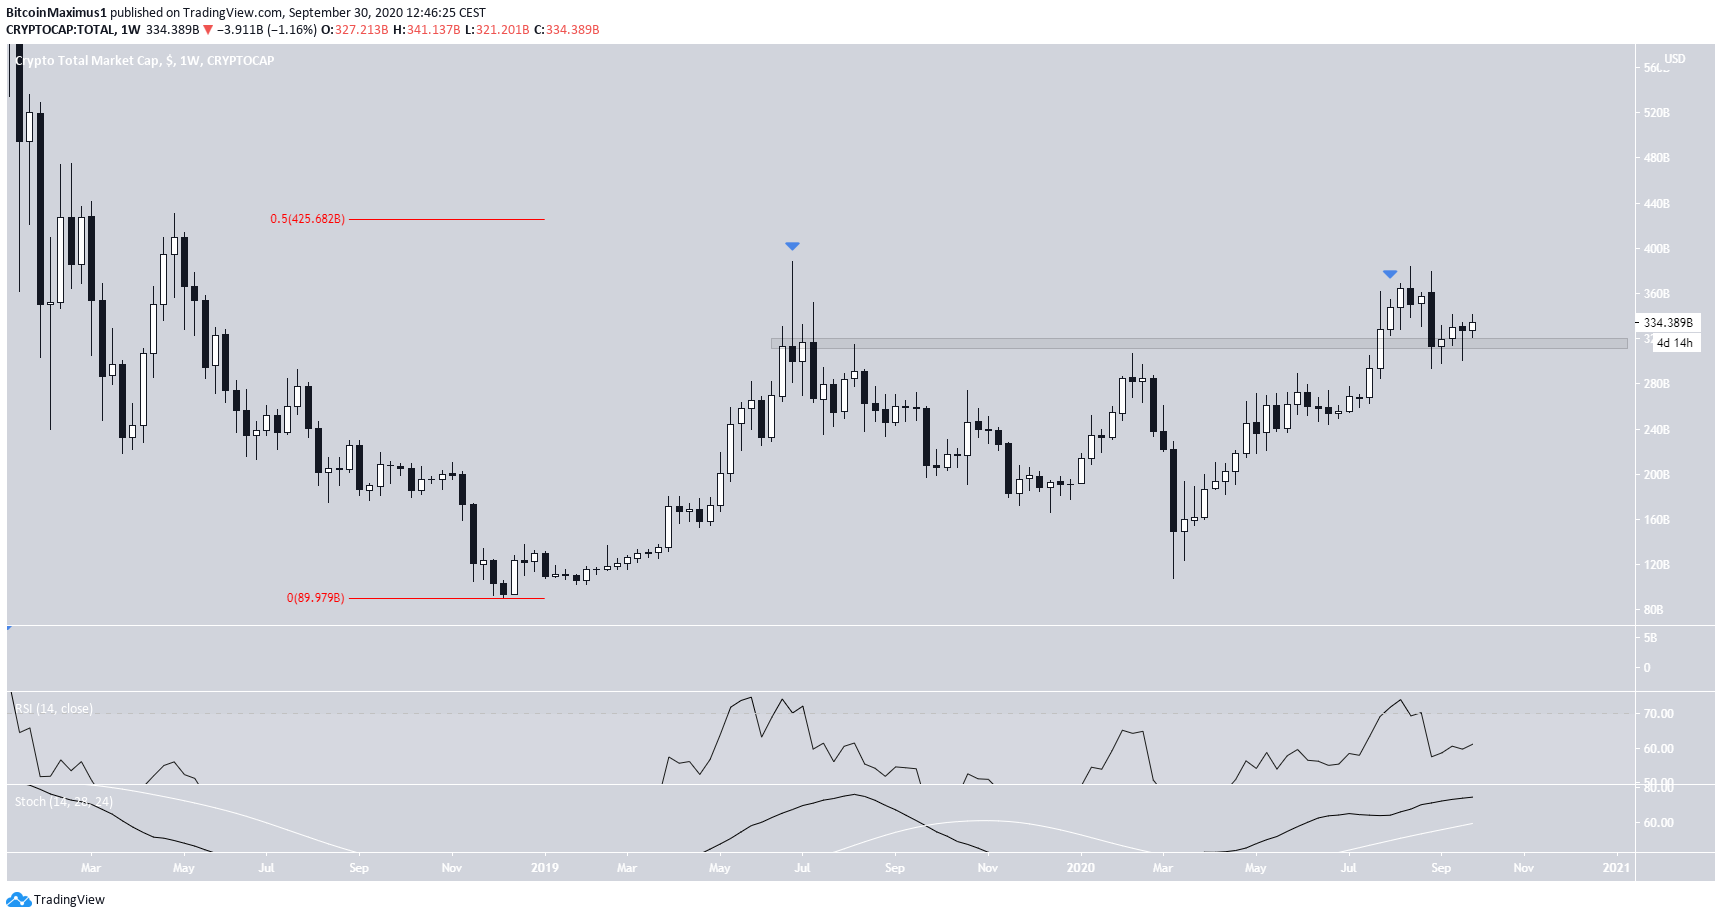
However, a look at the weekly time-frame reveals that TOTALCAP has not actually fallen below the top of the range. If closing prices are used, the current decline is a re-test of the previous resistance area, common before the price moves higher.
In addition, several weekly closes in July/Aug 2020 were higher than those in July 2019, when a long upper wick was created, followed by a decline. Technical indicators do not yet show any weakness.
If TOTALCAP continues increasing, the next resistance area would be found at $425 billion, the 0.5 Fib level of the entire previous fall.
Altcoin Market Cap
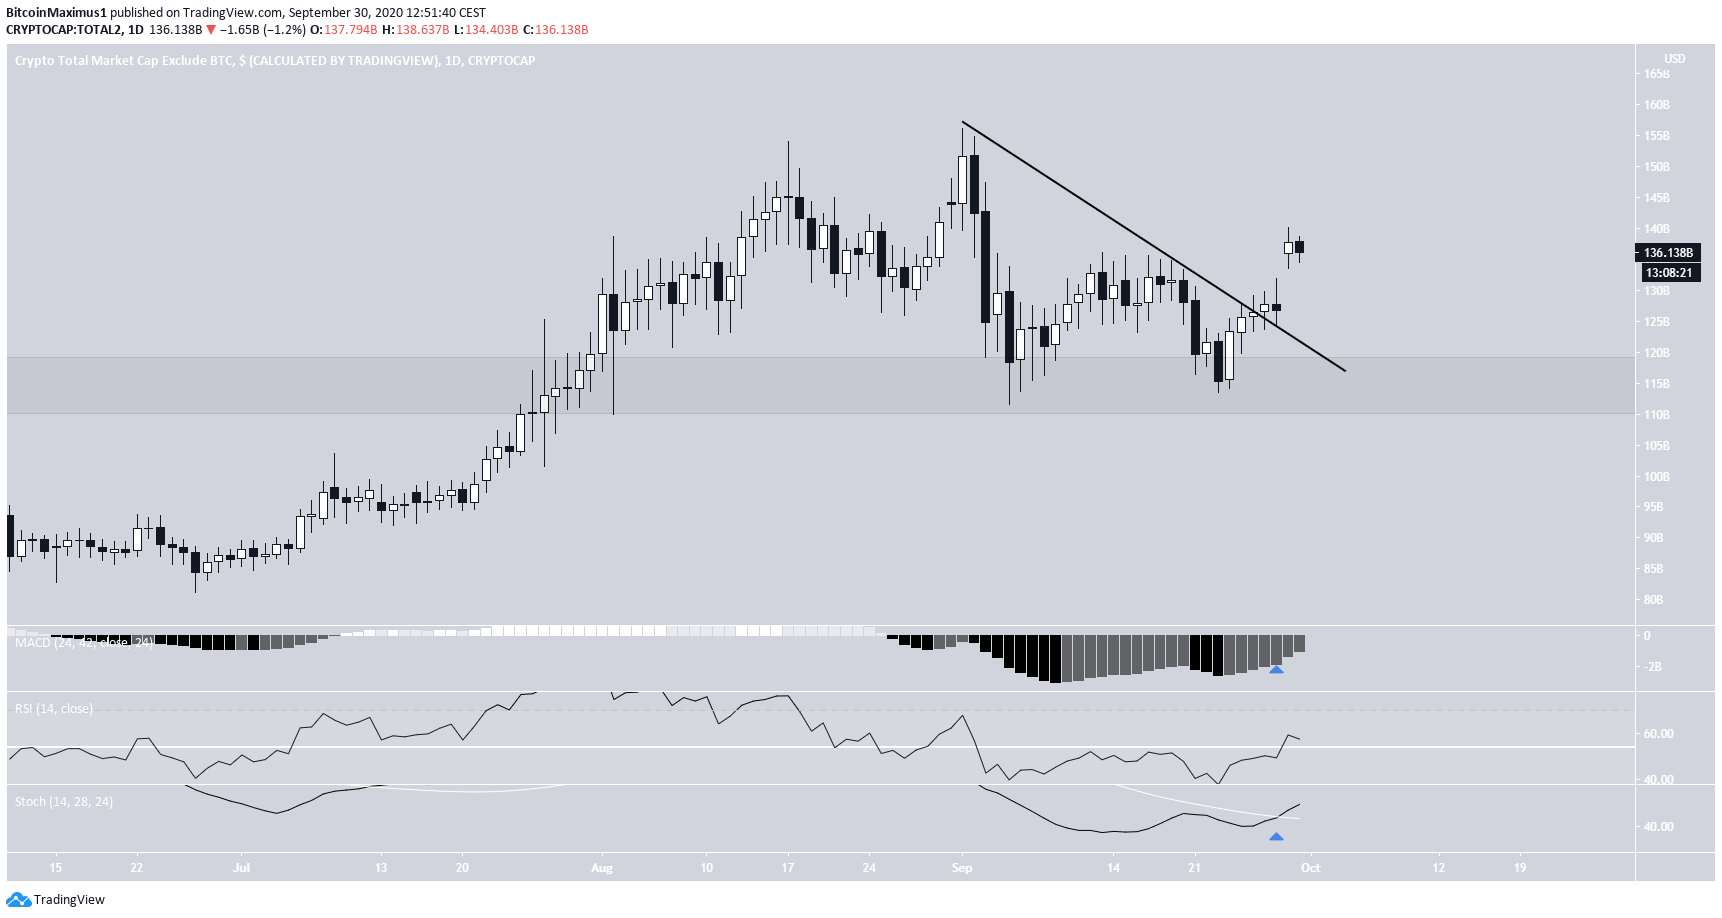
The Altcoin Market Cap (ALTCAP) has a similar price action relative to the TOTALCAP but is slightly more bullish.
ALTCAP has already broken out from a descending resistance line and is moving higher. Technical indicators are almost identical, with all three indicators (MACD, RSI, and Stochastic Oscillator) increasing, the latter having made a bullish cross and the RSI being above 50.
Therefore, we would expect ALTCAP to continue moving upwards.
For BeInCrypto’s Bitcoin analysis, click here!


