Both the NEO/BTC and NEO/USD pairs have been declining since they reached their respective long-term descending resistance lines at the beginning of June.
The short-term chart looks slightly more bullish for NEO/BTC than it does for NEO/USD.
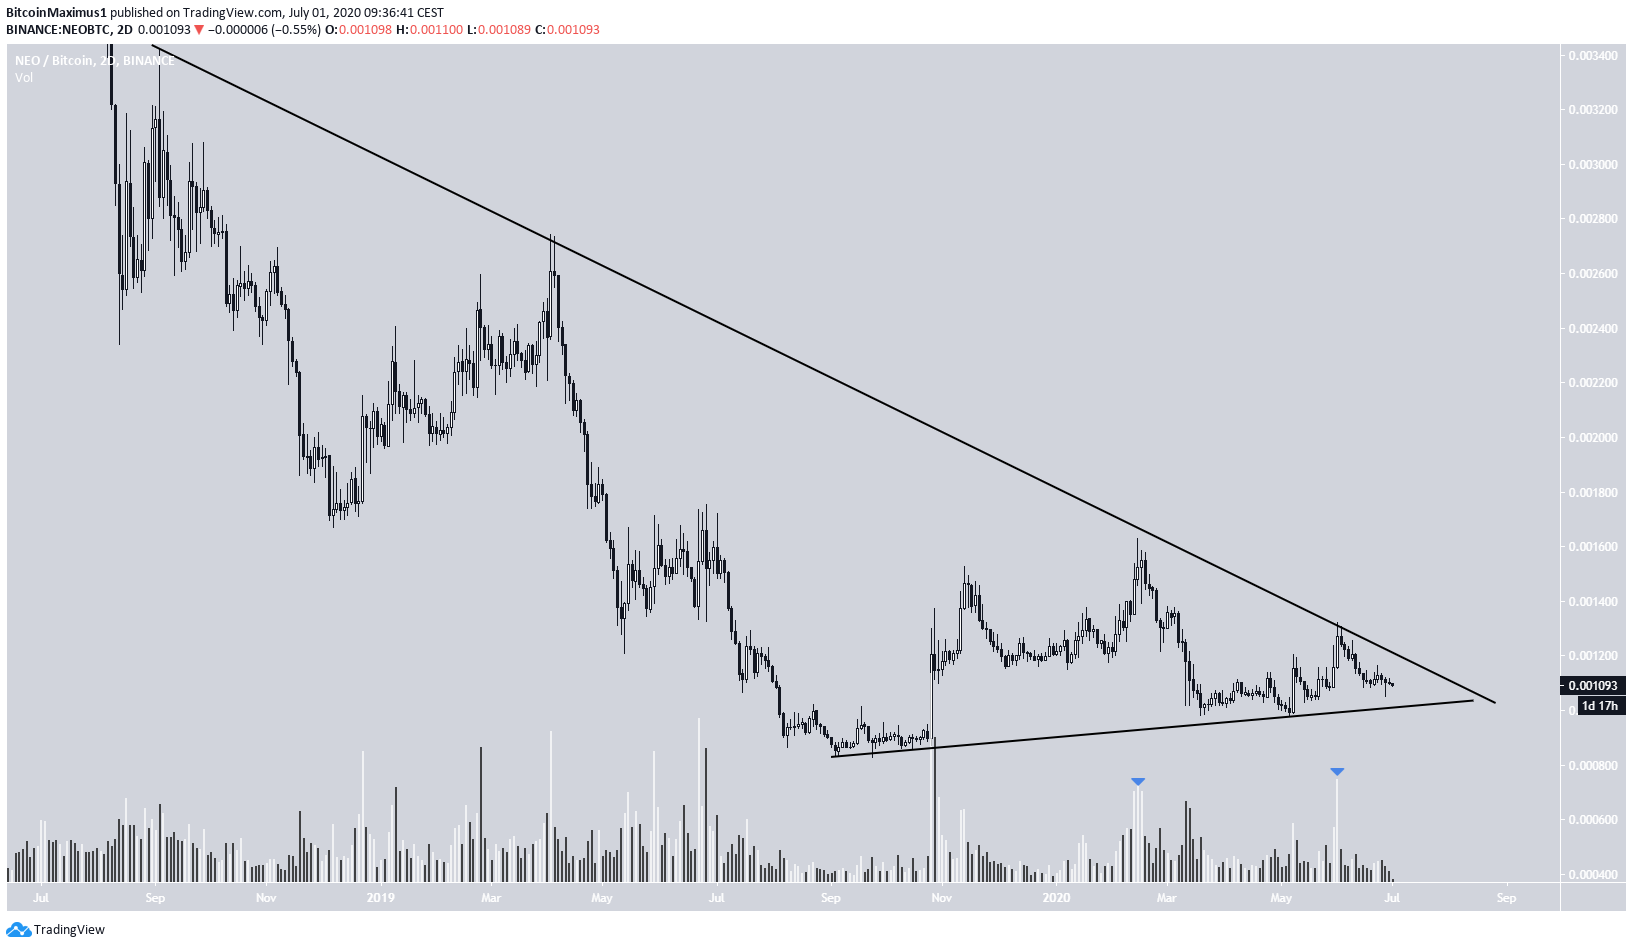
NEO/Bitcoin
The NEO price has been following a descending resistance line since September 2018. The price has been declining since it last touched this line on July 2. A breakout above would likely initiate a significant long-term upward trend.
It is possible that it’s also following a shorter-term rising support line, whose slope is not entirely clear. These two lines combine to create a symmetrical triangle, which is considered a neutral pattern.
The volume throughout this pattern has been higher on bullish candlesticks, culminating in a bullish engulfing candlestick on May 24.
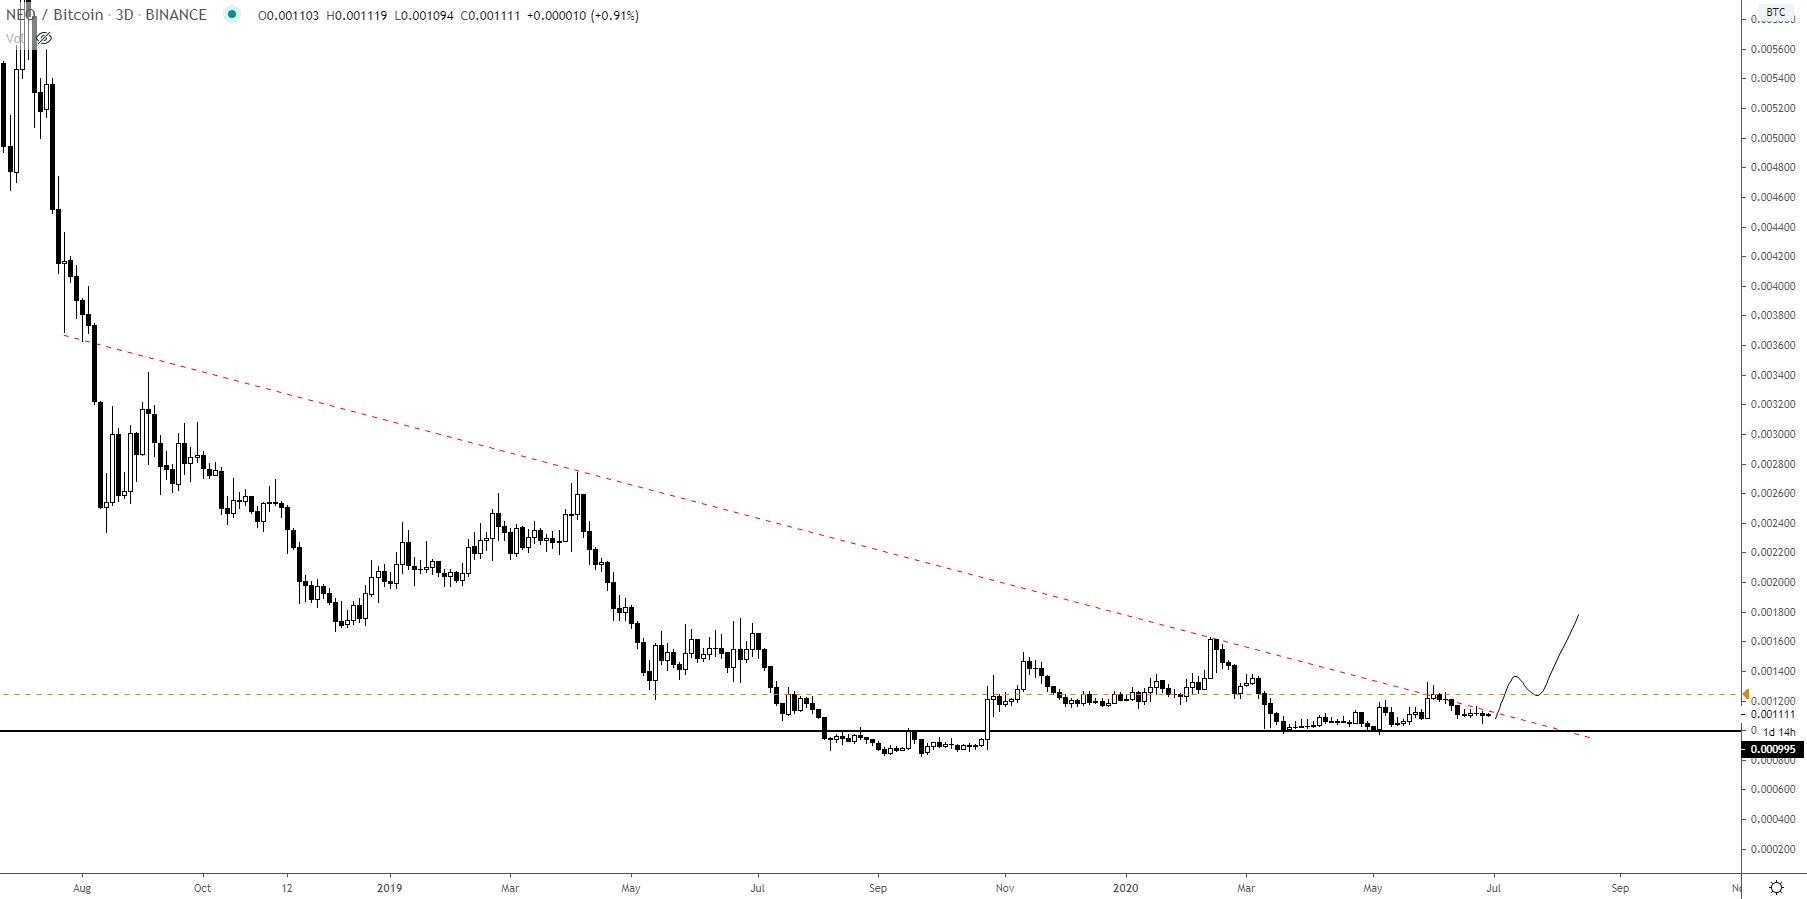
Cryptocurrency trader @Theeurosniper explains that NEO could soon break out above this same long-term descending resistance line:
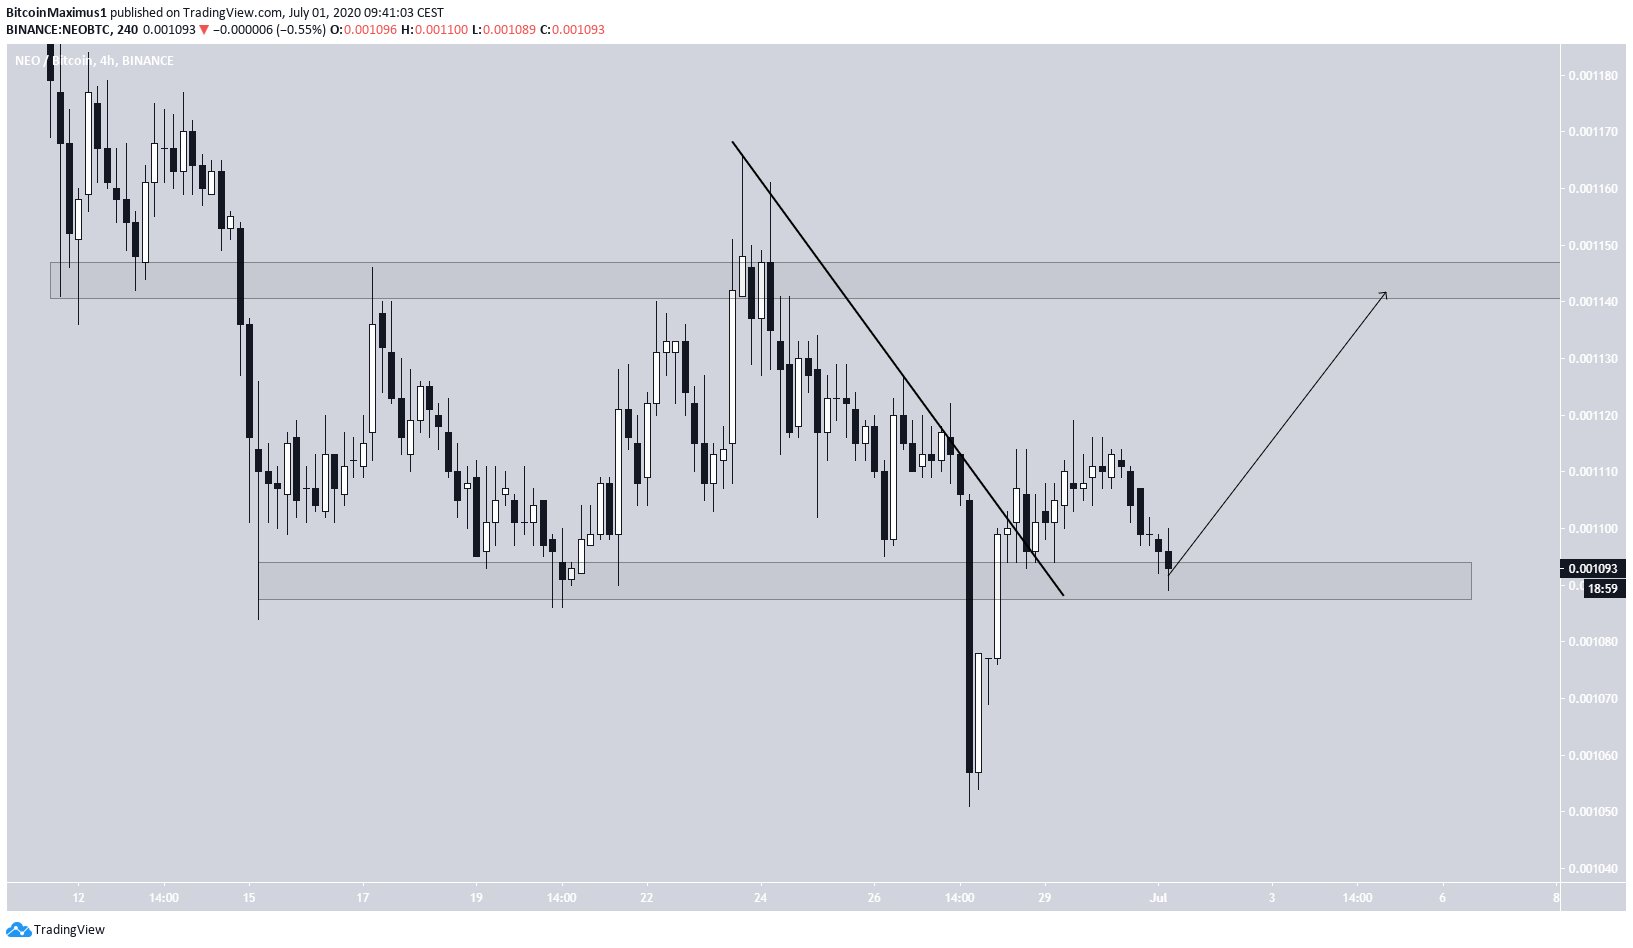
The short-term chart shows that the price initially broke down from the minor ฿0.00109 support area, but reclaimed it shortly thereafter. It also broke out from a descending resistance line.
This is a bullish sign that suggests the price will move towards the closest resistance area at ฿0.00145.
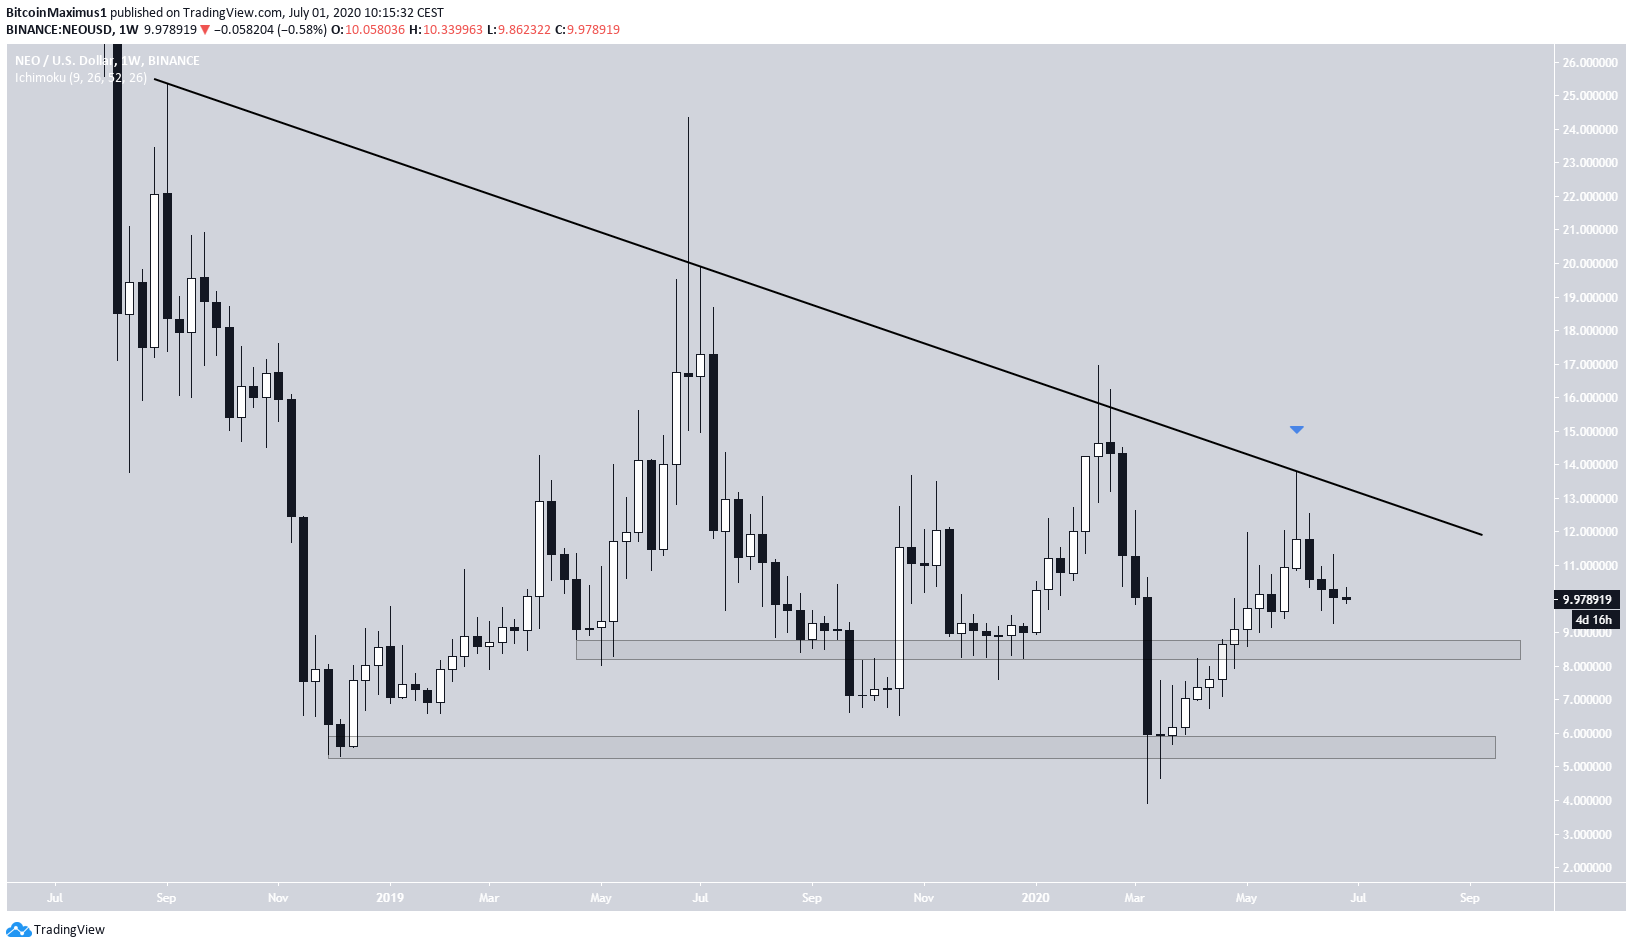
NEO/Dollar
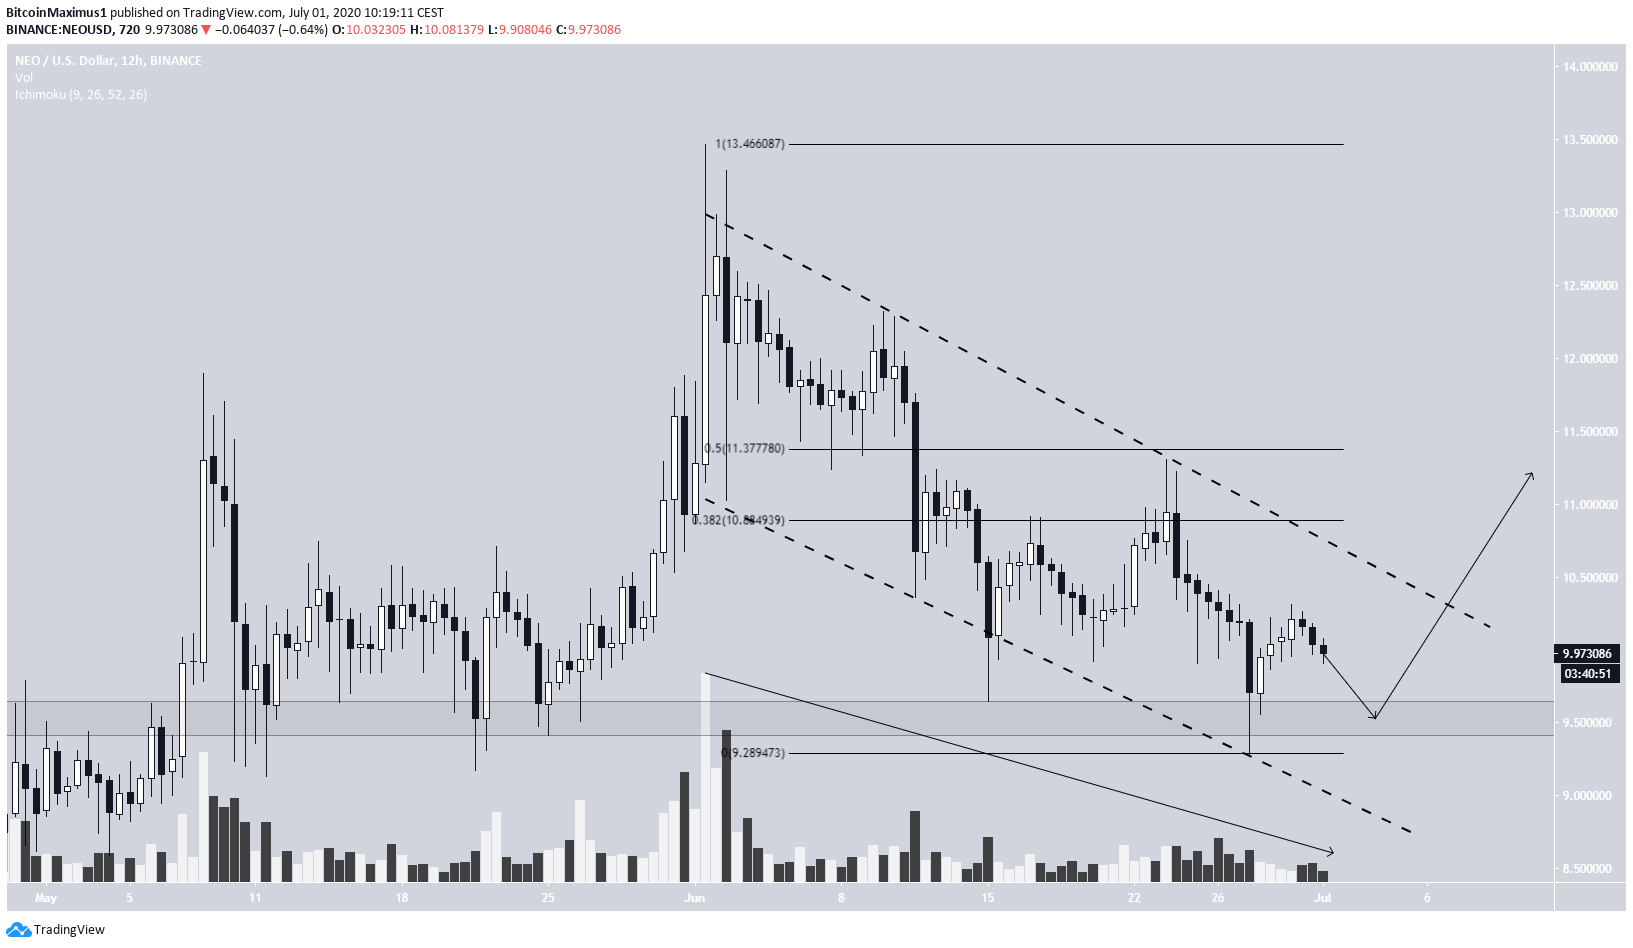
The NEO/USD pair is also following a long-term descending resistance line. It has been decreasing since it last reached this line on July 1 when it created a shooting star candlestick. If the price continues declining, the closest support levels are found at $8.5 and $5.5, respectively.
In the short-term, we can see that NEO has been trading inside a descending channel since it reached the high on June 1.
The price bounced on the support line of this channel on June 24, along with the minor $9.5 support area, and has been increasing since. If it continues to rally and then break out, it should move towards the $10.8 – $11.3 area, the 0.5 – 0.618 Fib levels of the entire downward move.
However, until the price breaks out from the previously outlined long-term descending resistance line, the price movement should not be considered bullish.