Ethereum is reaching the end of a symmetrical triangle, the breakout/down from which will likely determine the direction of the future trend.
A symmetrical triangle was outlined by cryptocurrency news account @Cryptobuzznews, which tweeted an Ethereum chart that shows the price trading inside a symmetrical triangle, nearing its projected end.
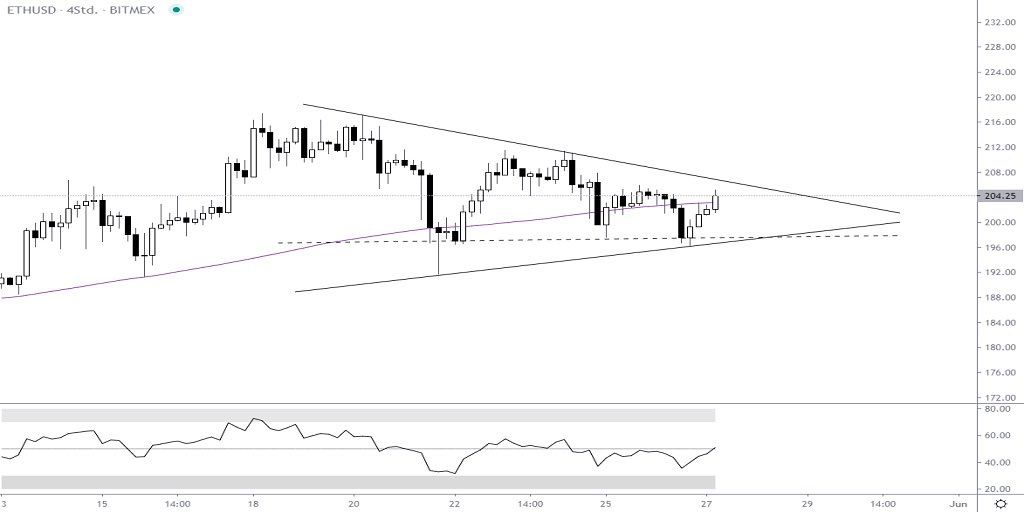
The triangle is occurring at the end of a long-term ascending support line, one that has been in place since March 13. The projected end of the triangle is in the beginning of June, so a decisive move is likely to occur soon.
The closest resistance area is found at $220, an important area that has previously rejected the price twice. Therefore, in order to begin an upward move, a breakout above the triangle would not be sufficient. Rather, the price would also have to move above this resistance area.
While the RSI is still above the 50 line, there are no clear signs that the price will break out from this symmetrical triangle yet.
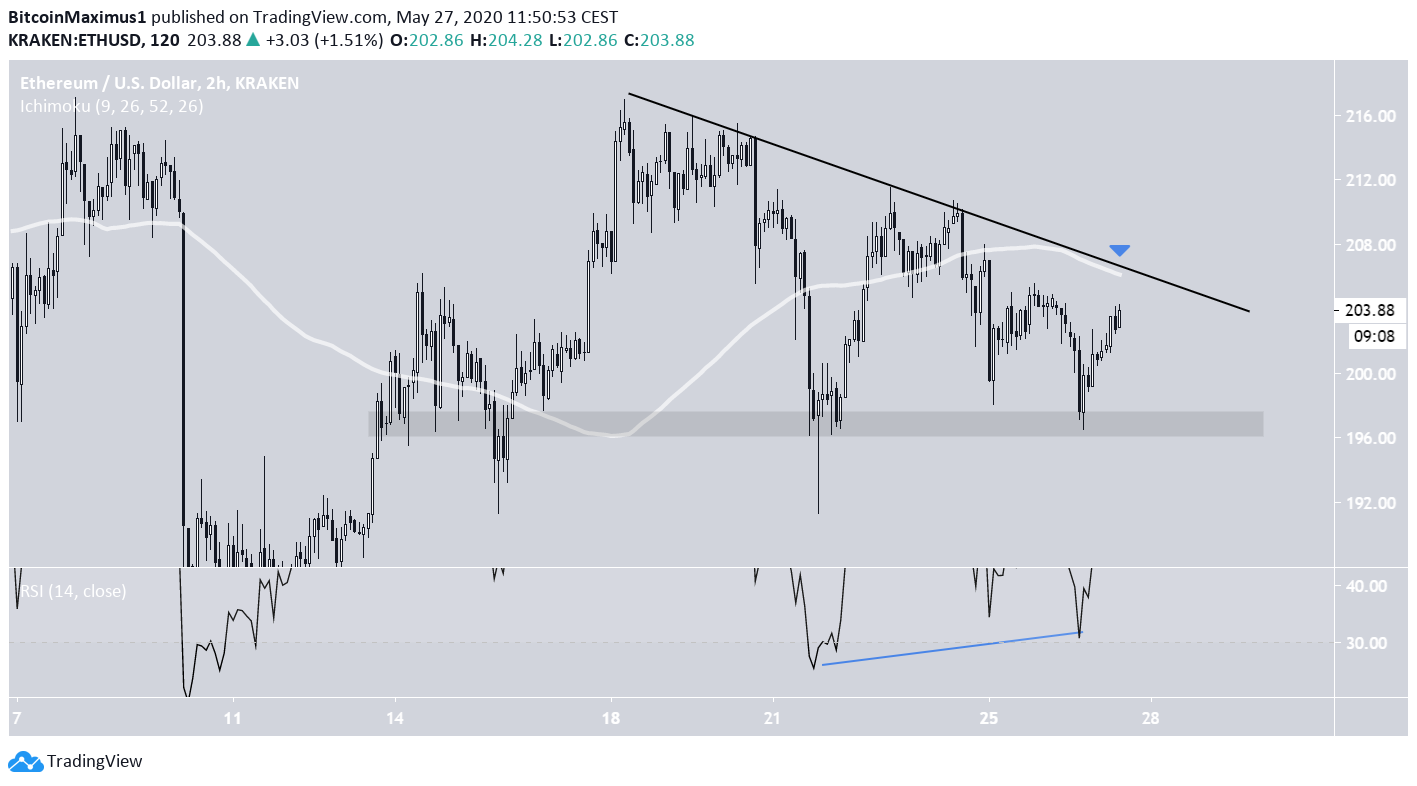
In the short-term, the ETH price is following a descending resistance line, and possibly trading inside a descending triangle, with support at $197. The price has created what resembles a double bottom along with some bullish divergence in the RSI.
However, there is significant resistance above the current price, in the form of both the resistance line and the 200-hour moving average (MA).
Therefore, it is still unclear whether Ethereum will increase or not. However, the short-term chart helps reduce the scope of the consolidation movement. A breakout above $207 would likely indicate that the price will move upwards, while a decrease below $197 would indicate a breakdown.
ETH/BTC
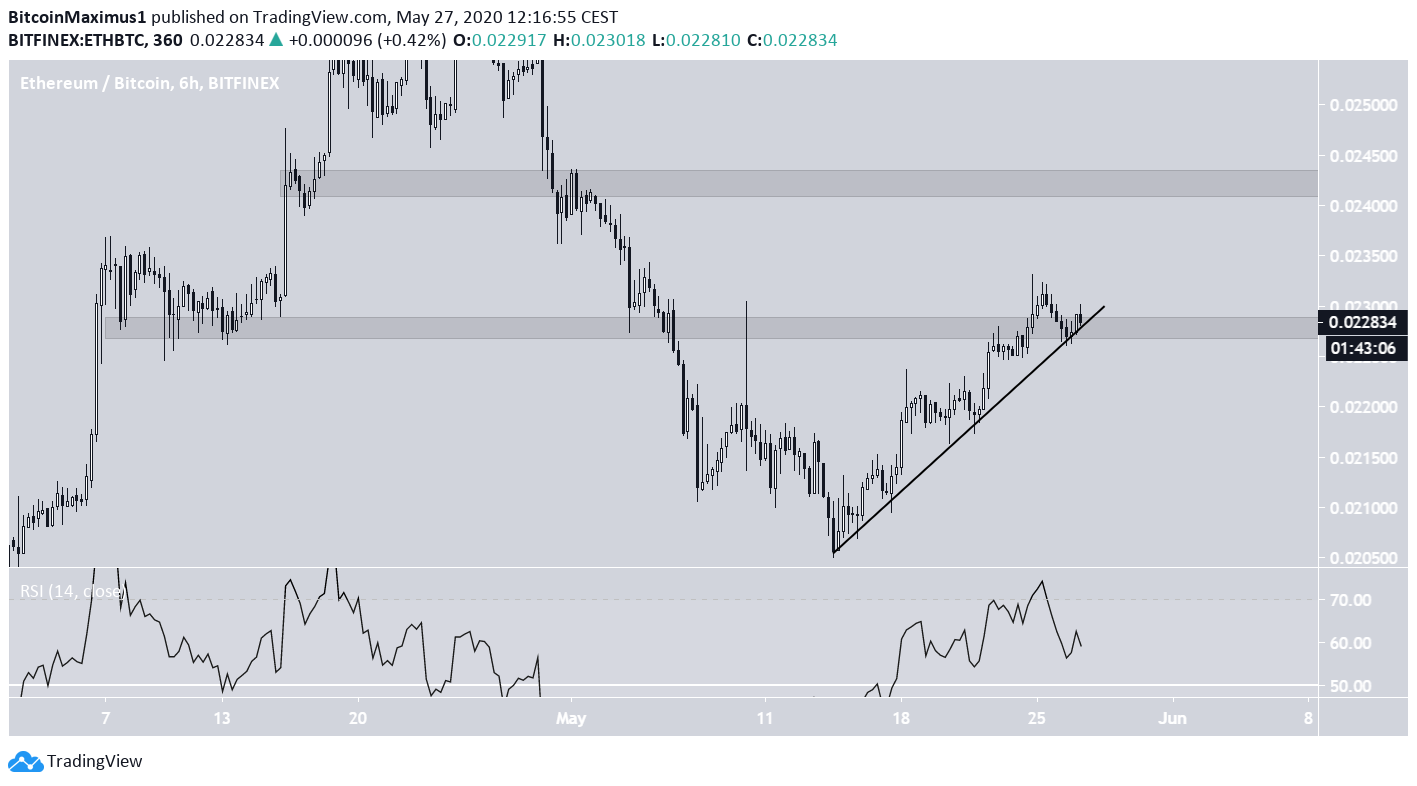
The ETH/BTC pair has a more straightforward picture. The price has been following an ascending support line since May 17. It has recently reclaimed an important resistance level at ₿0.025 and validated it as support afterwards.
Since there is no bearish divergence in the RSI to warn of a reversal, the price is expected to continue increasing until the next resistance level at ₿0.024.