
On Apr 29, the price of BTC reached highs of $5518 and €4941. A rapid drop ensued, which took it to lows of $5365 and €4811 the same day.
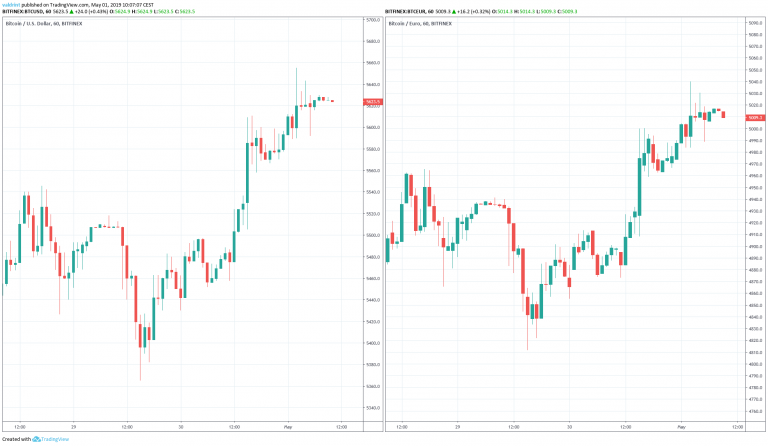
Since then, the price of BTC has been increasing.
Will Bitcoin continue rising and make new highs or is a reversal in store?
Let’s find out:
Bitcoin (BTC): Trends and Highlights For May 1, 2019
- Both BTC/USD and BTC/EUR reached a low on Apr 29.
- Bitcoin has been trading inside an ascending wedge.
- Bearish divergence is developing in the RSI and the MACD.
- There is support near $5500/€4930.
A Look at the Current Trading Pattern
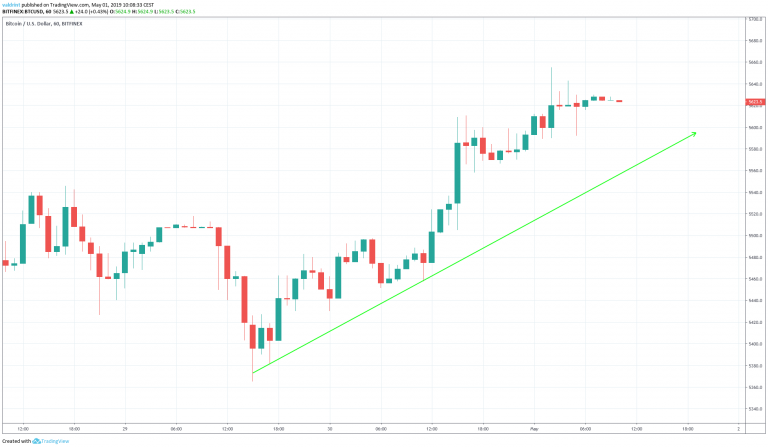
On Apr 29, the price made a low of $5365. A gradual increase was followed by a gradual decrease. The price has made several higher lows during this period.
Tracing these lows gives us an ascending support line:
On Apr 29, Bitcoin made a high of $5507.70 Several market cycles have been completed. The price has made successively higher highs in the process.
Tracing these highs gives us an ascending resistance line. The resistance and support lines combine to create an ascending wedge:
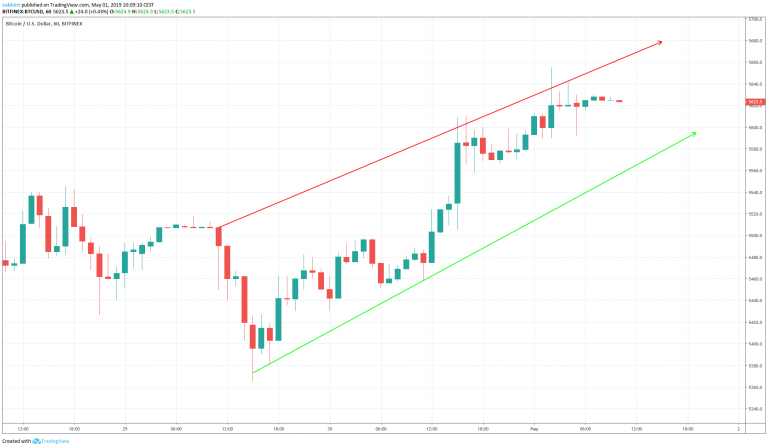
It is likely that the price will increase at the rate predicted by the wedge until a decisive move occurs.
In order to predict the direction of the movement, a look at technical indicators is required.
Technical Indicators
To better assess future price fluctuations, we analyze the price of Bitcoin alongside the RSI and the MACD.
Combining RSI bullish/bearish divergence with support/resistance essentially predicts price fluctuations. They are shown alongside Bitcoin’s current trading pattern below:
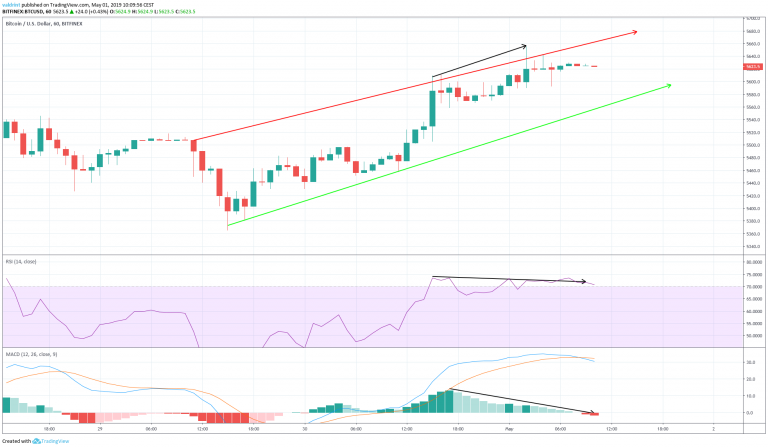
On Apr 30, the price made a high of $5609.3. It continued to increase and on May 1 made a high of $5655.
Similarly, the RSI and the MACD made the first high on Apr 30. However, they have proceeded to generate lower values. This is known as bearish divergence and often precedes price decreases.
Using these indicators, it is likely that the price will keep increasing at the rate predicted by the wedge until a breakdown occurs.
Reversal Areas
To better determine reversal levels and support areas inside the confines of the channel, we incorporate support areas into the analysis.
One support and is traced for BTC/USD and BTC/EUR below:
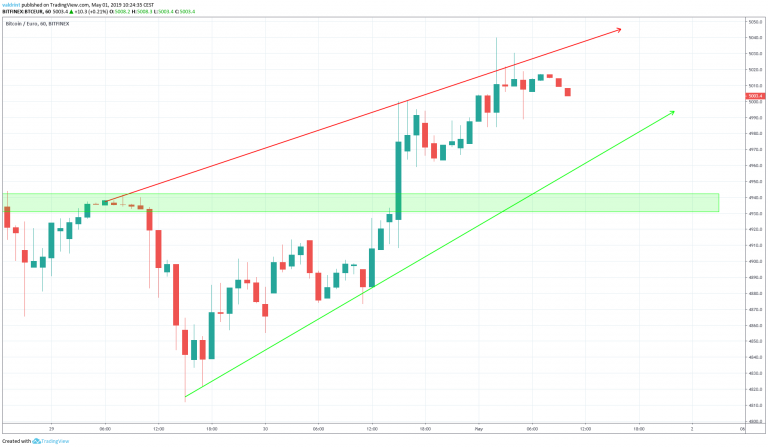
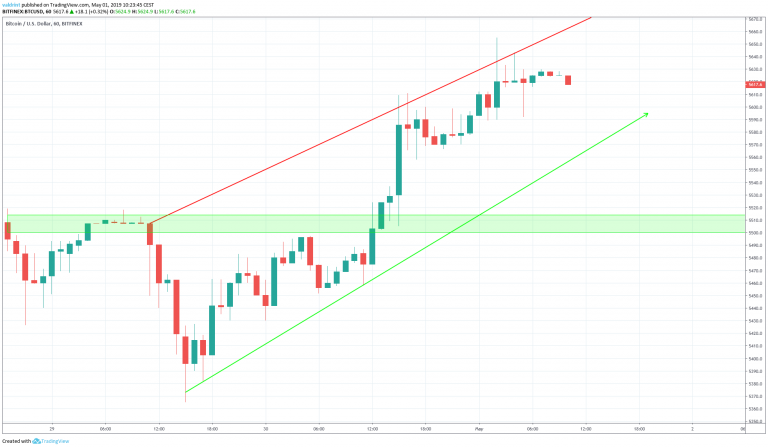
The closest support area is near $5500 and €4930. If the price breaks down from the wedge, it is likely to provide a reversal. We believe the price will eventually reach this area.
Conclusion and Summary
Bitcoin is currently trading within an ascending wedge. We believe it will break down from the wedge and reach the support area outlined above.
Despite short-term losses, however, we believe we believe Bitcoin is likely to make long-term gains.
To learn more, read out 2019, 2020, and 5-year price predictions, click here:
Do you think BTC will keep trading inside the channel? Let us know your thoughts in the comments below!
Disclaimer: This article is not trading advice and should not be construed as such. Always consult a trained financial professional before investing in cryptocurrencies, as the market is particularly volatile.
