
In a sequence of two tweets, professional trader and financial consultant @captainscio used the long-term view of Bitcoin in order to allude that this downtrend could go on for an extended period of time.
Captianscio correctly pointed out that Bitcoin is trading below the 200-day moving average (MA), which has been historically significant in identifying whether the price is in an uptrend or downtrend.
The full tweets are given below:
And the weekly. This could get really ugly and could go a lot longer than expected. A Double Dip Bear Market? pic.twitter.com/asdJZqIzuX
— Joe Moss: Modified Dow Theory Signals (@CaptainScio) September 30, 2019
Bitcoin’s 200-Day Moving Average
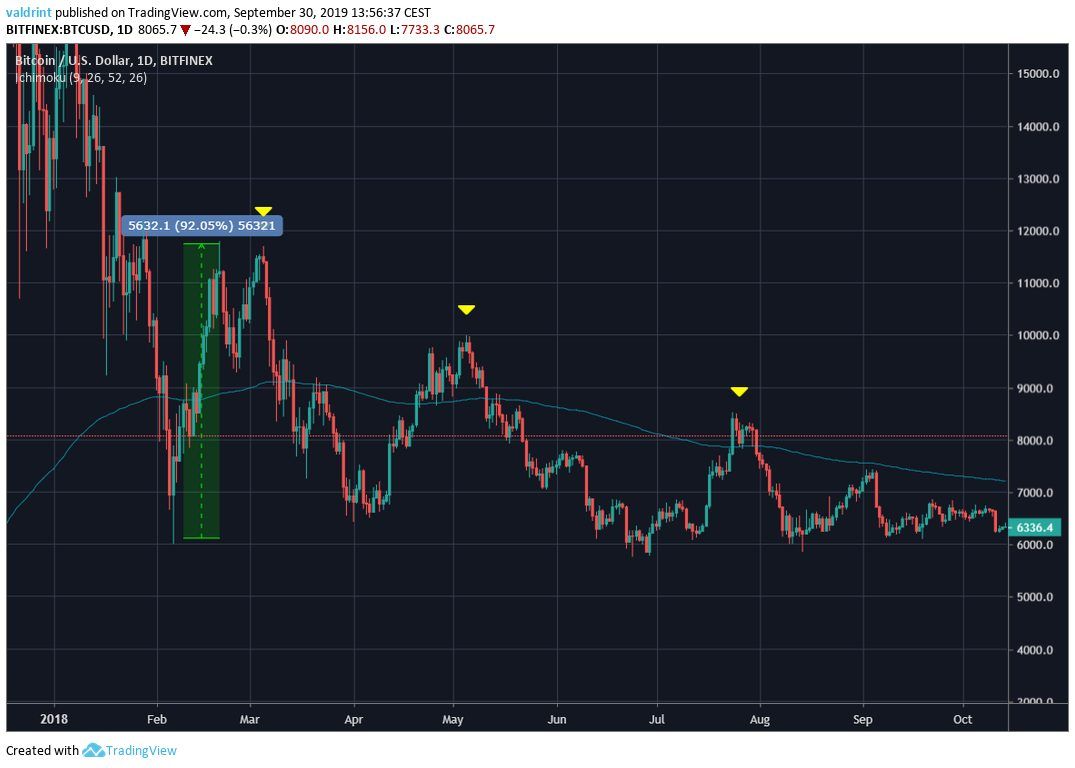
The first time Bitcoin dropped below the 200-day MA was on February 2, 2018, and it was the first sign of the downtrend that lasted until December 15 of the same year.
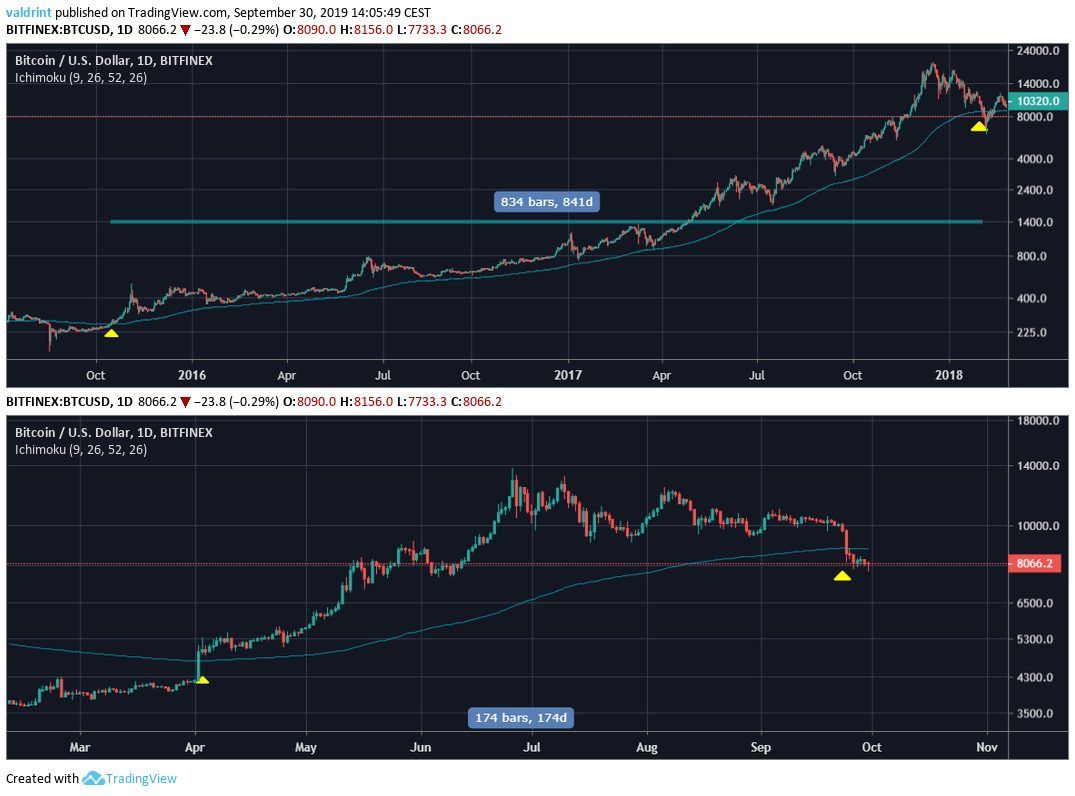
However, Bitcoin previously crossed above this same MA on October 14, 2015. Afterwards, it stayed above it until the aforementioned breakdown on February 2, 2018. This is a period of 841 days.
If we compare this to the current movement, the BTC price moved above its 200-day MA on April 2 before breaking down on September 24. This is only a period of 175 days.
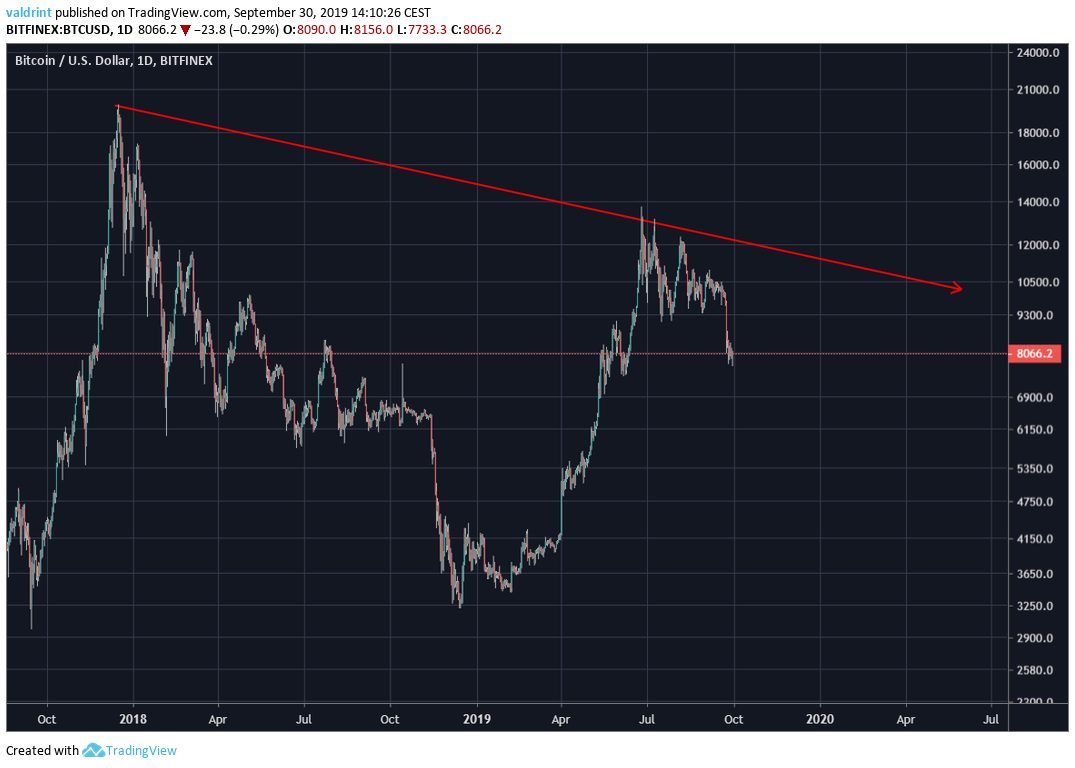
This could mean that the current bull run is not nearly as strong as the one that began in 2015 — and we might not see a new all-time high after all.
Weekly Moving Averages
However, even if we only stick with moving averages, the longer-term weekly MAs give a different outlook on the current Bitcoin price movement.
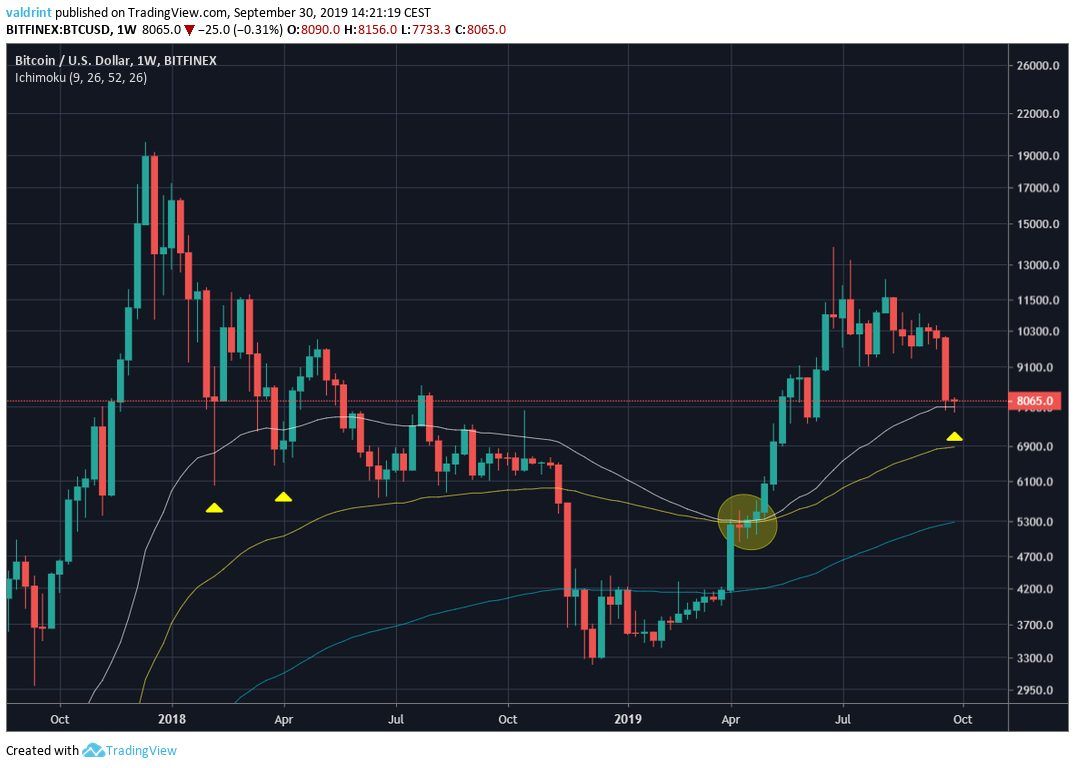
BTC is currently right above its 50-week MA having found support above it. Slightly below it, we have the 100-week MA.
A positive development occurred in the first weeks of April, when the two MAs rejected a bearish cross. To the contrary, during the first half of 2018, the price dropped below the 50-week MA on two occasions. Therefore, unlike the daily MAs, the weekly ones suggest that the current upward move might be stronger than the one preceding it.
While it is possible that the downtrend will go on for an extended period of time, the current dip does not confirm this possibility nor increase its likelihood.
How long do you think the downtrend will continue for Bitcoin? Let us know in the comments below!
Disclaimer: This article is not trading advice and should not be construed as such. Always consult a trained financial professional before investing in cryptocurrencies, as the market is particularly volatile.
Images are courtesy of Shutterstock, TradingView.
