
The IOTA price has been consolidating near 2000 satoshis since August 2019. The price has been showing strong signs of a reversal, indicating that a bullish trend may soon begin.
Weekly Analysis
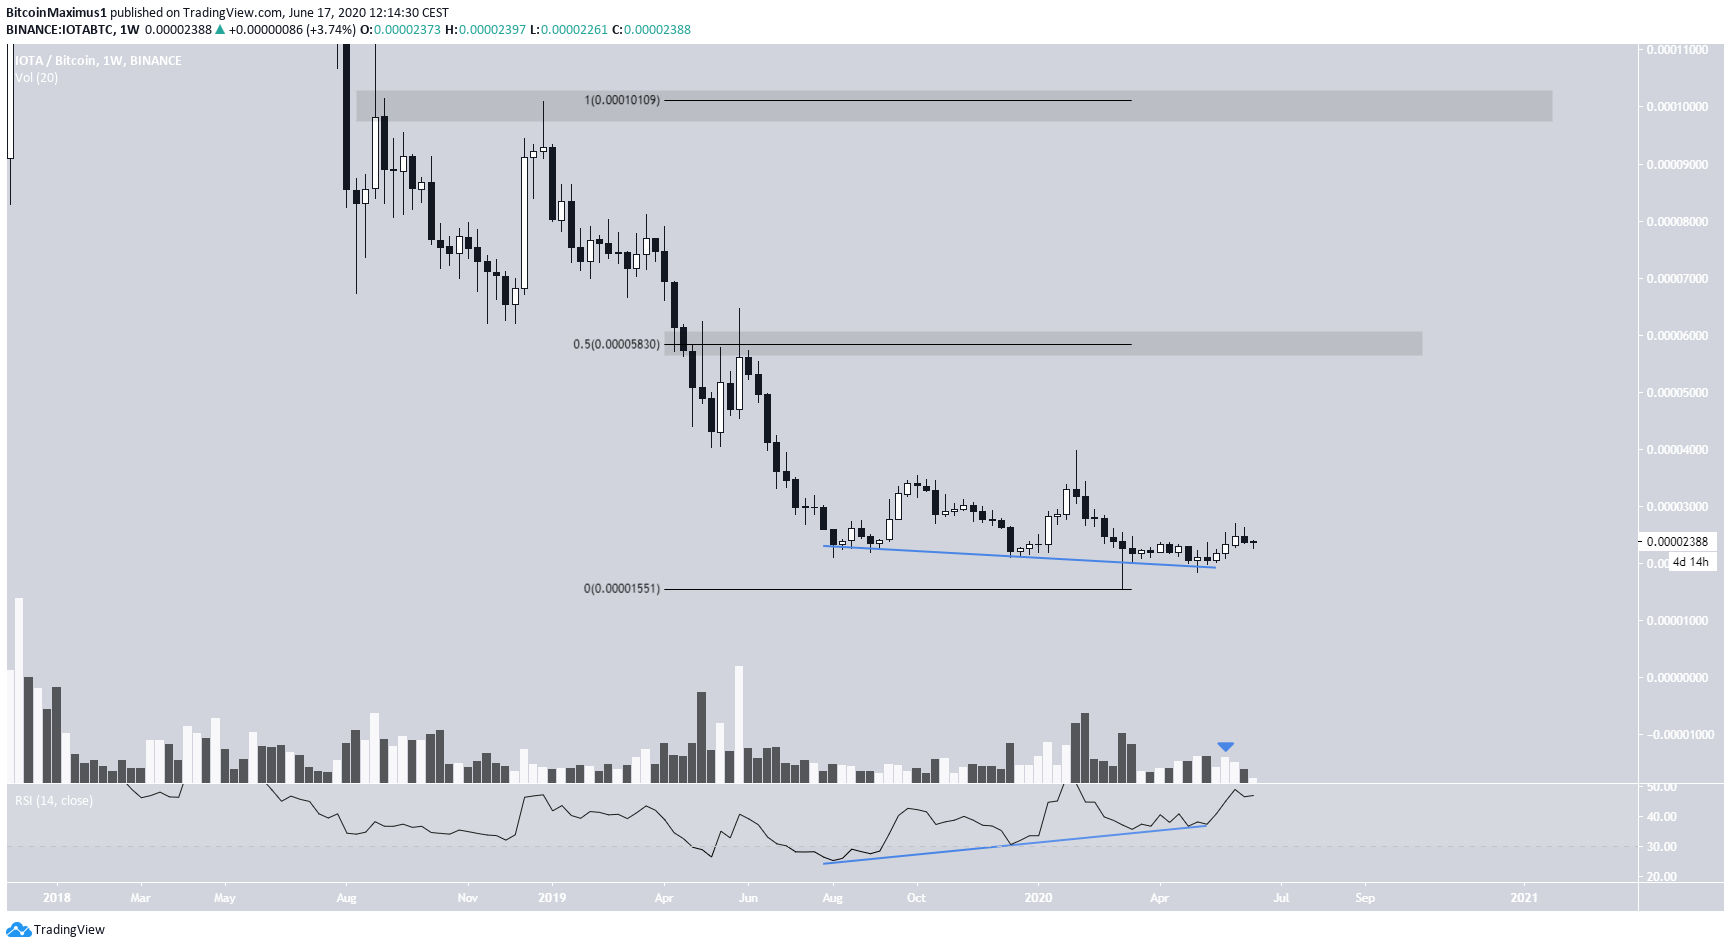
The weekly chart for IOTA reveals that the price has been decreasing since September 2018. While the decline was initially rapid, it has since gradually decreased. The price reached a low near 2000 satoshis in August 2019.
During this period, the weekly RSI formed considerable bullish divergence, a sign that the price is likely to move upwards, starting a new long-term trend. Volume has been increasing throughout the recent bullish weekly candlesticks – another bullish sign.
If the price indeed begins to move upwards, the closest resistance areas are found at 5,830 and 10,100 satoshis.
Well-known trader @LSDinmycoffee agrees with the long-term potential for IOTA. He believes that it’s one of the coins with the best-looking setup currently.
Out of all the shitcoin perp swaps, the best looking ones are $IOTA / $IOST
Trend Reversal
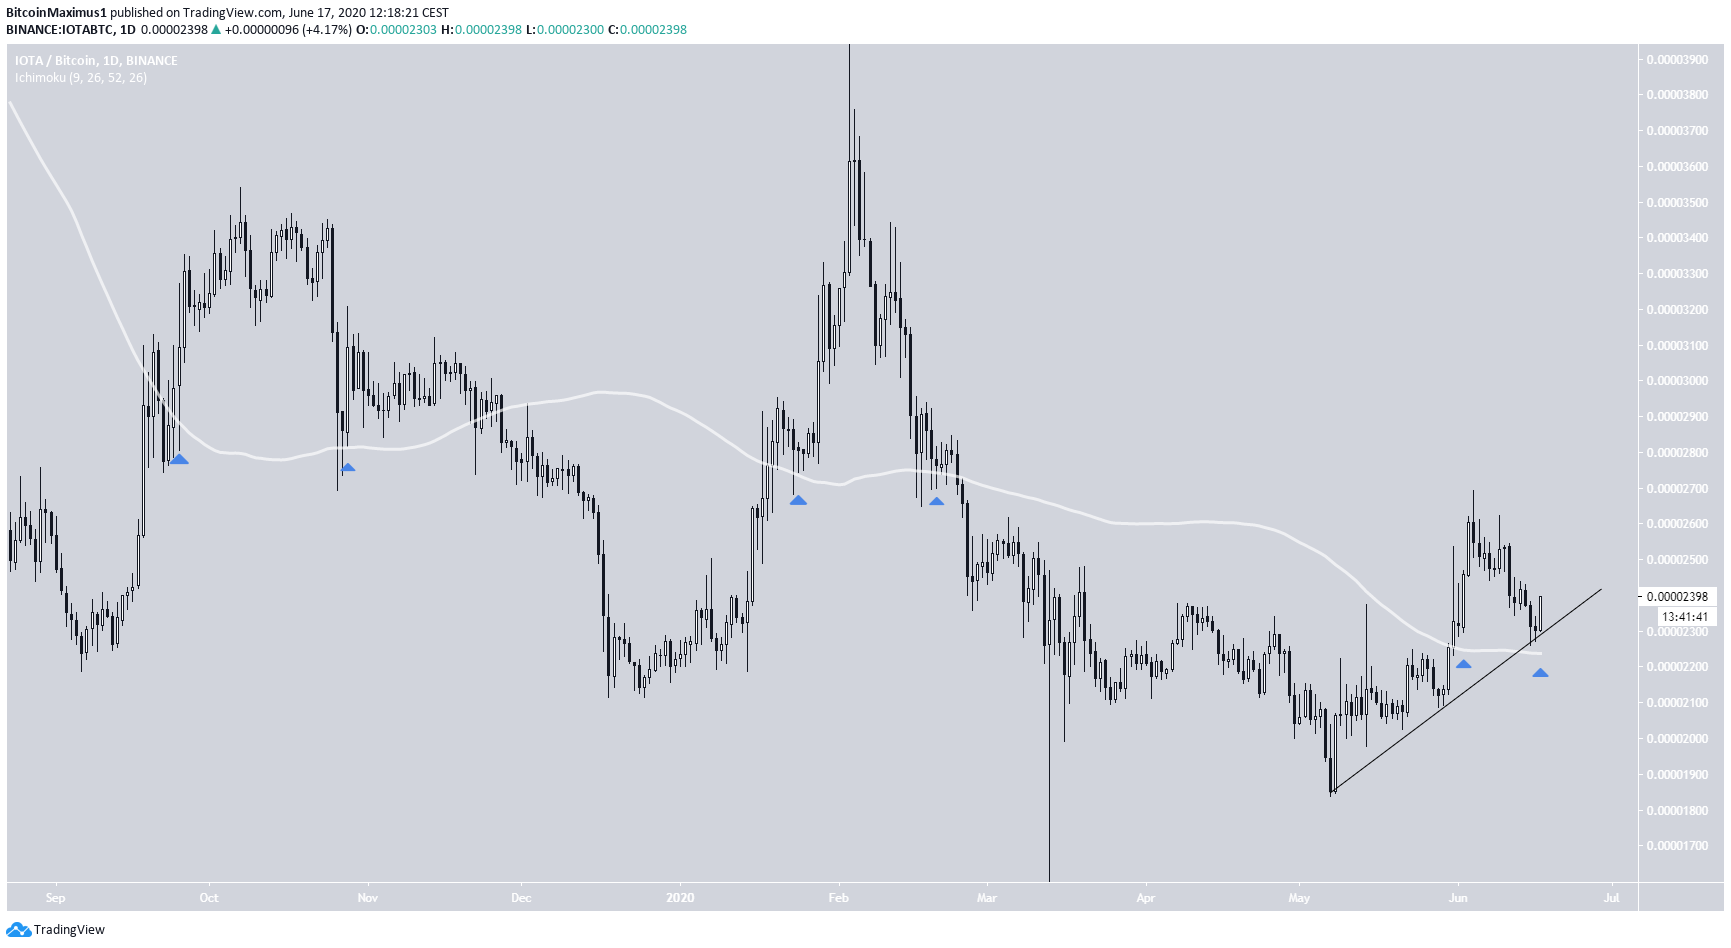
In the daily chart, IOTA is following a rising support line and has just bounced on it. It is in the process of creating a bullish engulfing candlestick.
Furthermore, the price has moved above its 100-day moving average (MA). This MA has been an almost perfect indicator of the trend since September 2019. In other words, price action had remained bullish when the price was above this MA, and vice versa.
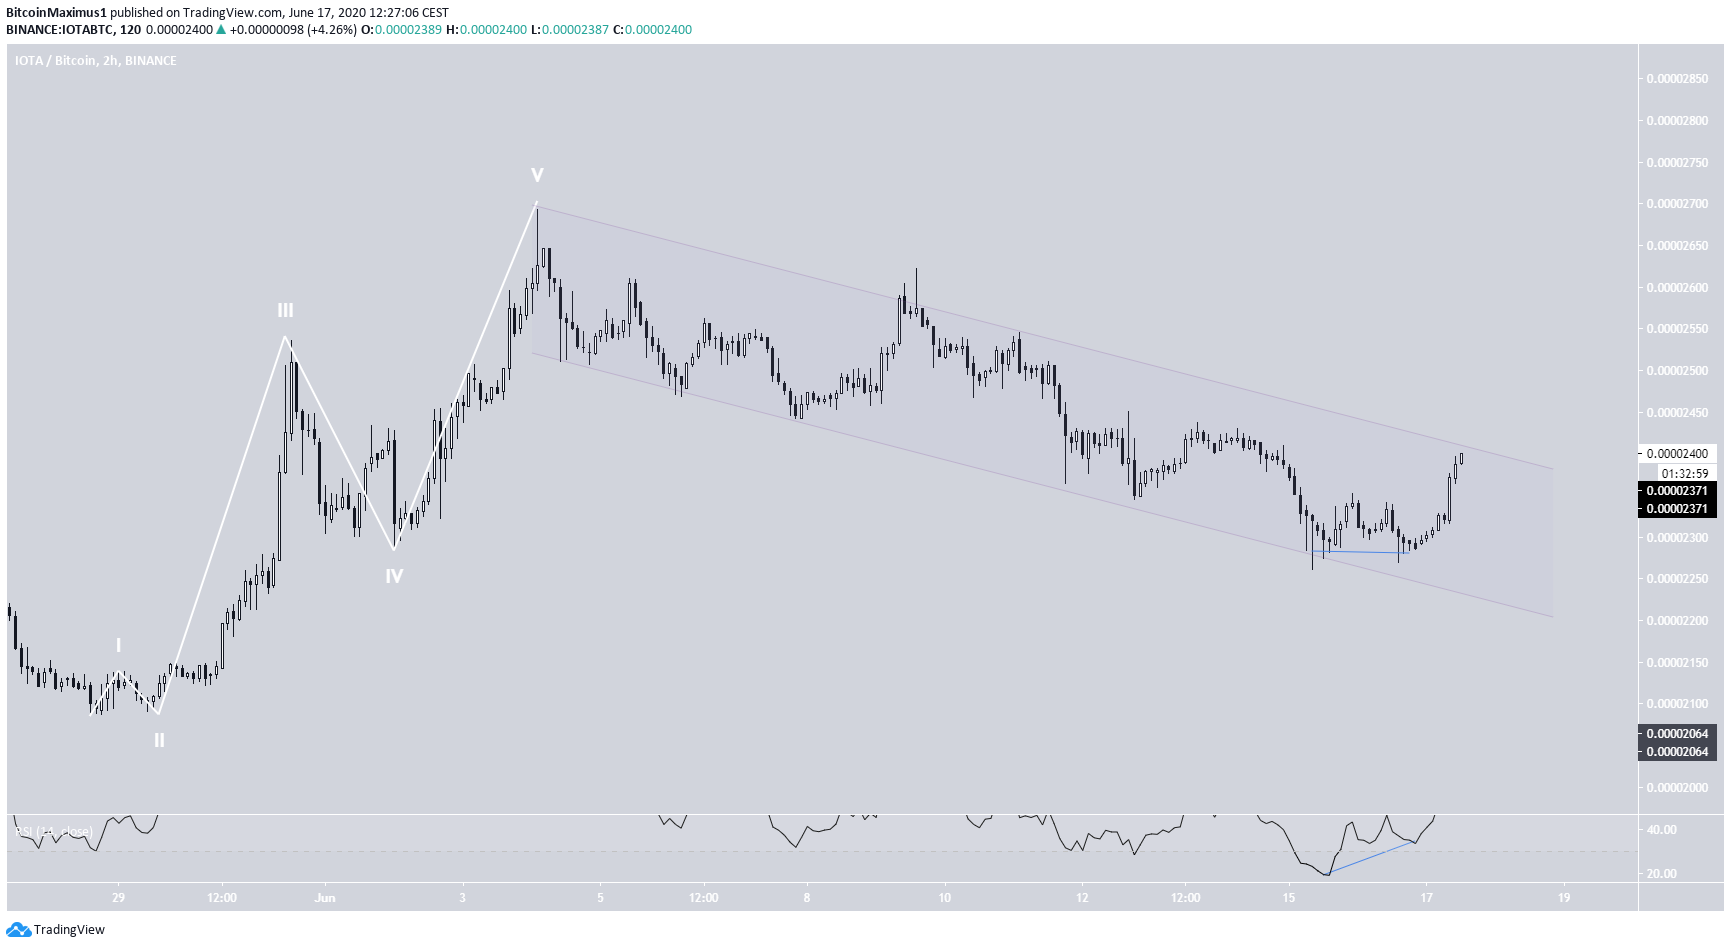
The short-term chart aligns with this view. It seems that the price has completed a five-wave Elliott formation on June 4, and has been correcting inside a descending parallel channel since.
It’s possible that the price finished correcting on June 15, when it created a double bottom combined with a bullish divergence on the RSI.
This would be confirmed with a breakout above the resistance line of the channel.
To conclude, the IOTA chart indicates that the price is likely to begin a long-term trend reversal soon. This would be confirmed by a breakout above the descending resistance line of the current short-term channel.
