

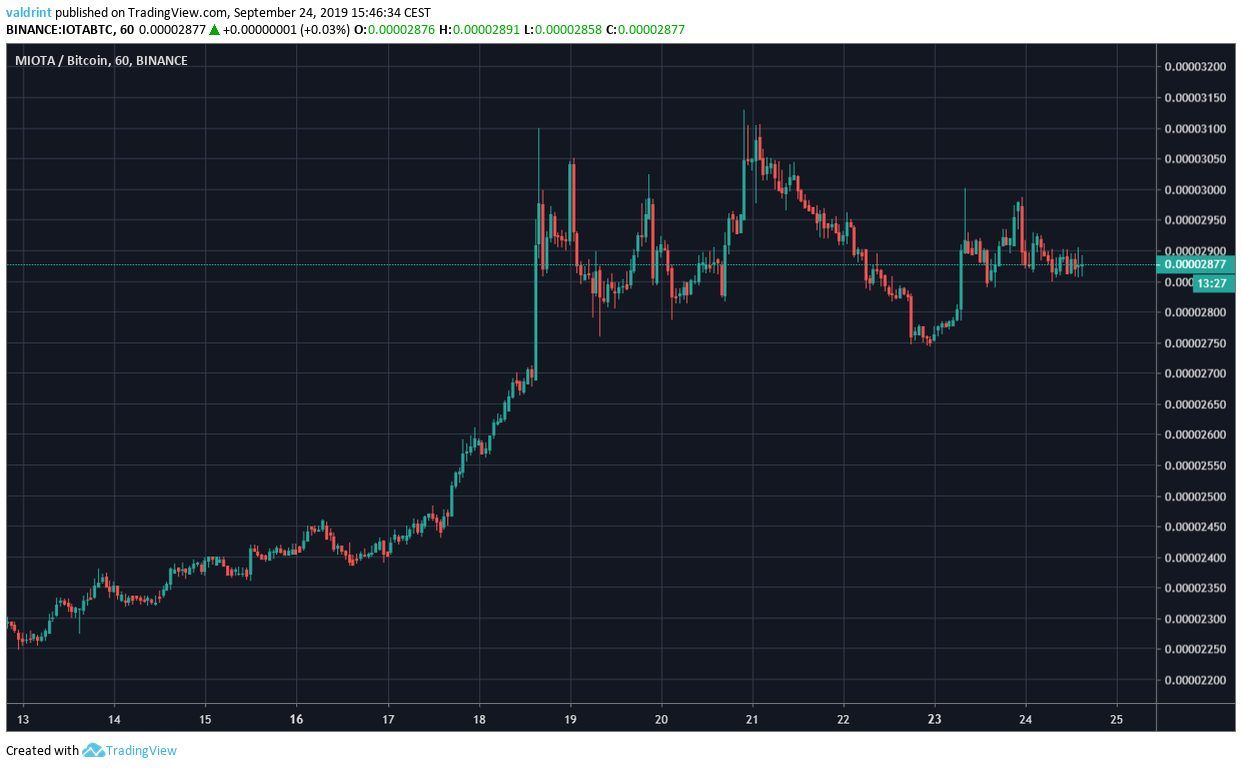
On September 13, 2019, the IOTA price reached a low of 2254 satoshis. It began a gradual upward move which intensified on September 17. The price reached similar highs near 3100 satoshis on September 18 and 21. It has been decreasing since.

How long will IOTA continue to decrease? Keep reading below in order to find out.
For our previous analysis, click here.
IOTA Price: Trends and Highlights for September 24
- IOTA/BTC broke down below an ascending support line.
- The closest resistance area is found at 3150 satoshis
- The closest support area is found at 2650 satoshis.
- IOTA made a double top combined with bearish divergence.
- It is trading inside a short-term descending wedge.
Previous Movement
The IOTA price followed an ascending support line since September 18. Additionally, it created a double top at 3100 satoshis on September 18 and 21.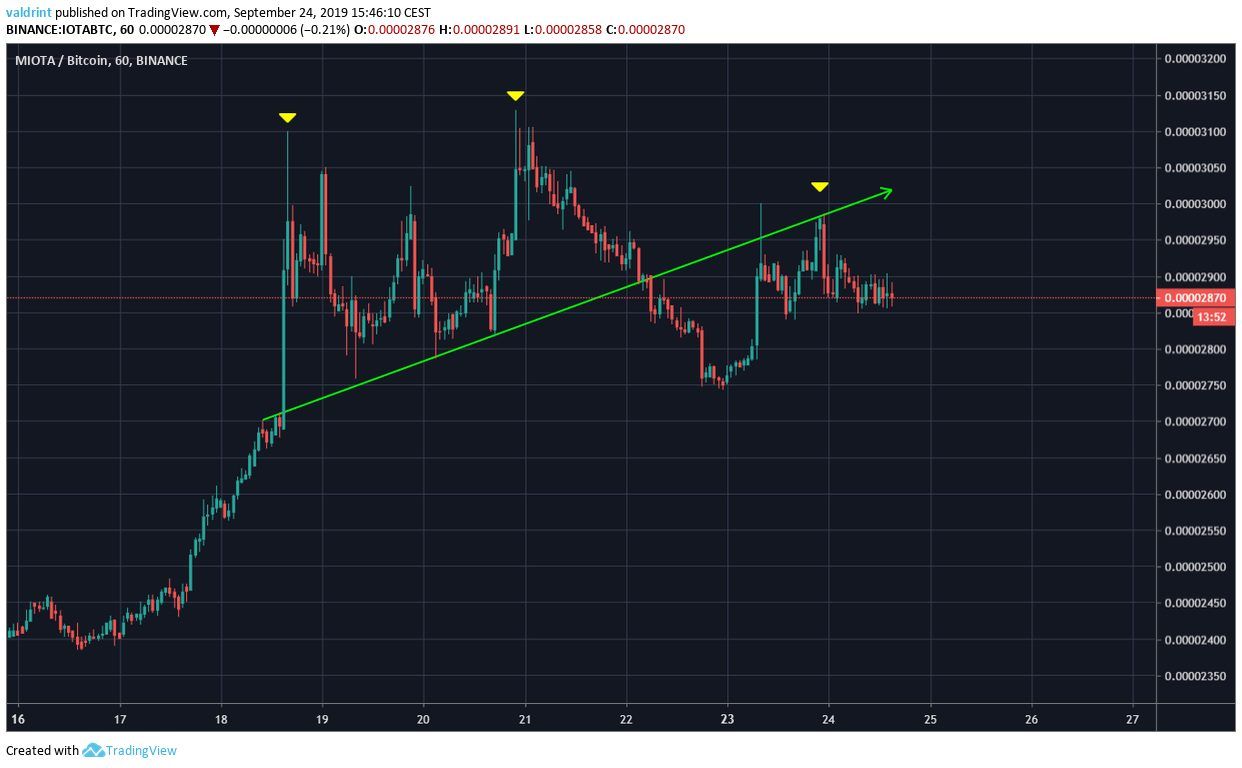 IOTA broke down the next day.
Afterward, it increased and validated the previous support line on September 24.
IOTA broke down the next day.
Afterward, it increased and validated the previous support line on September 24.
Double Top
Looking at the six-hour time-frame, we can identify one resistance and one support area. They are found at 3150 and 2650 satoshis, respectively. The price movement since reaching the resistance area has been characterized by long upper wicks, a sign of selling pressure in the market.
Additionally, we can see that the double top was combined with bearish divergence in the RSI.
The price movement since reaching the resistance area has been characterized by long upper wicks, a sign of selling pressure in the market.
Additionally, we can see that the double top was combined with bearish divergence in the RSI.
 This increases the significance of the pattern and makes it likely that IOTA has begun a reversal.
Short-Term Pattern & Future Movement
Looking at the hourly chart we can see that IOTA has been trading inside a descending wedge since September 21. The descending wedge is considered a bullish pattern.
Therefore, we would expect the price to decrease at the rate predicted by the wedge until it reaches the support area.
Afterward, a price breakout is possible, with the target being the resistance area at 3150 satoshis.
The descending wedge is considered a bullish pattern.
Therefore, we would expect the price to decrease at the rate predicted by the wedge until it reaches the support area.
Afterward, a price breakout is possible, with the target being the resistance area at 3150 satoshis.

IOTA Price Summary
The IOTA price recently made a double top and broke down below an ascending support line. It is trading inside a descending wedge. According to our analysis, it is likely to decrease at the rate predicted by the wedge until it reaches the support area at 2650 satoshis. For hypothetical trading purposes, IOTA could be considered a buy once it reaches the support area. Do you think IOTA will reach the resistance line? Let us know in the comments below.Disclaimer: This article is not trading advice and should not be construed as such. Always consult a trained financial professional before investing in cryptocurrencies, as the market is particularly volatile. Images are courtesy of Shutterstock, Trading
Disclaimer
In line with the Trust Project guidelines, this price analysis article is for informational purposes only and should not be considered financial or investment advice. BeInCrypto is committed to accurate, unbiased reporting, but market conditions are subject to change without notice. Always conduct your own research and consult with a professional before making any financial decisions. Please note that our Terms and Conditions, Privacy Policy, and Disclaimers have been updated.

Valdrin Tahiri
Valdrin discovered cryptocurrencies while he was getting his MSc in Financial Markets from the Barcelona School of Economics. Shortly after graduating, he began writing for several different cryptocurrency related websites as a freelancer before eventually taking on the role of BeInCrypto's Senior Analyst.
(I do not have a discord and will not contact you first there. Beware of scammers)
READ FULL BIO
Sponsored
Sponsored