
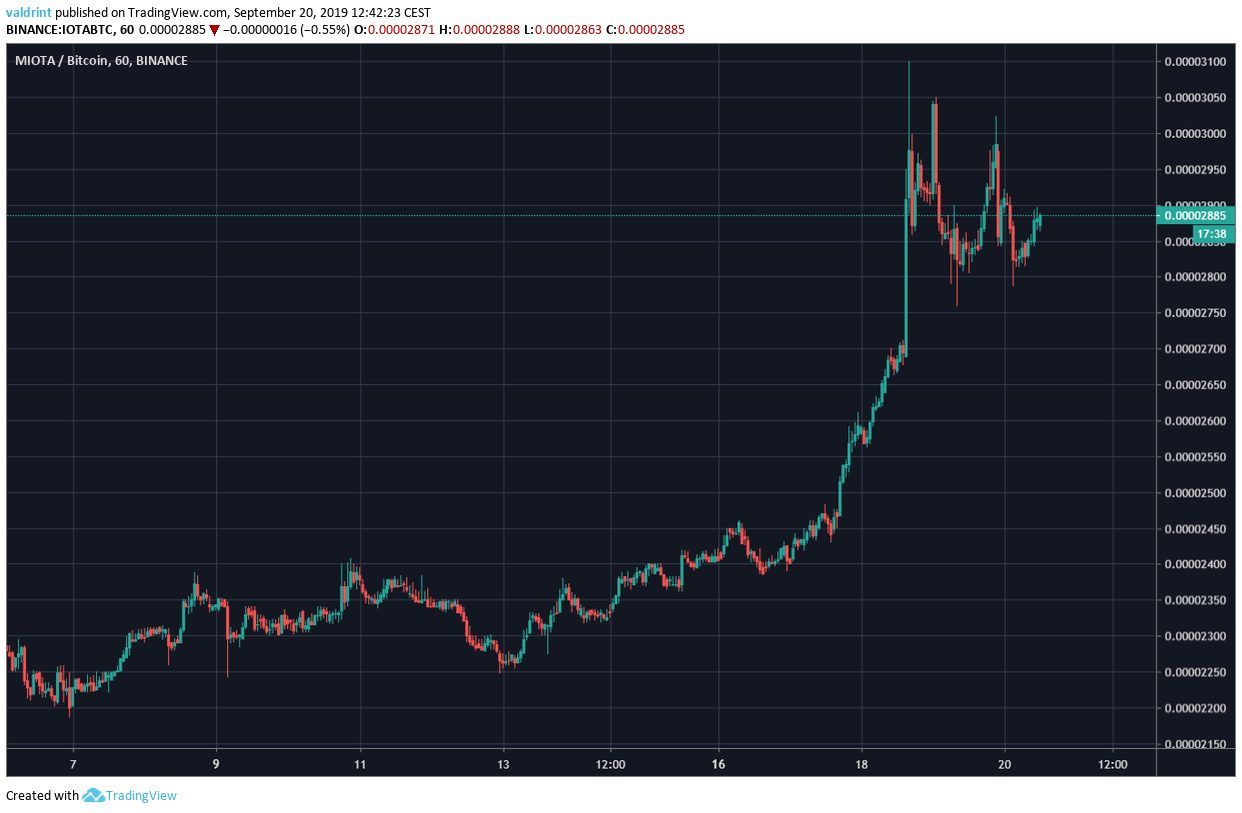
On September 7, 2019, the IOTA price reached a low of 2221 satoshis. A gradual upward move followed, which intensified on September 18. IOTA reached a high of 3100 satoshis the next day. It has been decreasing since.
For our previous analysis, click here.
IOTA Price: Trends and Highlights for September 20
- IOTA/BTC is trading inside a symmetrical triangle.
- IOTA is facing resistance from its 100-day moving average.
- A resistance area can be found at 3100 satoshis.
- There is bearish divergence developing in the RSI.
- A support area can be found at
Significant Resistance
Looking at the daily chart, we can see one significant resistance area found near 3100 satoshis.
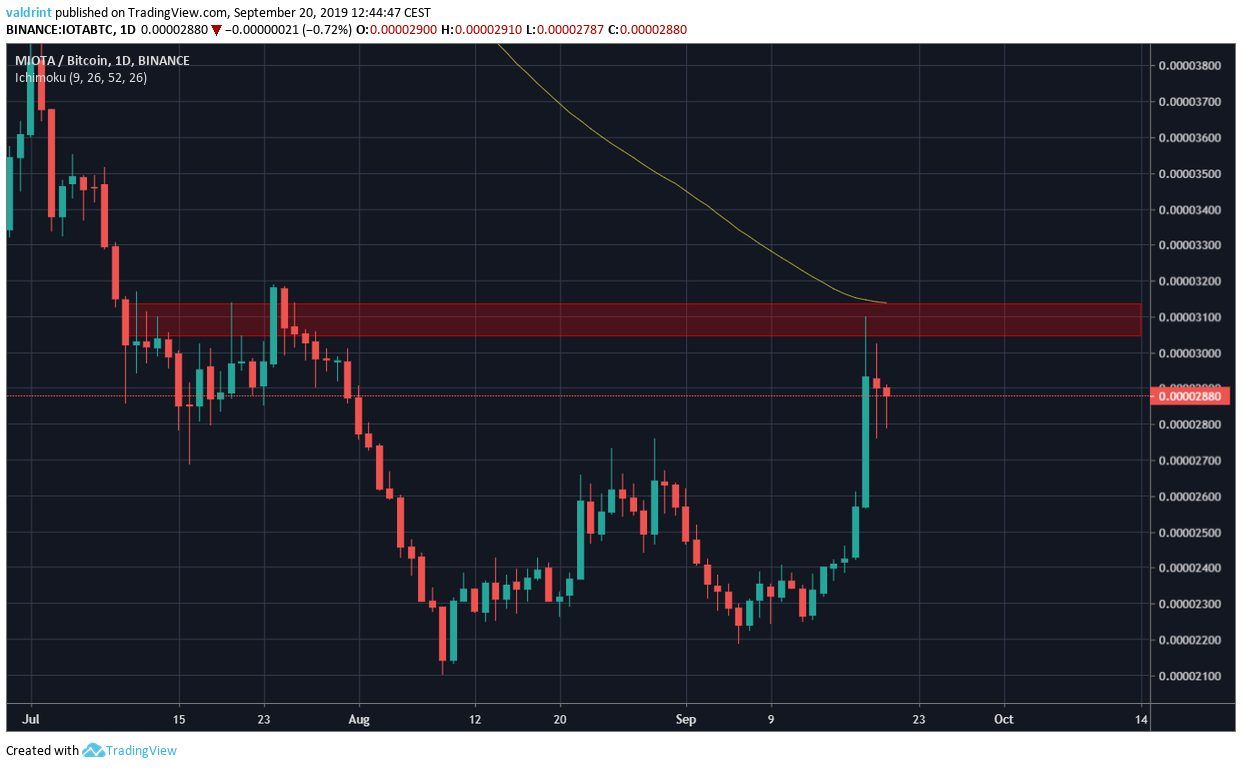
This area also coincides with the 100-day moving average, increasing its significance
It was touched by the upper wick of September 18, before the price was pushed downward.
Will IOTA be successful in moving above it?
Symmetrical Triangle
Looking at the hourly time-frame we can see that IOTA has been trading inside a symmetrical triangle since reaching a high on September 18.
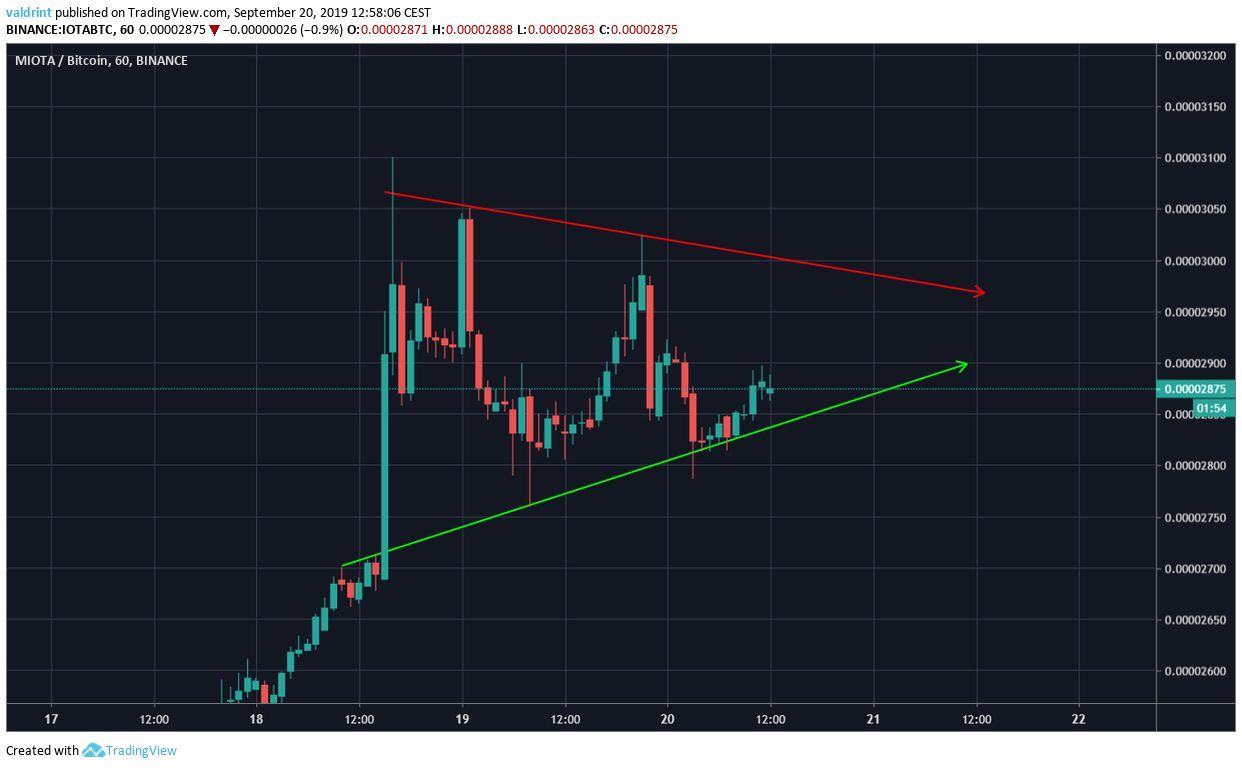
Due to the presence of wicks, both the resistance and support lines can have slightly different slopes.
The symmetrical triangle is considered a neutral pattern.
Thus, when occurring after an uptrend, it often means that it will act as a continuation pattern, indicating a breakout.
Let’s take a look at technical indicators to see how likely that is.
Technical Indicators
When looking at a longer time-frame, the first thing we notice is the presence of long upper wicks near the resistance area.
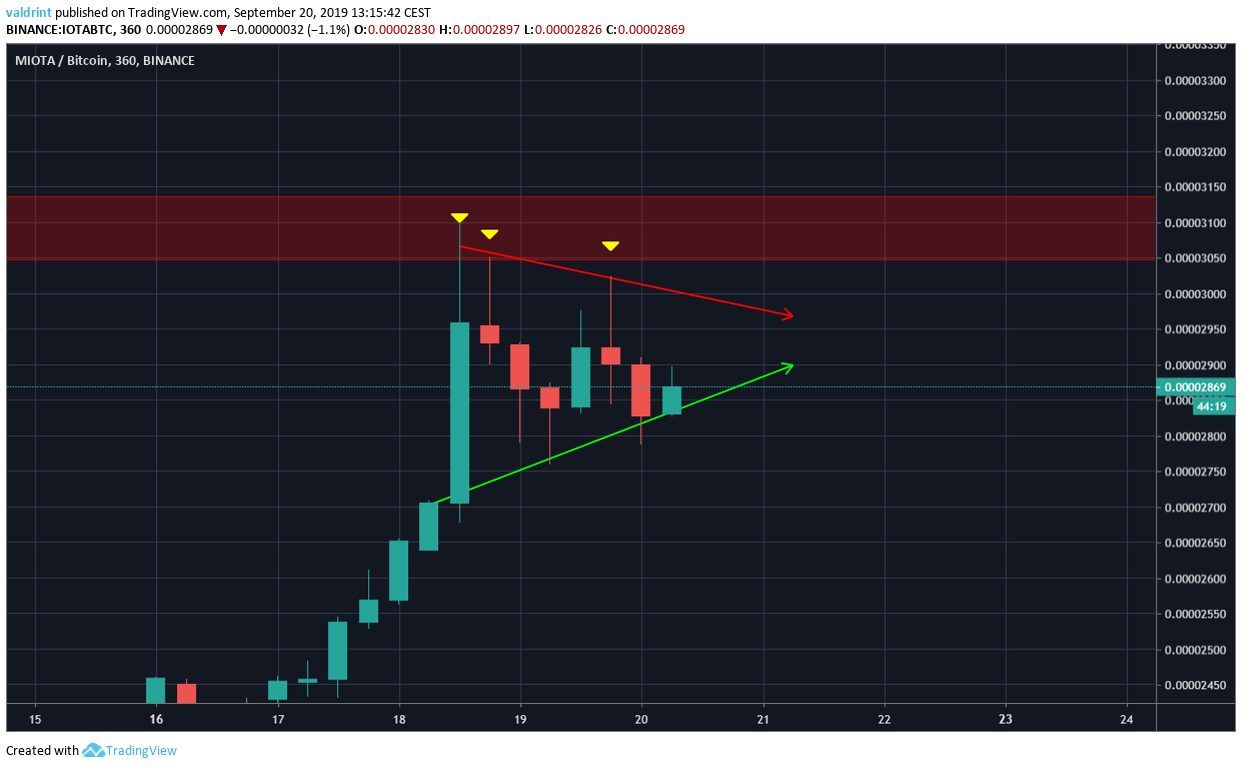
Additionally, we can see the presence of bearish divergence in the RSI.
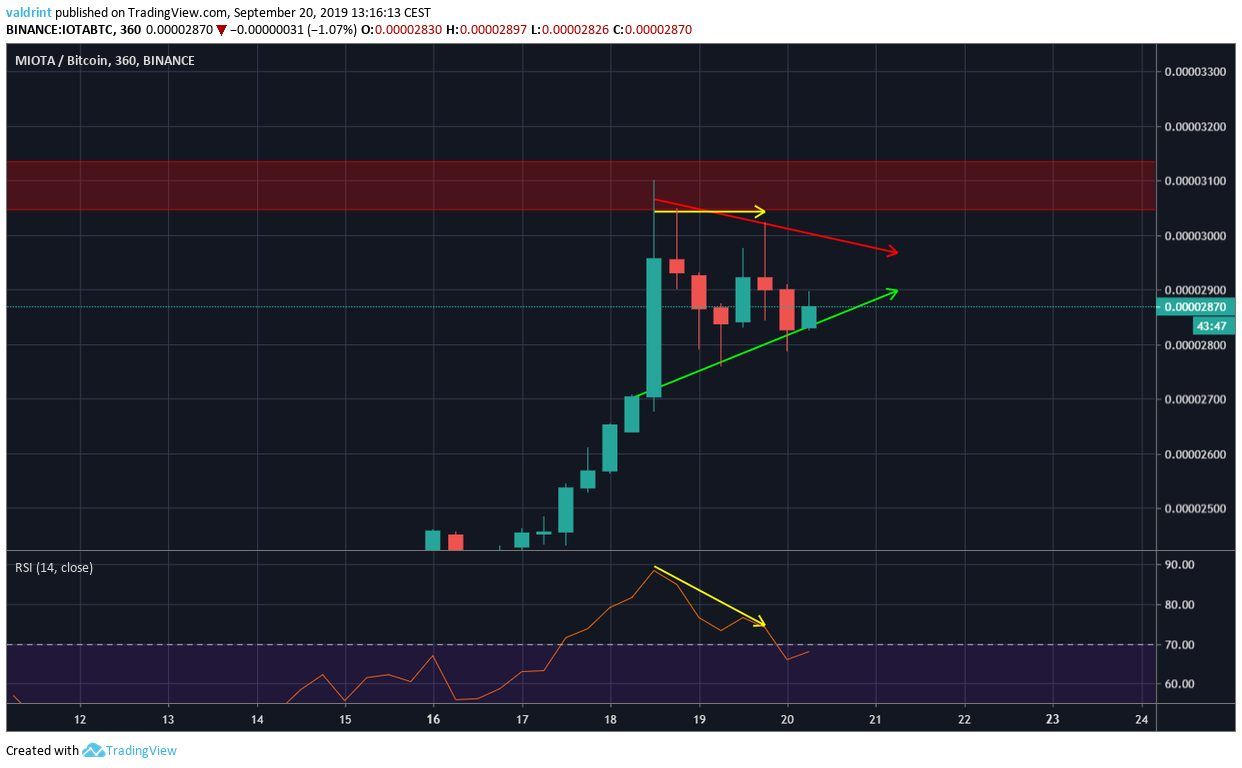
Even though the divergence is not present in the MACD, it is relatively significant.
This makes us believe that even if IOTA breaks out from the triangle, it will likely create a double top and will not be successful in moving above the resistance area.
Future Movement
An outline of future price movement is given below.
Additionally, one support area is traced below.
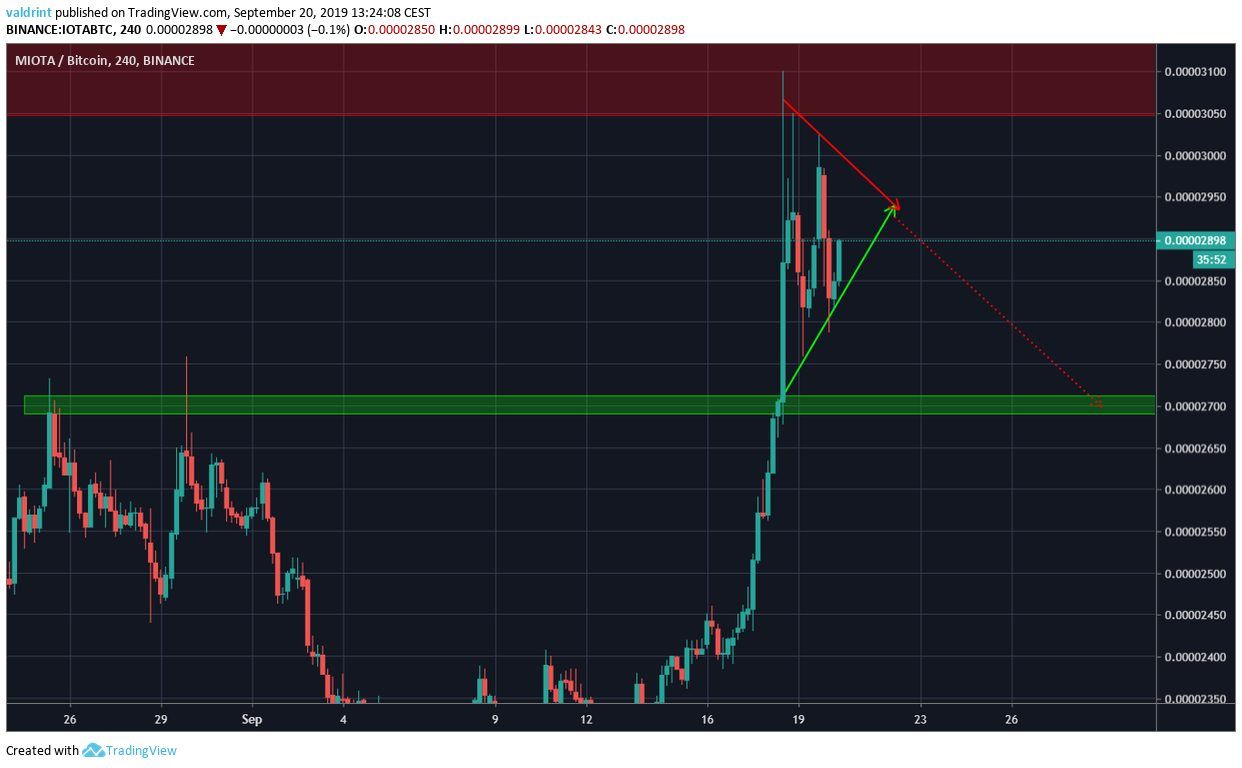
The price is likely to continue trading inside the triangle, before eventually breaking down and reaching the support area, which is found at 2700 satoshis.
IOTA Price Summary
The IOTA price is trading inside a symmetrical triangle.
According to our analysis, it is likely to decrease and reach the support area at 2700 satoshis.
For hypothetical trading purposes, we consider IOTA a sell near 3000 satoshis.
Do you think IOTA will reach the resistance line? Let us know in the comments below.
Disclaimer: This article is not trading advice and should not be construed as such. Always consult a trained financial professional before investing in cryptocurrencies, as the market is particularly volatile.
Images are courtesy of Shutterstock, Trading
