

On June 23, the price of IOTA (IOTA) reached a high of 44,890 satoshis. Shortly after, it initiated a gradual downward move.
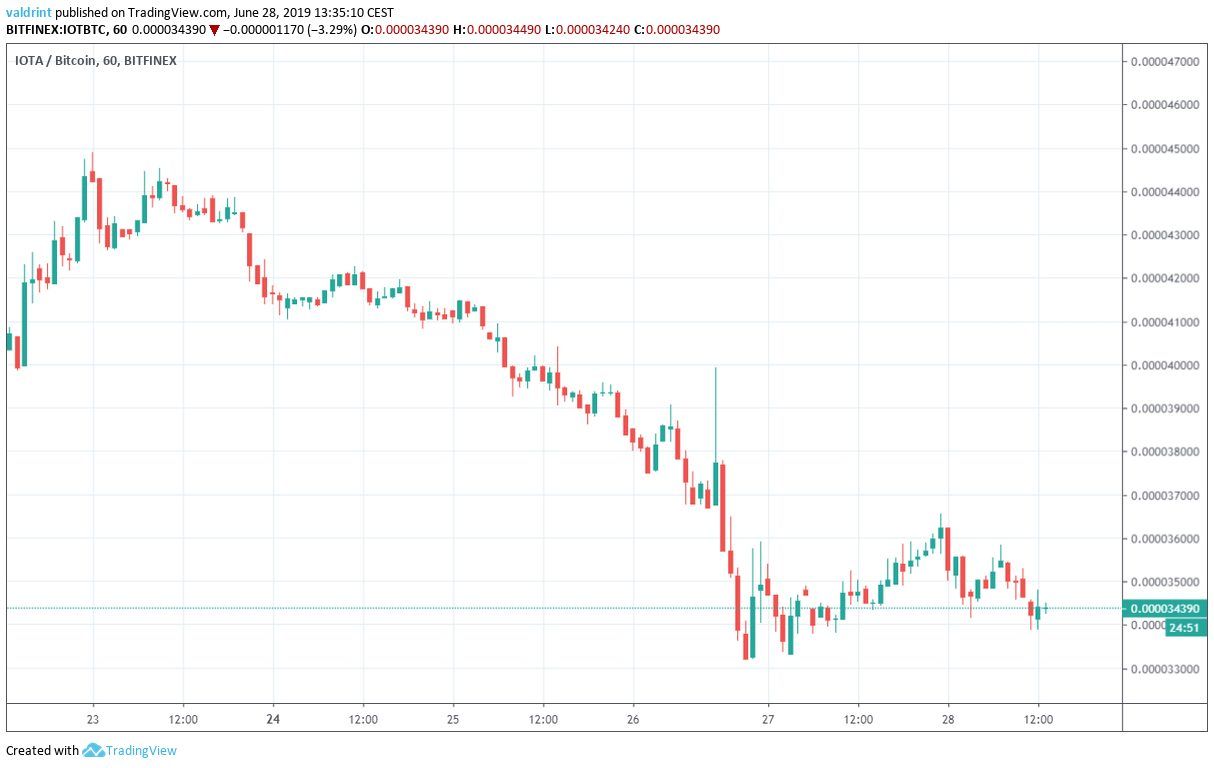 The IOTA price reached a low of 33,210 satoshis on June 26.
Since then, it has seemingly created a support area near this level and is possibly getting ready for an upward move. When will this move occur? Keep reading below and find out.
The IOTA price reached a low of 33,210 satoshis on June 26.
Since then, it has seemingly created a support area near this level and is possibly getting ready for an upward move. When will this move occur? Keep reading below and find out.
IOTA Price: Trends and Highlights for June 28
- The IOTA price is at an all-time low.
- There is a long-term bullish divergence developing in the RSI and the MACD.
- The moving averages (MA) are offering resistance to the price.
- The price is trading inside a descending wedge.
- There is a short-term bullish divergence developing in the RSI.
Long-Term Outlook for the IOTA Price
The price of IOTA on Bitfinex is analyzed at weekly intervals from May 2017 to June 2019
In October 2017, the price reached lows close to 43,600 satoshis. Afterward, a massive upward move occurred.
However, since reaching highs of 448,000 satoshis in December of the same year, the price has been steadily decreasing.
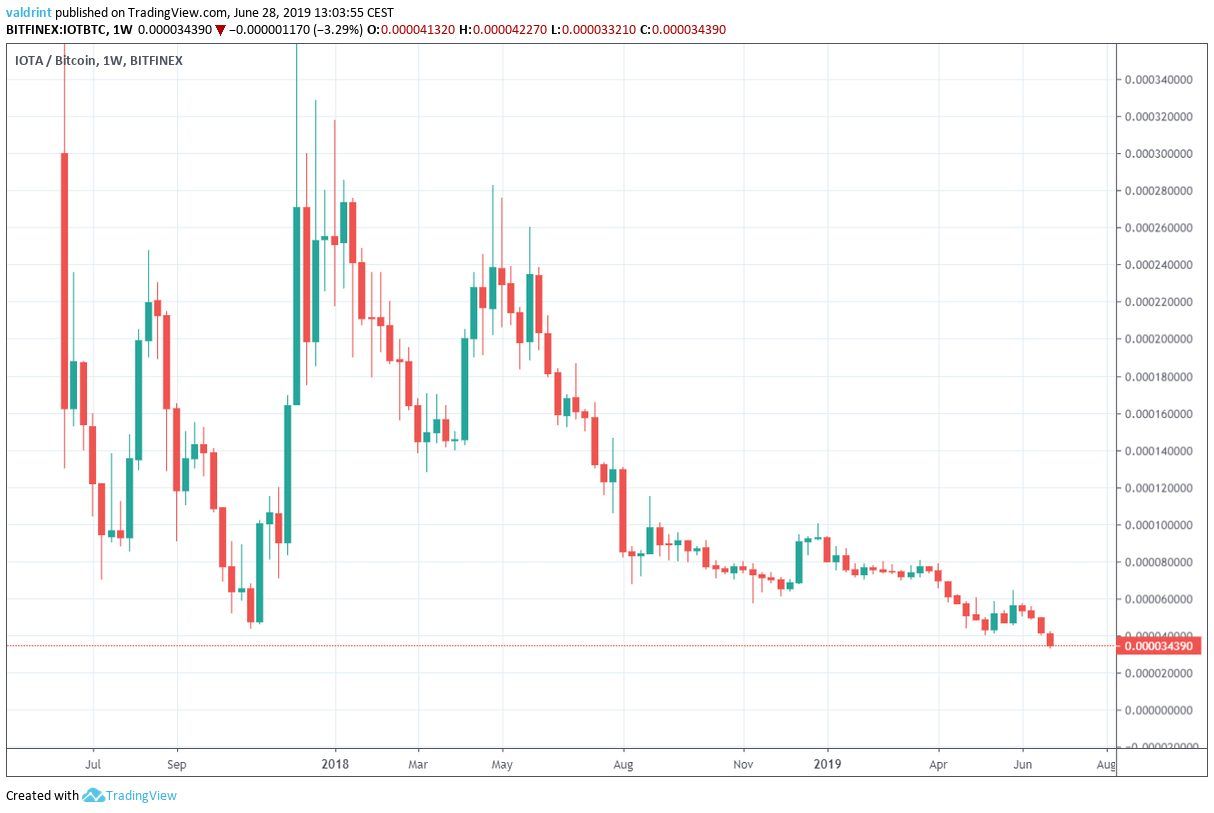 The IOTA price has continuously created lower lows. However, the aforementioned low of 43,600 remained the lowest point. This was so until May 2019, when the price decreased below it.
At the time of writing, it was trading close to 34,300 satoshis.
Will the price initiate a reversal or will it continue to decrease? Let’s take a look at some technical indicators and find out.
The IOTA price has continuously created lower lows. However, the aforementioned low of 43,600 remained the lowest point. This was so until May 2019, when the price decreased below it.
At the time of writing, it was trading close to 34,300 satoshis.
Will the price initiate a reversal or will it continue to decrease? Let’s take a look at some technical indicators and find out.
Technical Indicators
The price of IOTA is analyzed alongside the RSI and the MACD in the first graph and the 10- and 20-period moving averages (MA) in the second graph.
The price of IOTA has been following a descending support line since reaching lows close to 60,000 satoshis in August 2018.
The MACD generated a low during the same month. However, it has been increasing since.
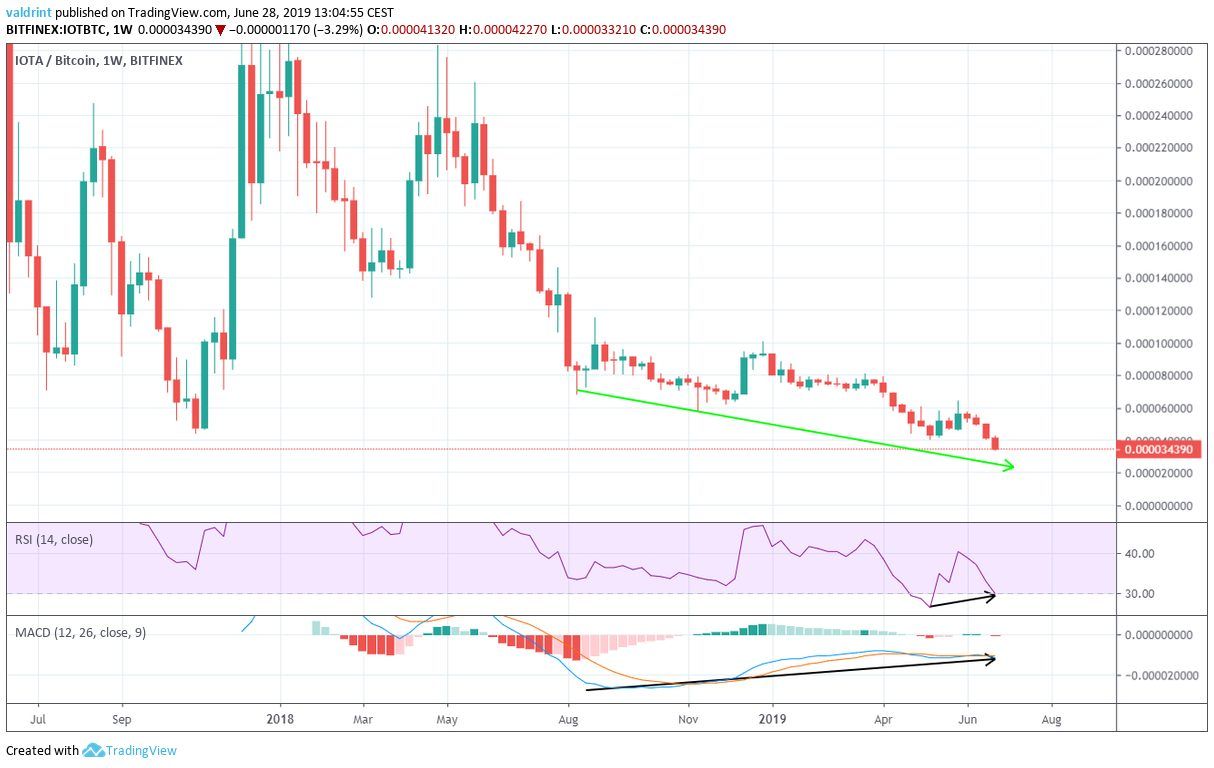 The RSI has done the same, albeit at a much later time. The divergence only became present in May 2019.
Bullish divergences often precede price increases. This gains more significance since it is occurring in long-term timeframes and in both indicators.
The moving averages, however, indicate that the price is still in a downtrend.
The RSI has done the same, albeit at a much later time. The divergence only became present in May 2019.
Bullish divergences often precede price increases. This gains more significance since it is occurring in long-term timeframes and in both indicators.
The moving averages, however, indicate that the price is still in a downtrend.
 A bearish cross occurred between the 10- and 20-period MAs in March 2019.
Since then, the price has been trading below both MAs, facing very close resistance from the 10-period MA.
A bearish cross occurred between the 10- and 20-period MAs in March 2019.
Since then, the price has been trading below both MAs, facing very close resistance from the 10-period MA.
Descending Wedge
A look at the daily time-frame shows that the price has been trading inside a descending wedge since the beginning of 2019. The descending wedge is a bullish pattern, making a price breakout more likely. At the time of writing, the IOTA price was trading right on the support line of the wedge.
If it begins to increase, where will it find resistance?
At the time of writing, the IOTA price was trading right on the support line of the wedge.
If it begins to increase, where will it find resistance?
Possible Reversal
We used the Fibonacci Retracement tool from the top of 63,000 satoshis to the current low. The closest resistance area is found near 40,000 satoshis, followed by the next one at 45,000.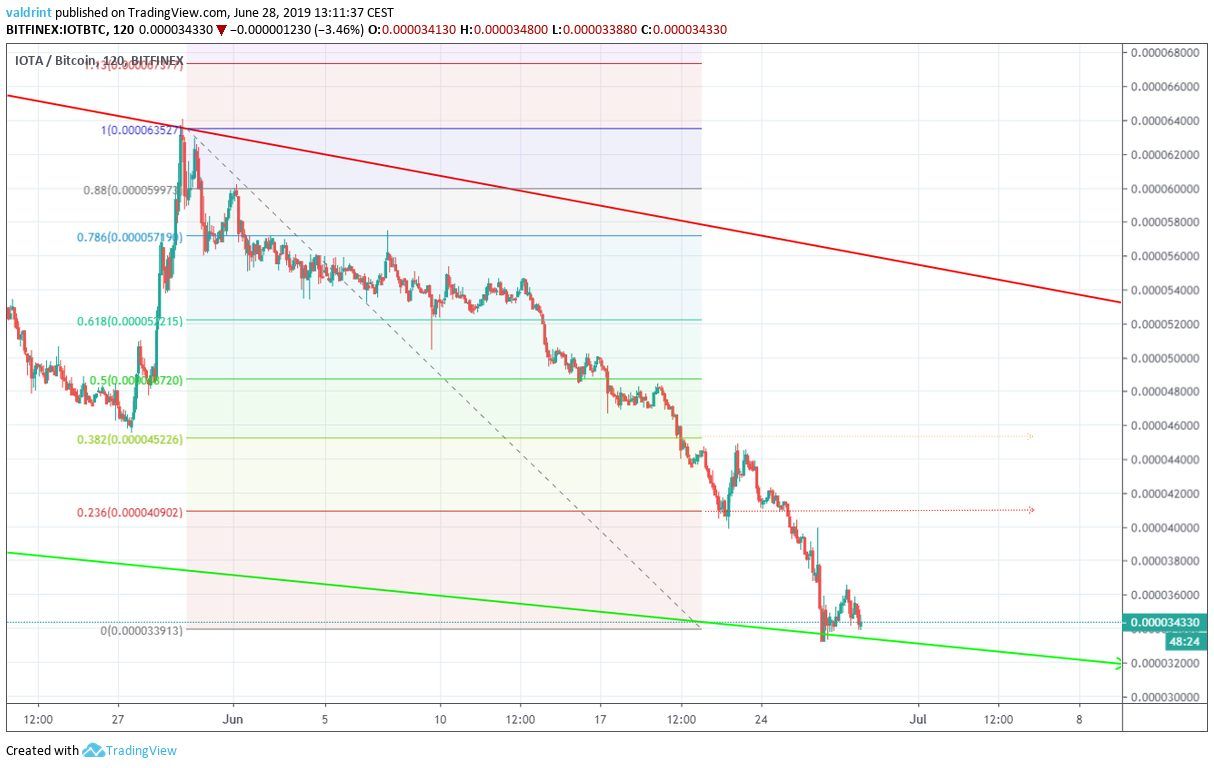 If the price begins an upward move towards the resistance line of the wedge, it is likely to initially face resistance at these two targets.
An analysis of the RSI also supports a price increase.
If the price begins an upward move towards the resistance line of the wedge, it is likely to initially face resistance at these two targets.
An analysis of the RSI also supports a price increase.
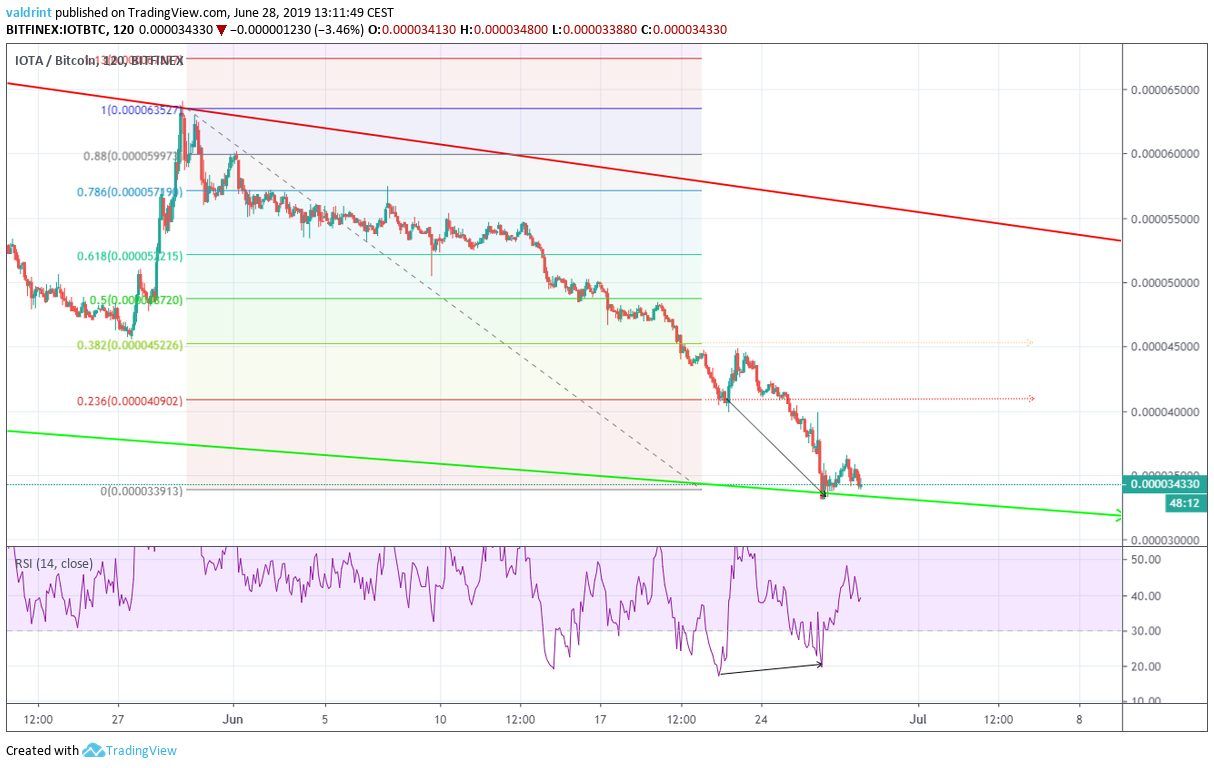 The RSI has been generating bullish divergence since June 20.
The fact that it is occurring on the support line of a bullish pattern increases its significance.
Therefore, the use of these indicators makes it likely that the price will soon initiate an upward move.
The RSI has been generating bullish divergence since June 20.
The fact that it is occurring on the support line of a bullish pattern increases its significance.
Therefore, the use of these indicators makes it likely that the price will soon initiate an upward move.
Summary
The most recent decrease for IOTA caused the price to create a new all-time low. It has been trading inside a descending wedge for the past six months. The technical indicators have begun to indicate that a possible reversal may occur. Before the IOTA price does so, however, there are several resistance areas it must first clear. Do you think the price of IOTA will initiate a reversal? Let us know in the comments below.Disclaimer: This article is not trading advice and should not be construed as such. Always consult a trained financial professional before investing in cryptocurrencies, as the market is particularly volatile. Images are courtesy of Shutterstock, TradingView.
Disclaimer
In line with the Trust Project guidelines, this price analysis article is for informational purposes only and should not be considered financial or investment advice. BeInCrypto is committed to accurate, unbiased reporting, but market conditions are subject to change without notice. Always conduct your own research and consult with a professional before making any financial decisions. Please note that our Terms and Conditions, Privacy Policy, and Disclaimers have been updated.

Valdrin Tahiri
Valdrin discovered cryptocurrencies while he was getting his MSc in Financial Markets from the Barcelona School of Economics. Shortly after graduating, he began writing for several different cryptocurrency related websites as a freelancer before eventually taking on the role of BeInCrypto's Senior Analyst.
(I do not have a discord and will not contact you first there. Beware of scammers)
READ FULL BIO
Sponsored
Sponsored