
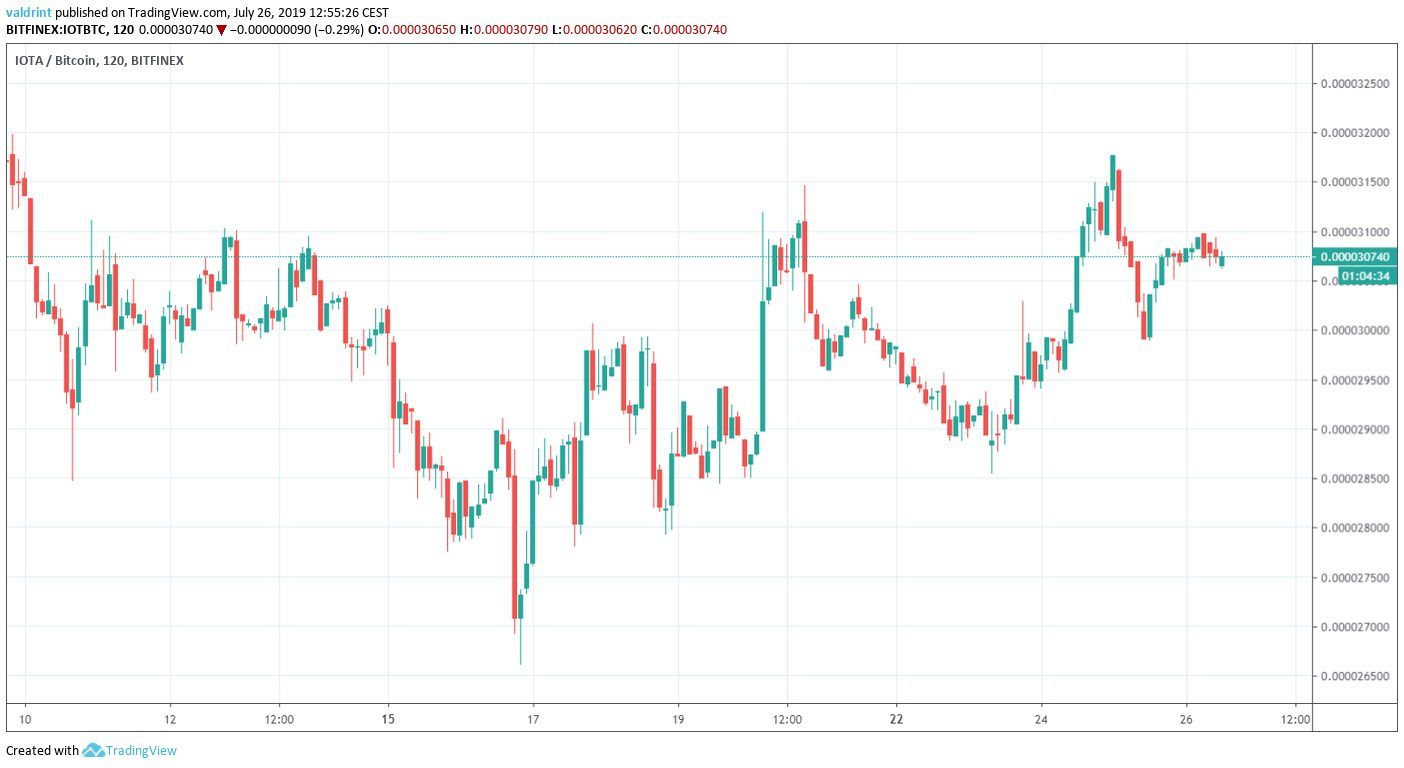
In the period from July 10 to July 14, 2019, the IOTA (IOTA) price made three unsuccessful attempts at breaking out above 31,000 satoshis. A decrease ensued shortly after and the price reached a low of 26,700 satoshis on July 16. It has been increasing since. On July 25, it was finally successful in breaking out above 31,000 satoshis.
How long will this increase continue for IOTA? Keep scrolling in order to find the answer.
For our previous analysis, click here.
If you are interested in trading cryptocurrencies with a multiplier of up to 100x on our new partner exchange with the lowest fees, follow this link to get a free StormGain account!
IOTA Price: Trends and Highlights for July 26
- IOTA/BTC is trading inside a short-term ascending channel.
- It is also trading inside a long-term descending channel.
- Daily moving averages are close to making a bullish cross.
- Daily candlestick patterns are bullish.
IOTA Price Previous & Current Pattern
Since July 10, the IOTA price has been trading inside a symmetrical triangle.
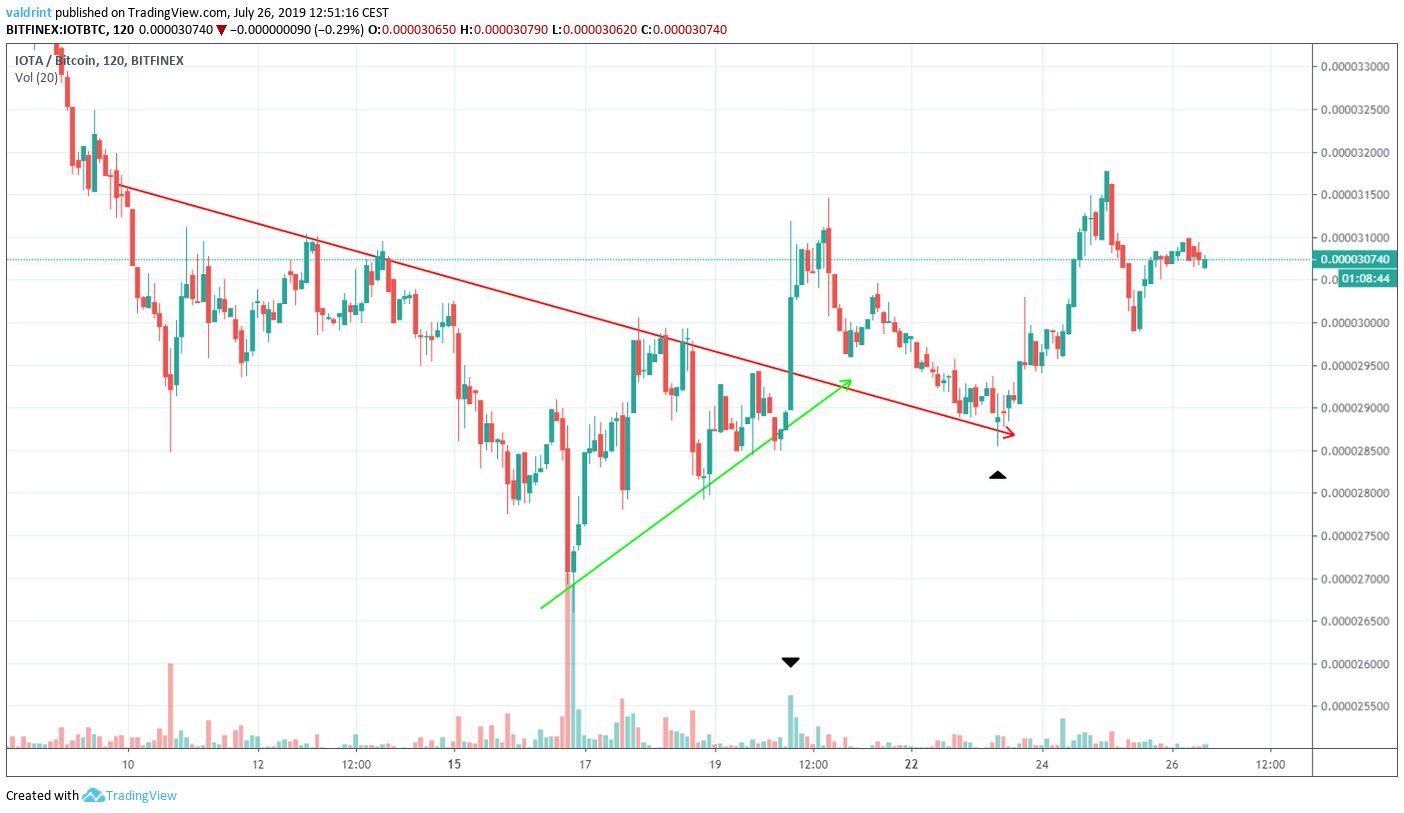
On July 19, the price broke out.
The breakout transpired with above-average volume.
Afterward, the price decreased until it touched the previous resistance line.
From there, it initiated a reversal.
Currently, it is trading inside the ascending channel outlined below.
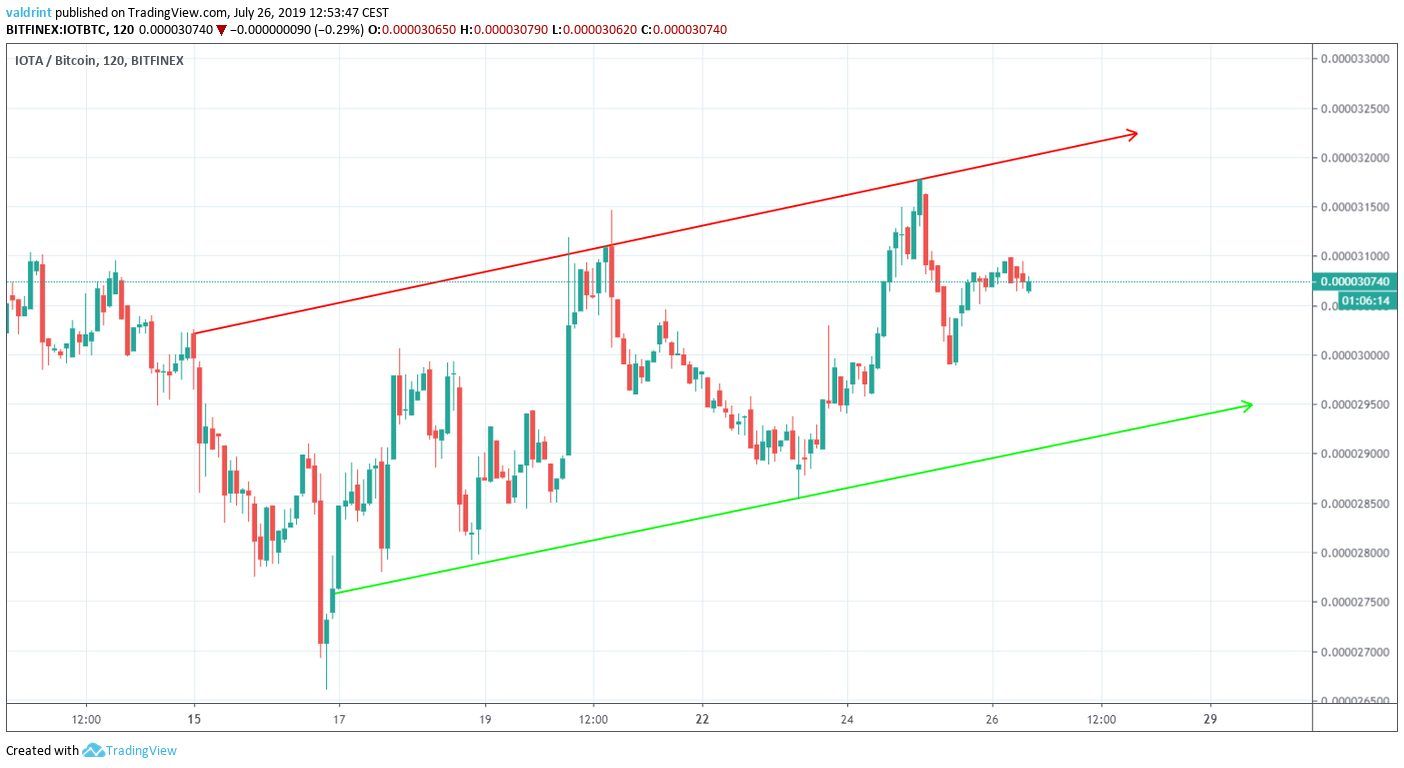
Since the support line has not been confirmed yet, we drew a line parallel to the resistance line to find it.
At the time of writing, the price was trading in the middle of the channel.
Where will it go next?
Technical Indicators
A look at the daily time-frame shows that since December 2018, the IOTA price has been trading inside a descending channel.
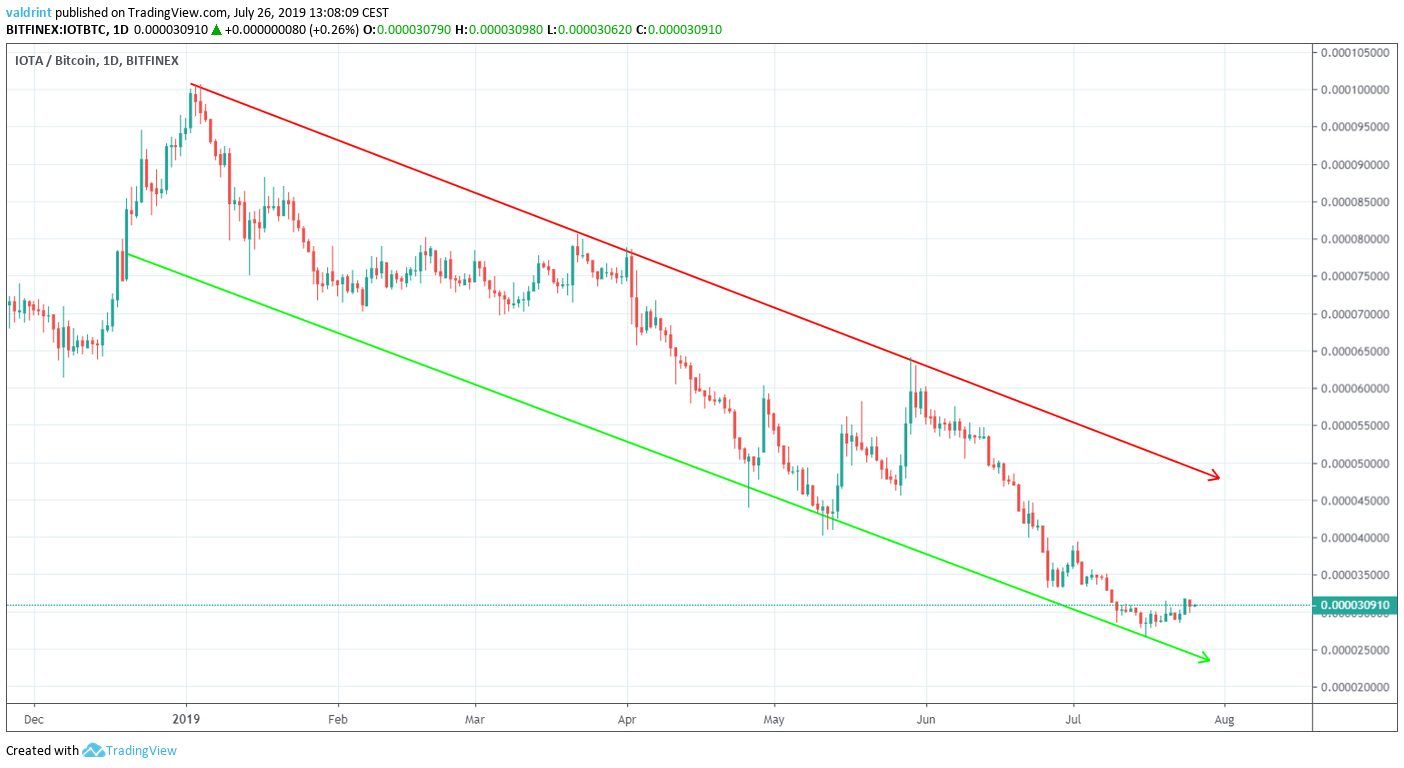
After trading very close to the support line throughout July, it seems as if IOTA has finally begun an upward move towards resistance.
This view is supported by the moving averages and the prices’ relationship with them.
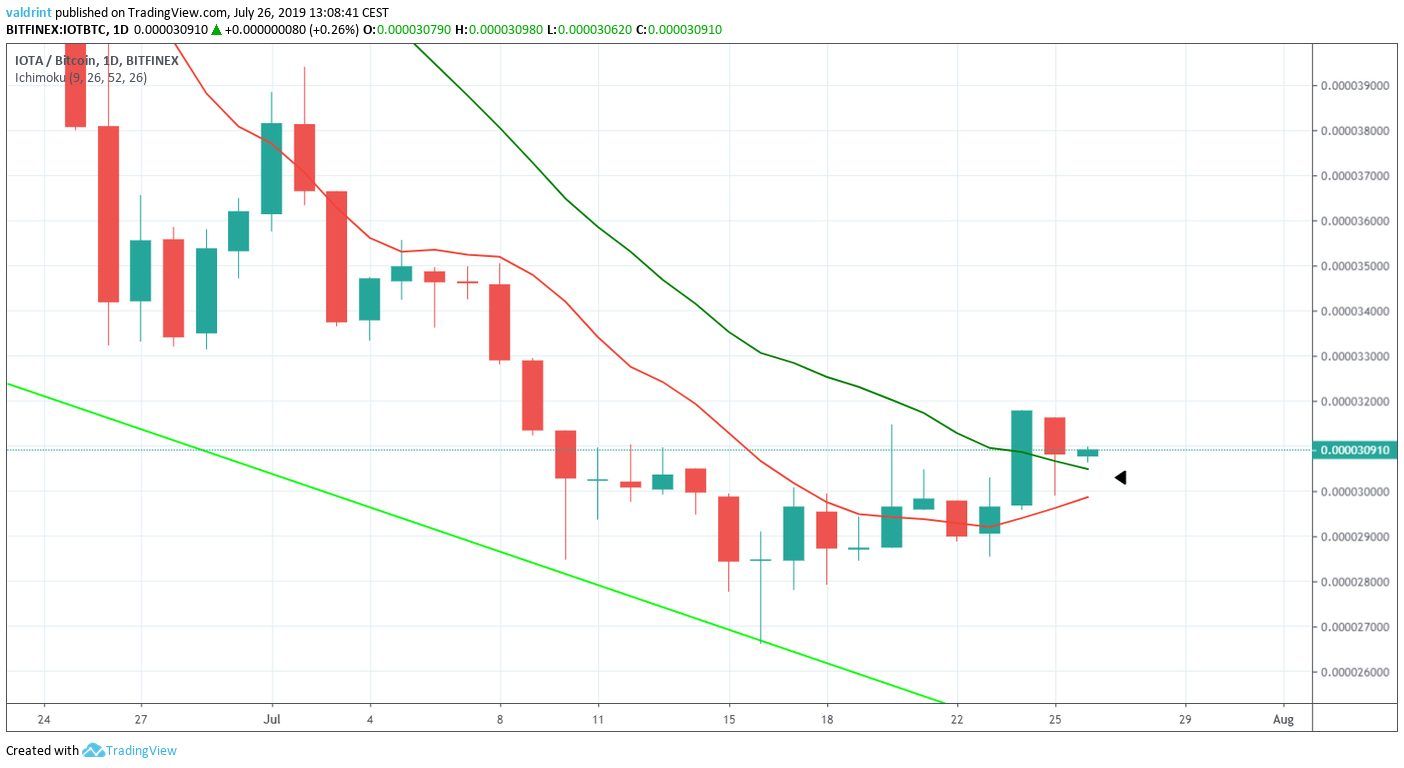
The most recent increase took the price above both the 10- and the 20-day moving averages.
Additionally, they are very close to making a bullish cross.
If that happens, it would serve as confirmation that an uptrend has begun.
A closer look at the daily candlesticks shows that the price has cleared a very significant resistance area.
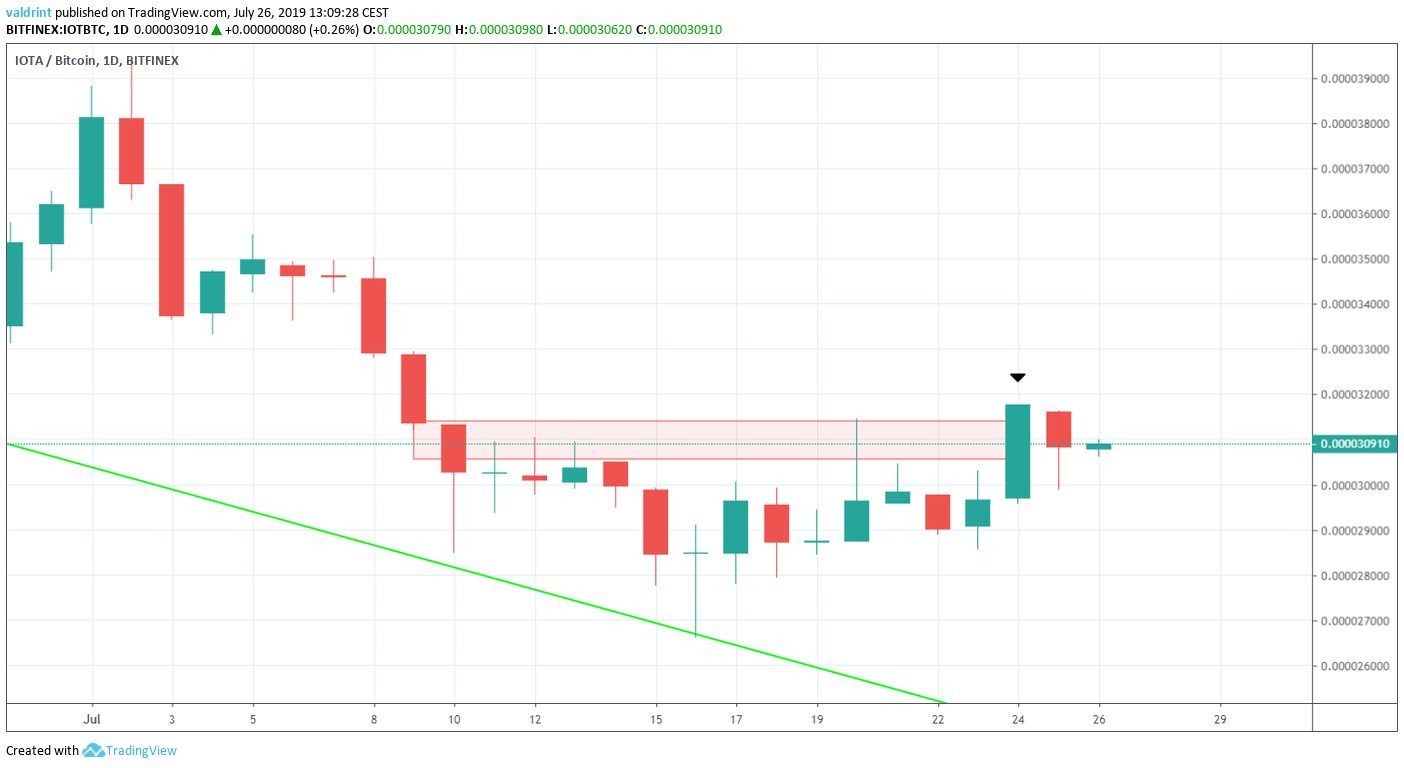
The 31,000 satoshi level has acted as resistance since July 10.
Once the price reached this area, it immediately decreased.
This was especially evident in the candlestick for July 20.
However, on July 24, the price broke out above this area and reached a daily close of 31,170.
This is a sign that the selling pressure has dissipated.
The use of these indicators suggests that IOTA is likely to continue increasing.
Summary
The IOTA price is trading inside a short-term ascending channel and a long-term descending one.
According to our analysis, it is likely to move towards the resistance line of the long-term channel.
Do you think IOTA will continue to increase? Let us know in the comments below.
Disclaimer: This article is not trading advice and should not be construed as such. Always consult a trained financial professional before investing in cryptocurrencies, as the market is particularly volatile.
Images are courtesy of Shutterstock, TradingView.
