
On January 14, the IOTA price broke out above a descending resistance line in place for 82 days. Since then, it has increased by nearly 30 percent.
The movement could have been the first step in the creation of a long-term reversal pattern, which would be confirmed by a breakout over 2500 satoshis.
Trader @devchart tweeted an IOTA price chart stating that the price has broken out above resistance and is currently trying to find support. In addition, he is giving a target of 3200 satoshis for the ensuing upward move, which is roughly 15 percent above the current price.
https://twitter.com/devchart/status/1219223393754583040?s=19
Will the IOTA price reach the target? Let’s take a closer look at the price movement and determine if it will.
Resistance Breakout
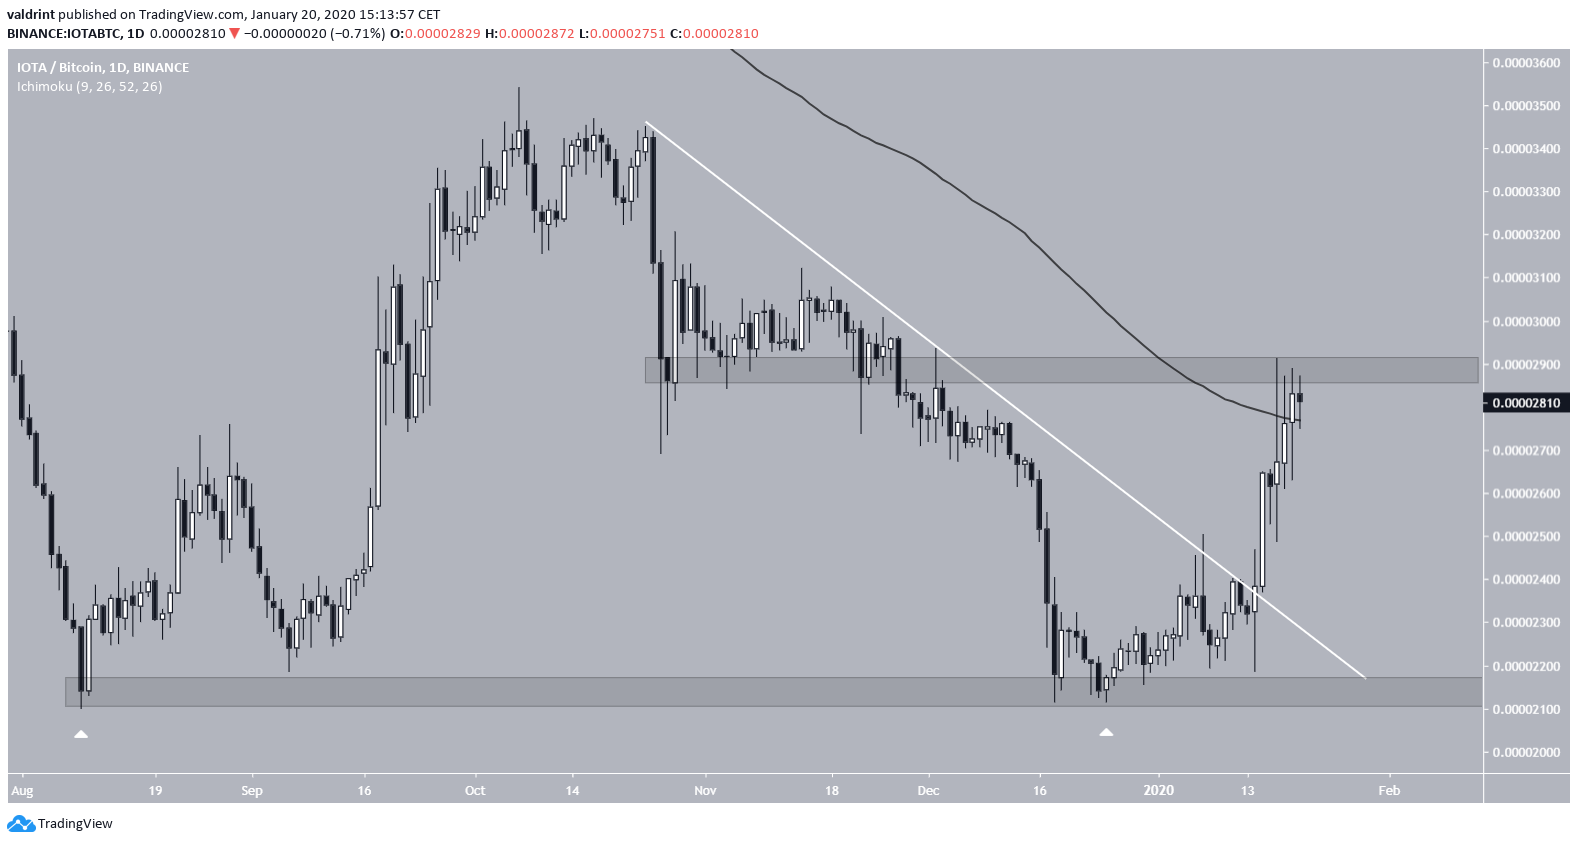
The IOTA price had been following a descending resistance line since October 23, 2019. On January 14, the price broke out above this resistance line.
The breakout was initiated after the successful double bottom reached on August 9 and December 25, inside the strong support area of 2100 satoshis. We successfully predicted this breakout in our previous analysis.
Afterwards, the price continued to increase until it found resistance at 2900 satoshis, near the current trading level. Finally, the price has moved above its 200-day moving average (MA) and is seemingly using it as support.
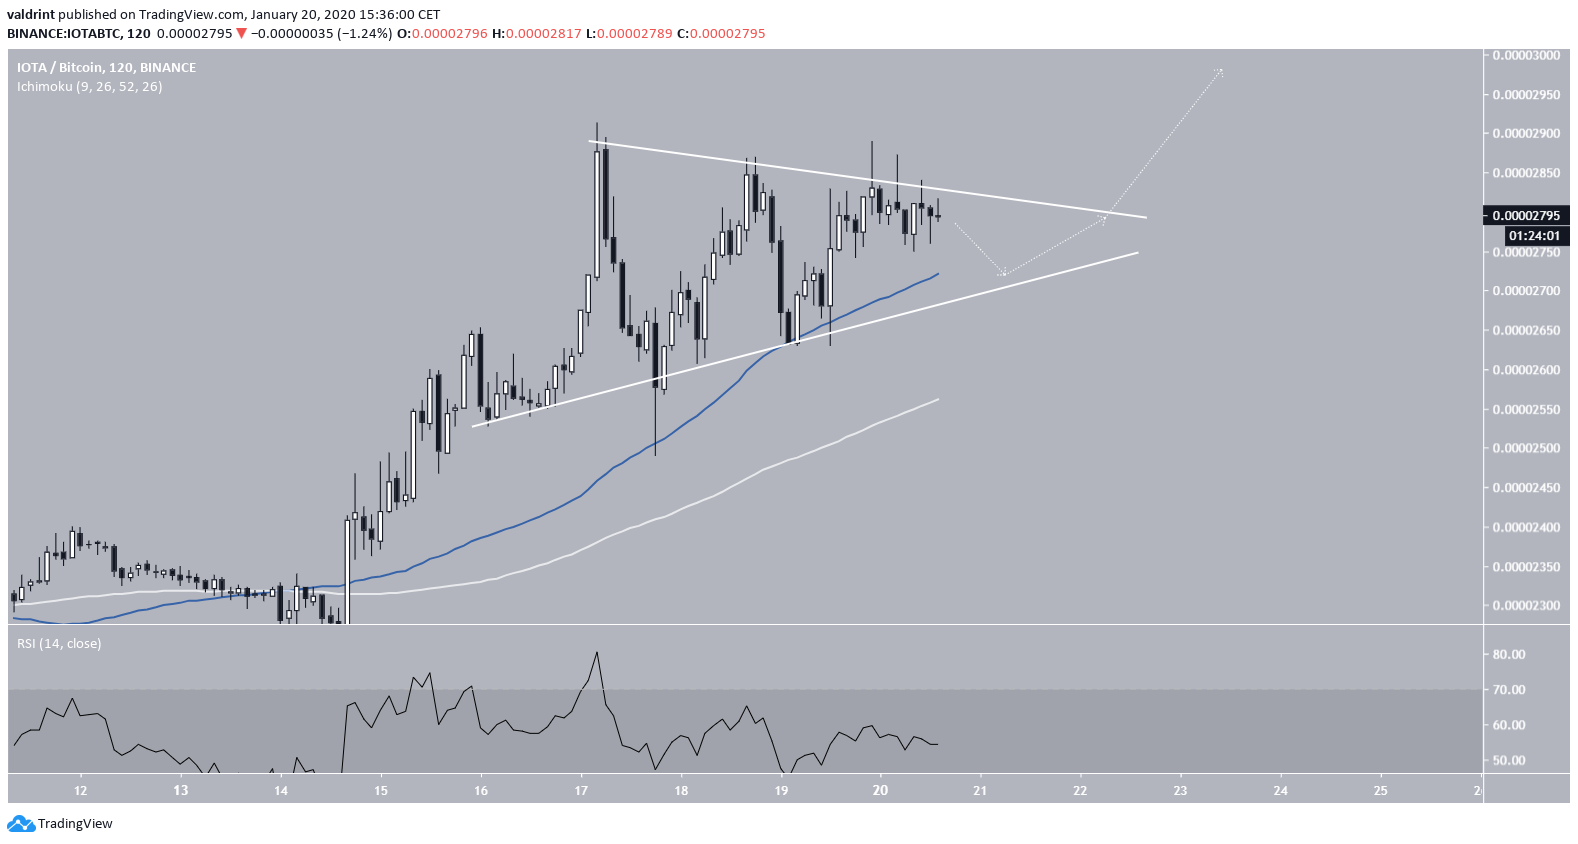
In the short-term, IOTA seems to have created a symmetrical triangle, which is considered a continuation pattern. Since it is transpiring after an upward move, a breakout would be the common successive movement.
In addition, the price has found support above the 50-hour moving average (MA), supporting the possibility of a breakout. Finally, there is no bearish divergence in the RSI, even in very short time-frames, which would cast some doubt in the possibility of a breakout.
IOTA in the Long-Term
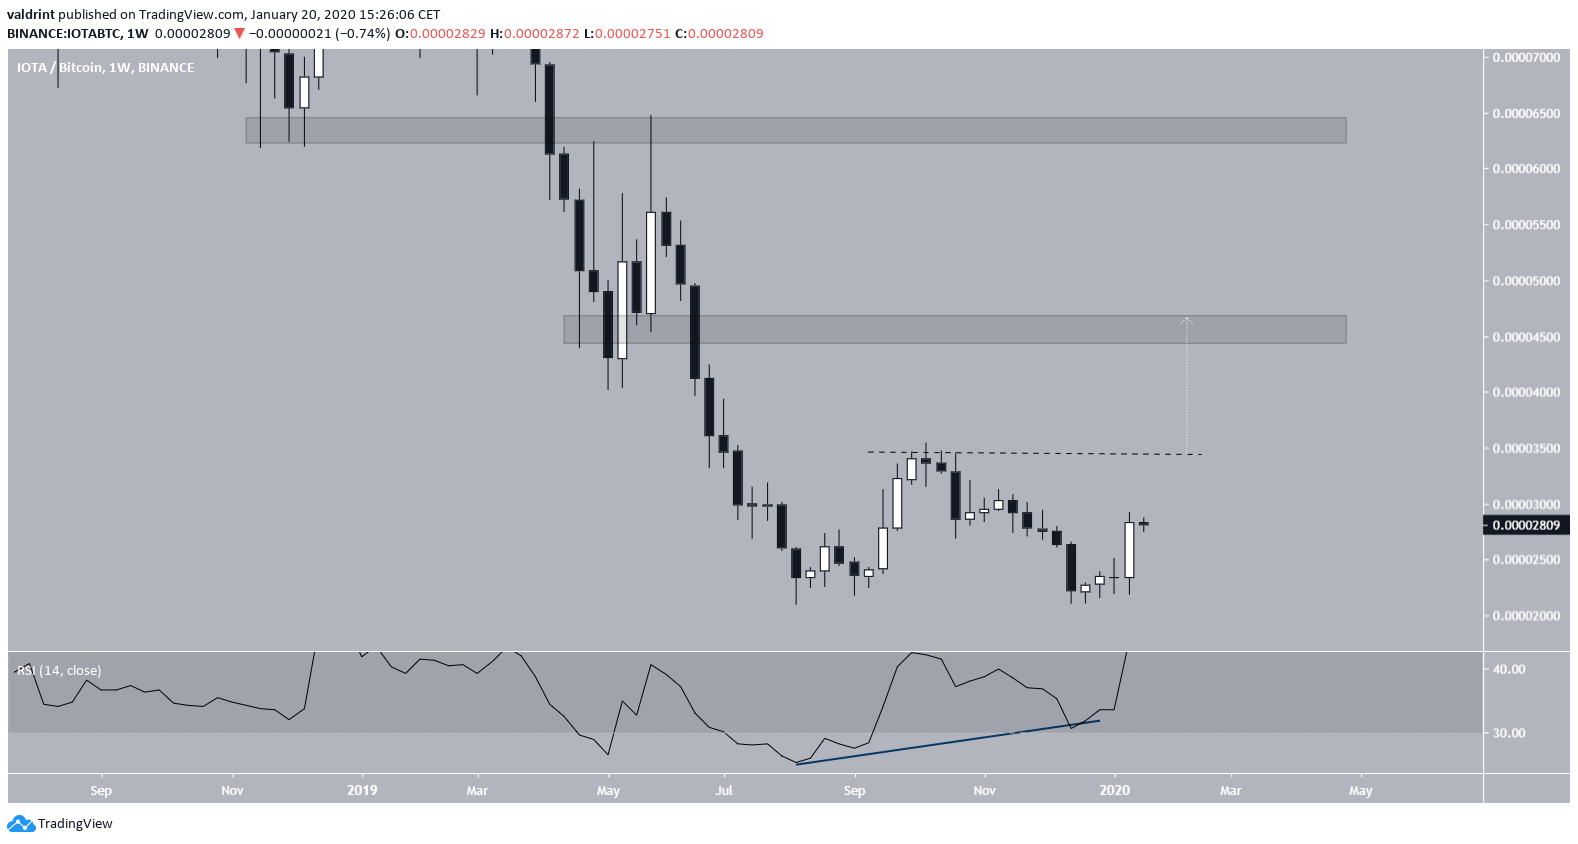
The long-term outlook is quite bullish. The aforementioned double bottom was combined with bullish divergence in the weekly RSI, which was deep into oversold levels the entire duration of the pattern. This is the lowest RSI value ever recorded.
The first peak between the lows is found at 3500 satoshis. A movement above it would likely cause the price to head towards the major resistance areas at 4600 and 6400 satoshis.
The breakout from the aforementioned short-term triangle is likely to take the price to the peak high at 3500 satoshis, thus reaching the target outlined in the tweet.
At the current time, a continuing upward move seems likely due to the long-term bullishness. However, the presence of reversal signs at the 3500 level will determine whether the price will continue towards the next targets.
To conclude, the IOTA price has created a long-term bullish reversal pattern. The January 14 breakout was the first step in this possible reversal. We believe the price will reach a high of at least 4600 satoshis, with 3500 sats being the short-term target.
