


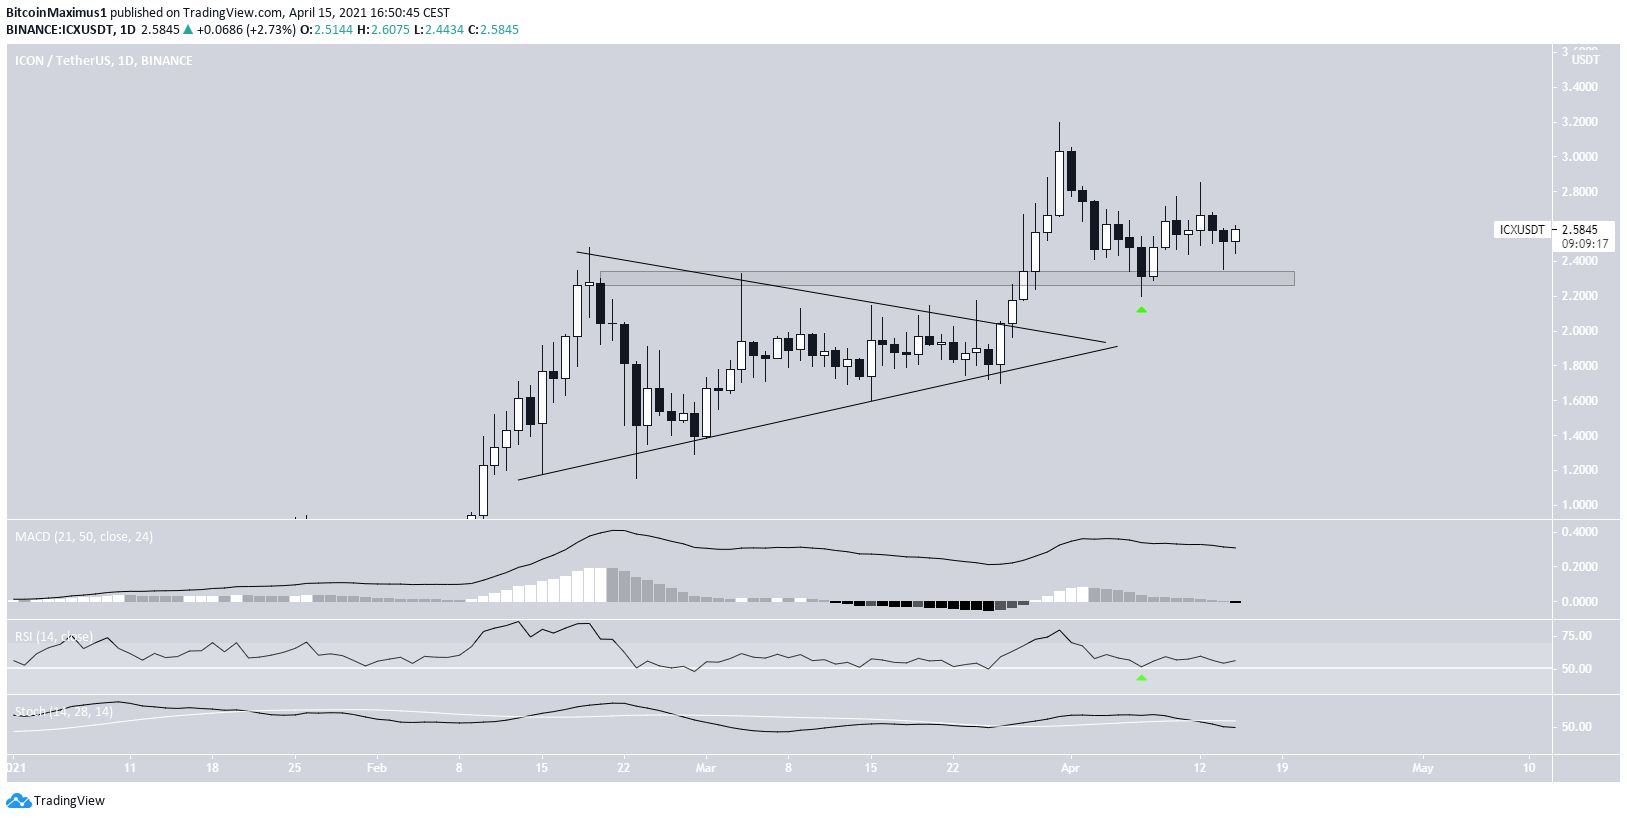
The Icon (ICX) price has been decreasing since reaching a high on March 31.
Despite the drop, ICX has validated the previous breakout level as support. As long as it is trading above it, the trend is considered bullish.
Ongoing ICX breakout
On March 28, ICX managed to break out from a symmetrical triangle that had been in place since Feb. 16. This led to a high of $3.20 being reached on March 31.
Afterwards, the ensuing drop took the token back to the $2.30 area, which it validated as support.
Despite the ongoing bounce, technical indicators are neutral.
While the RSI has also bounced at the 50 line, the MACD has crossed into negative territory. Furthermore, the Stochastic oscillator has made a bearish cross.
Therefore, while the price action looks bullish, technical indicators fail to confirm the bullish trend.
Wave count
Cryptocurrency trader @Mesawine1 outlined an ICX chart which shows a bullish count. He stated the possibility that the price could go all the way to $9.
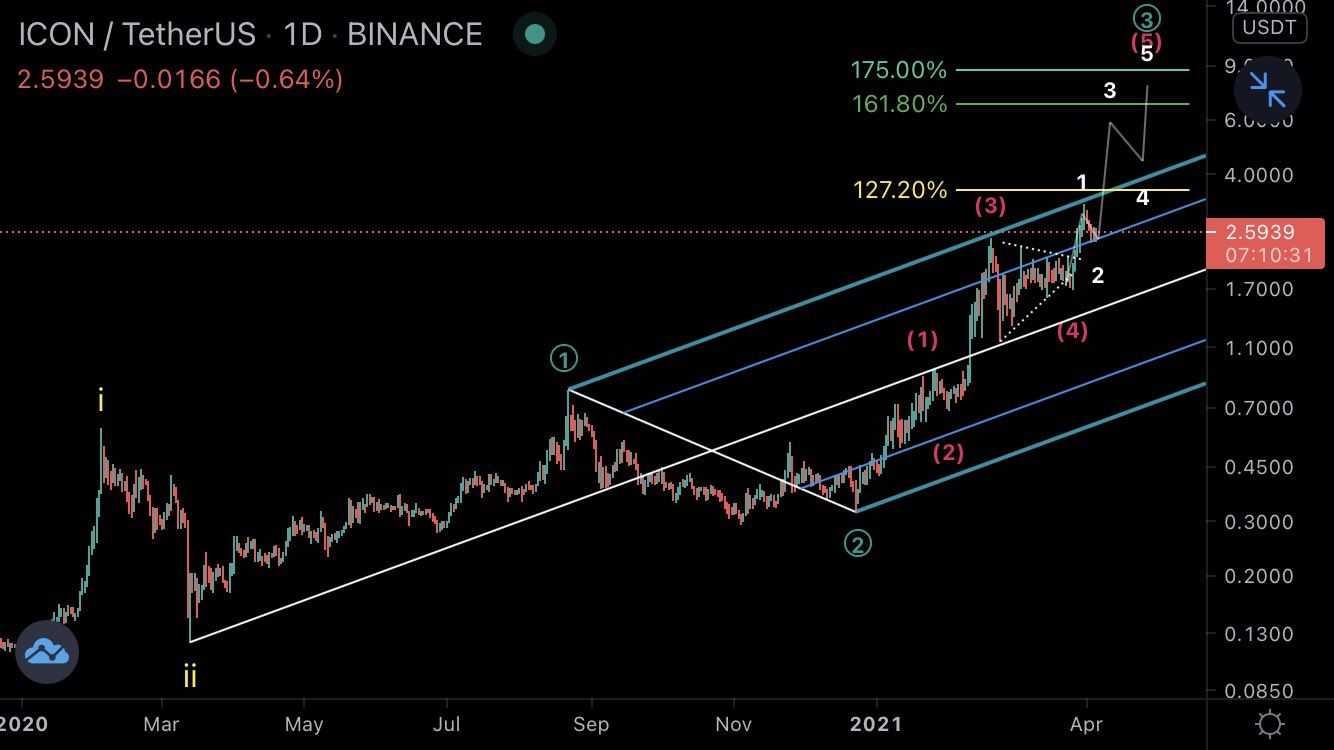
The wave count is indeed bullish.
ICX seems to be in a long-term wave three (white), which began in March 2020.
The sub-wave count is given in orange. It suggests that the previously outlined breakout was the end of sub-wave four (orange).
Therefore, the token is now in what is likely sub-wave five. A potential target for the top of the movement is located at $4.30.
The target is found by projecting the length of sub-waves 1-3 to the bottom of wave four (orange). In addition, an external Fib retracement is used (black).
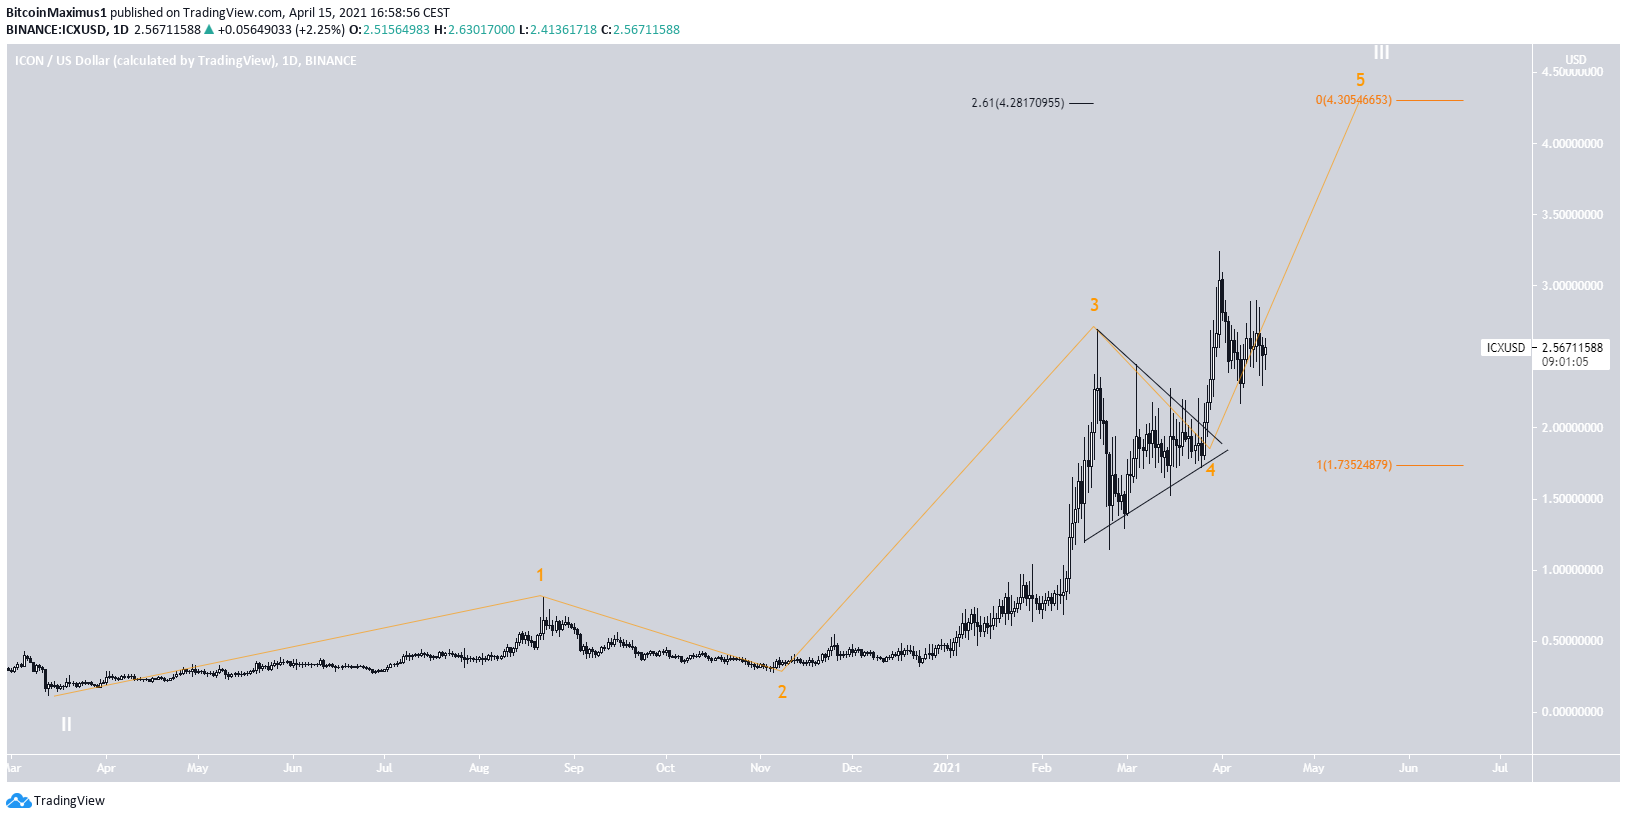
Conclusion
To conclude, the ambiguity from technical indicators fails to confirm the direction of the trend.
However, both the price action and the wave count seem bullish. Therefore, the most likely path suggests that ICX is likely to move towards $4.30.
For BeInCrypto’s latest bitcoin (BTC) analysis, click here.


