
The Icon (ICX) price has broken out from a bullish pattern that had been in place since the yearly high reached on Aug 22.
The price should move upwards towards the levels outlined below.
Wedge Breakout
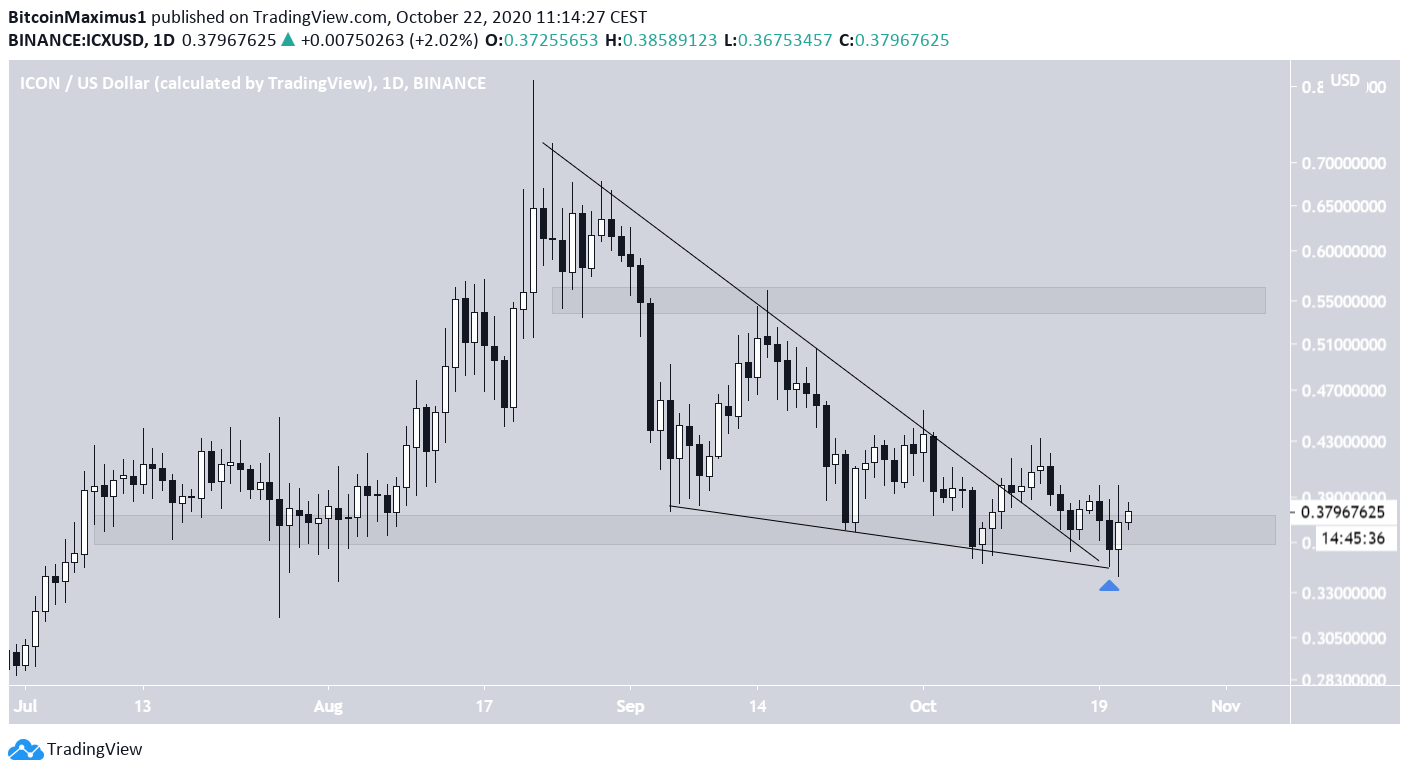
The ICX price reached a high of $0.809 on Aug 22 but has been falling since, moving inside a descending wedge, which is a bullish reversal pattern.
On Oct 7, the price reached the $0.365 area, validating it as support once more, and proceeded to break out from the wedge a couple of days later. Afterward, the price declined again and validated both the wedge and support area.
If the price begins moving upwards, the closest resistance area can be found at $0.555.
Potential Rally
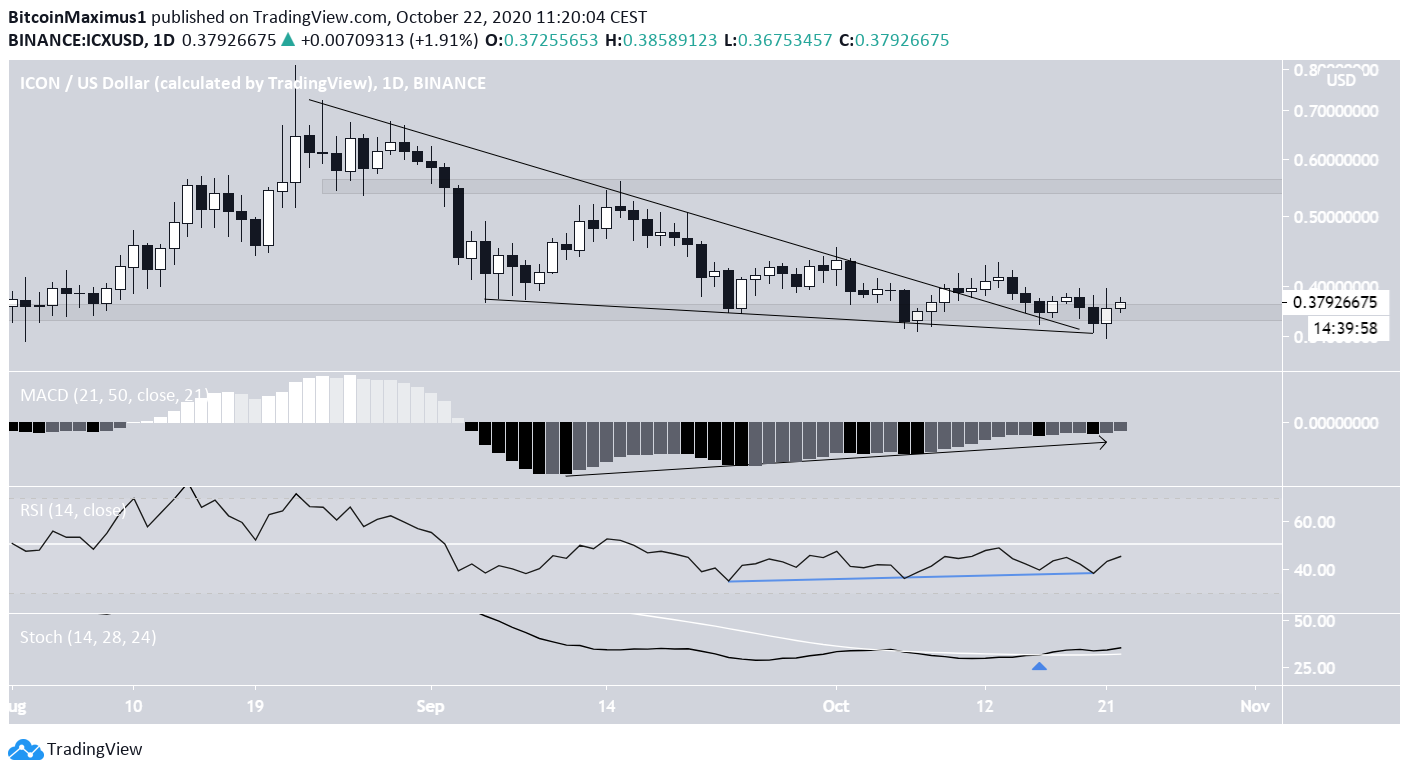
Technical indicators on the daily time-frame are bullish. Both the MACD and the RSI have formed bullish divergence and are moving upwards, though the former is still negative and the latter is below 50.
The Stochastic Oscillator has made a bullish cross, a sign that the price will likely move upwards.
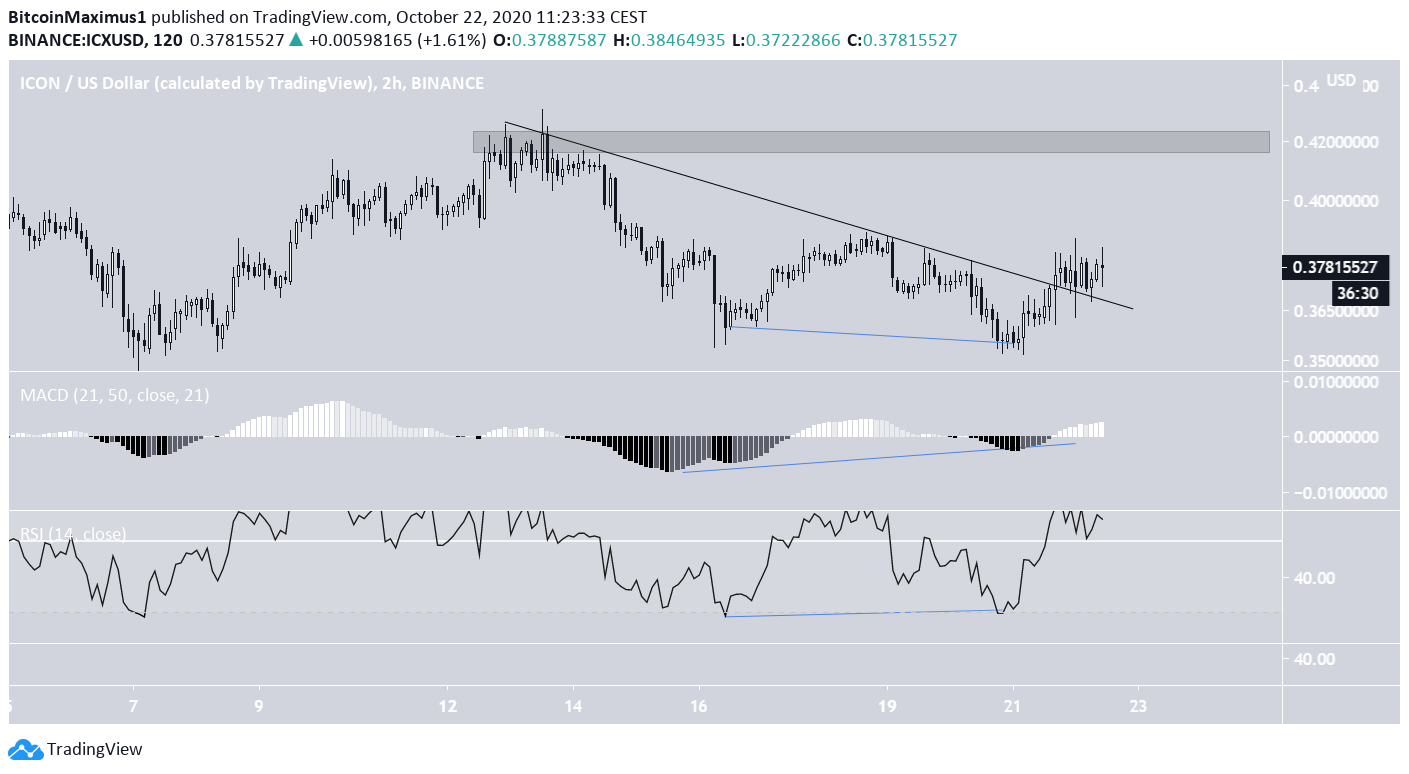
The short-term chart shows a possible double bottom, which is combined with bullish divergence on both the RSI and the MACD. After the completion of this pattern, the price broke out from a descending resistance line and validated it as support afterward.
Therefore, the price should move upwards towards the previously mentioned resistance area, first facing minor resistance at $0.42.
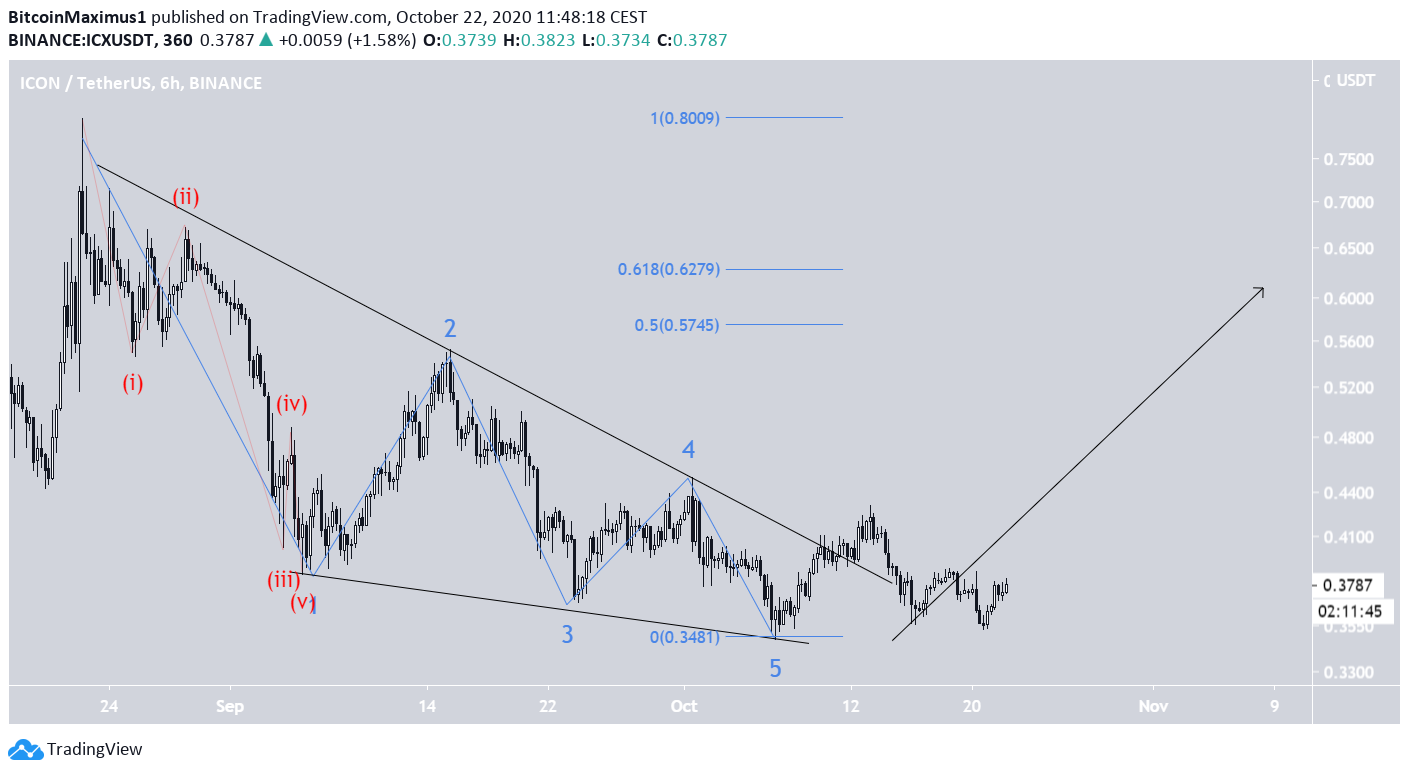
Wave Count
Cryptocurrency trader @Thetradinghubb outlined an ICX chart which shows a completed correction, and a possibility of the price heading all the way to $0.90.
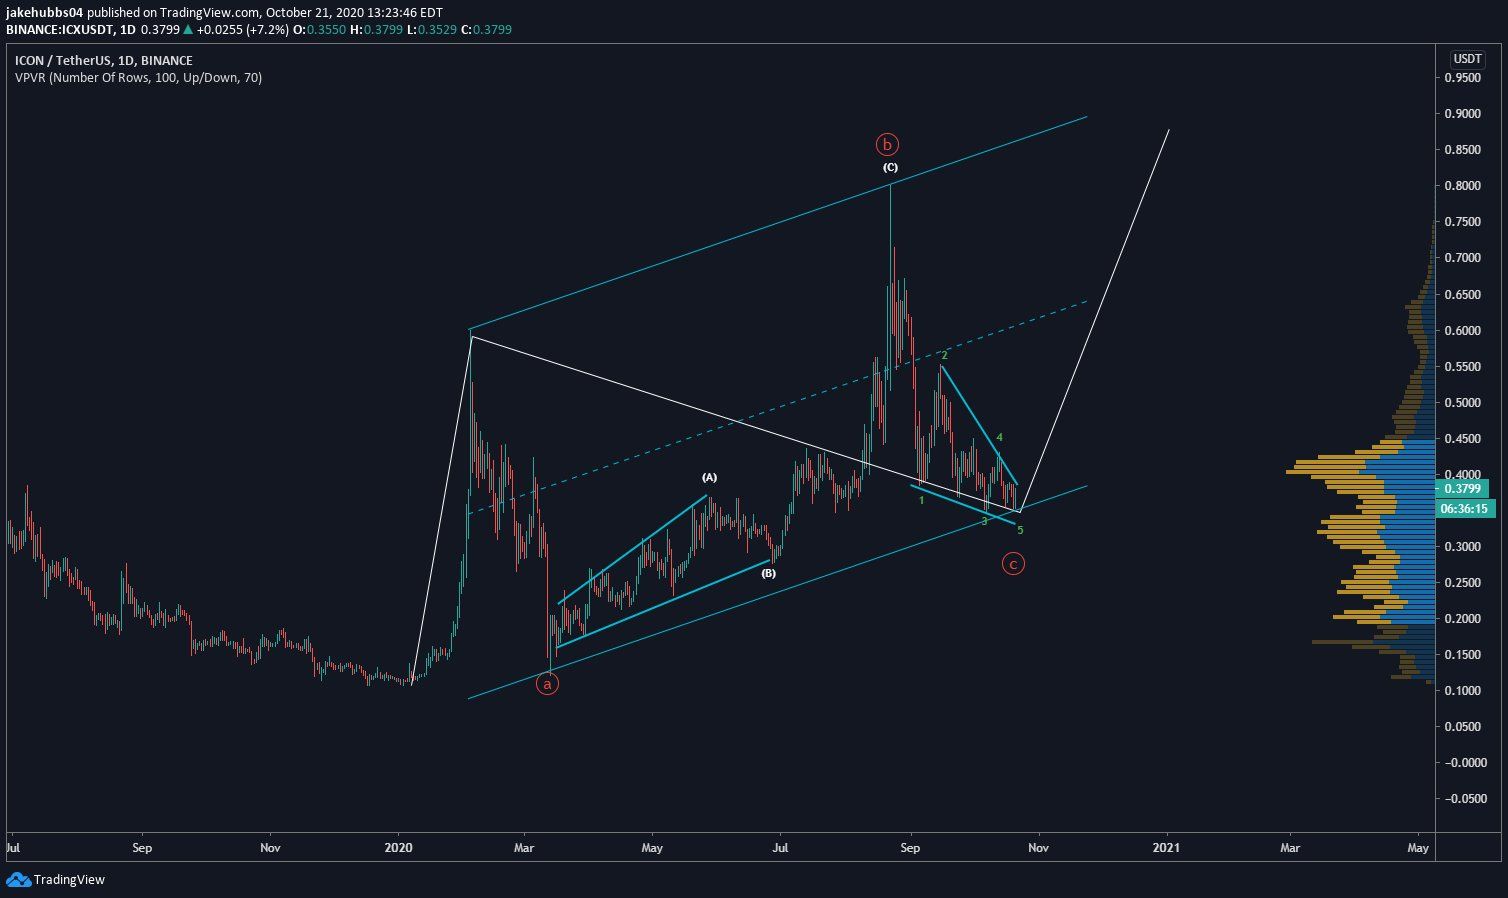
Since the previous Aug 25 high, it does seem like ICX has completed a bearish impulse, which could be a leading or ending diagonal, depending on if it’s an A or C wave, or the beginning of a new bearish impulse.
However, all possibilities would suggest another rally after the impulse is completed.
The initial target would be between the 0.5 – 0.618 Fib levels at $0.575 – $0.627, the former coinciding with the previously mentioned resistance area.
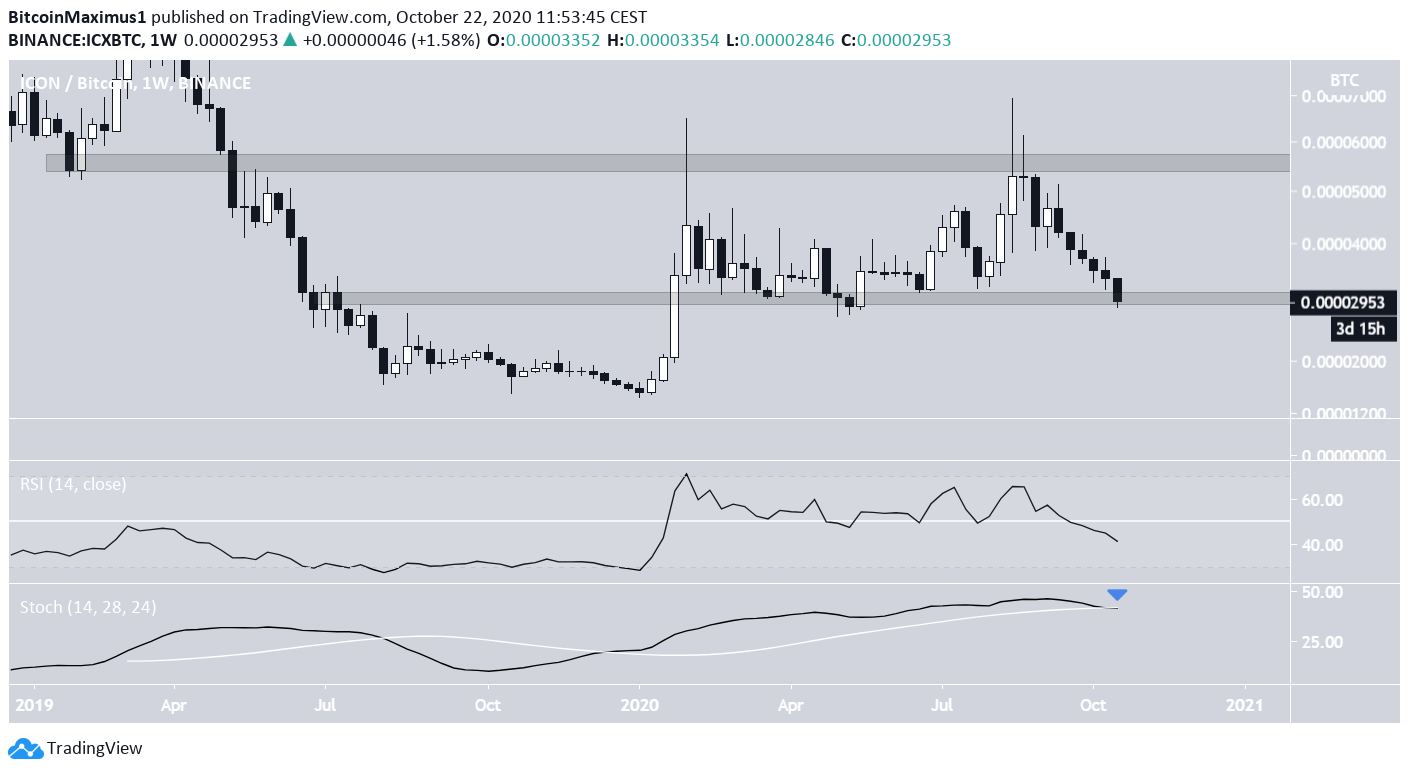
ICX/BTC
The ICX/BTC chart shows that the price has been clearly rejected from the 5400 satoshi resistance area, leaving a long upper wick in its wake.
The price has been falling since and has now reached the 2950 satoshi support area, a breakdown below which would be a major bearish development.
Currently, there are no signs that the price will move upwards since the RSI has fallen below 50 and the Stochastic Oscillator has made a bearish cross.
While it’s possible that the price will continue ranging between these two levels, a breakdown could trigger a sharp drop.
For BeInCrypto’s previous Bitcoin analysis, click here!
Disclaimer: Cryptocurrency trading carries a high level of risk and may not be suitable for all investors. The views expressed in this article do not reflect those of BeInCrypto.
