
The ICX price has been increasing rapidly since Jan 16. While the upward move has yet to show any significant weakness, the price has reached some very suitable reversal levels. Reaching a high of 4,000 satoshis seems within its capabilities.
ICX Highlights
- There is resistance at 5,500 satoshis.
- The rate of increase has become parabolic.
- A golden cross about to transpire.
- There is support at 2,900 satoshis.
Price action trader @PostyXBT outlined an ICX price chart stating that the price still has about 50% to go until it reached the previous breakdown level, which is likely to provide significant resistance.
$ICX Weekly
Price has another 50% to go until it reaches any significant level of resistance *this is not a buy signal*
Healthy correction would be ideal. 3k sats is what I would look for.
However, FOMO doesn't always want to see healthy corrections… pic.twitter.com/HcWjmdGv9F
— Posty (@PostyXBT) February 3, 2020
ICX Weekly Outlook
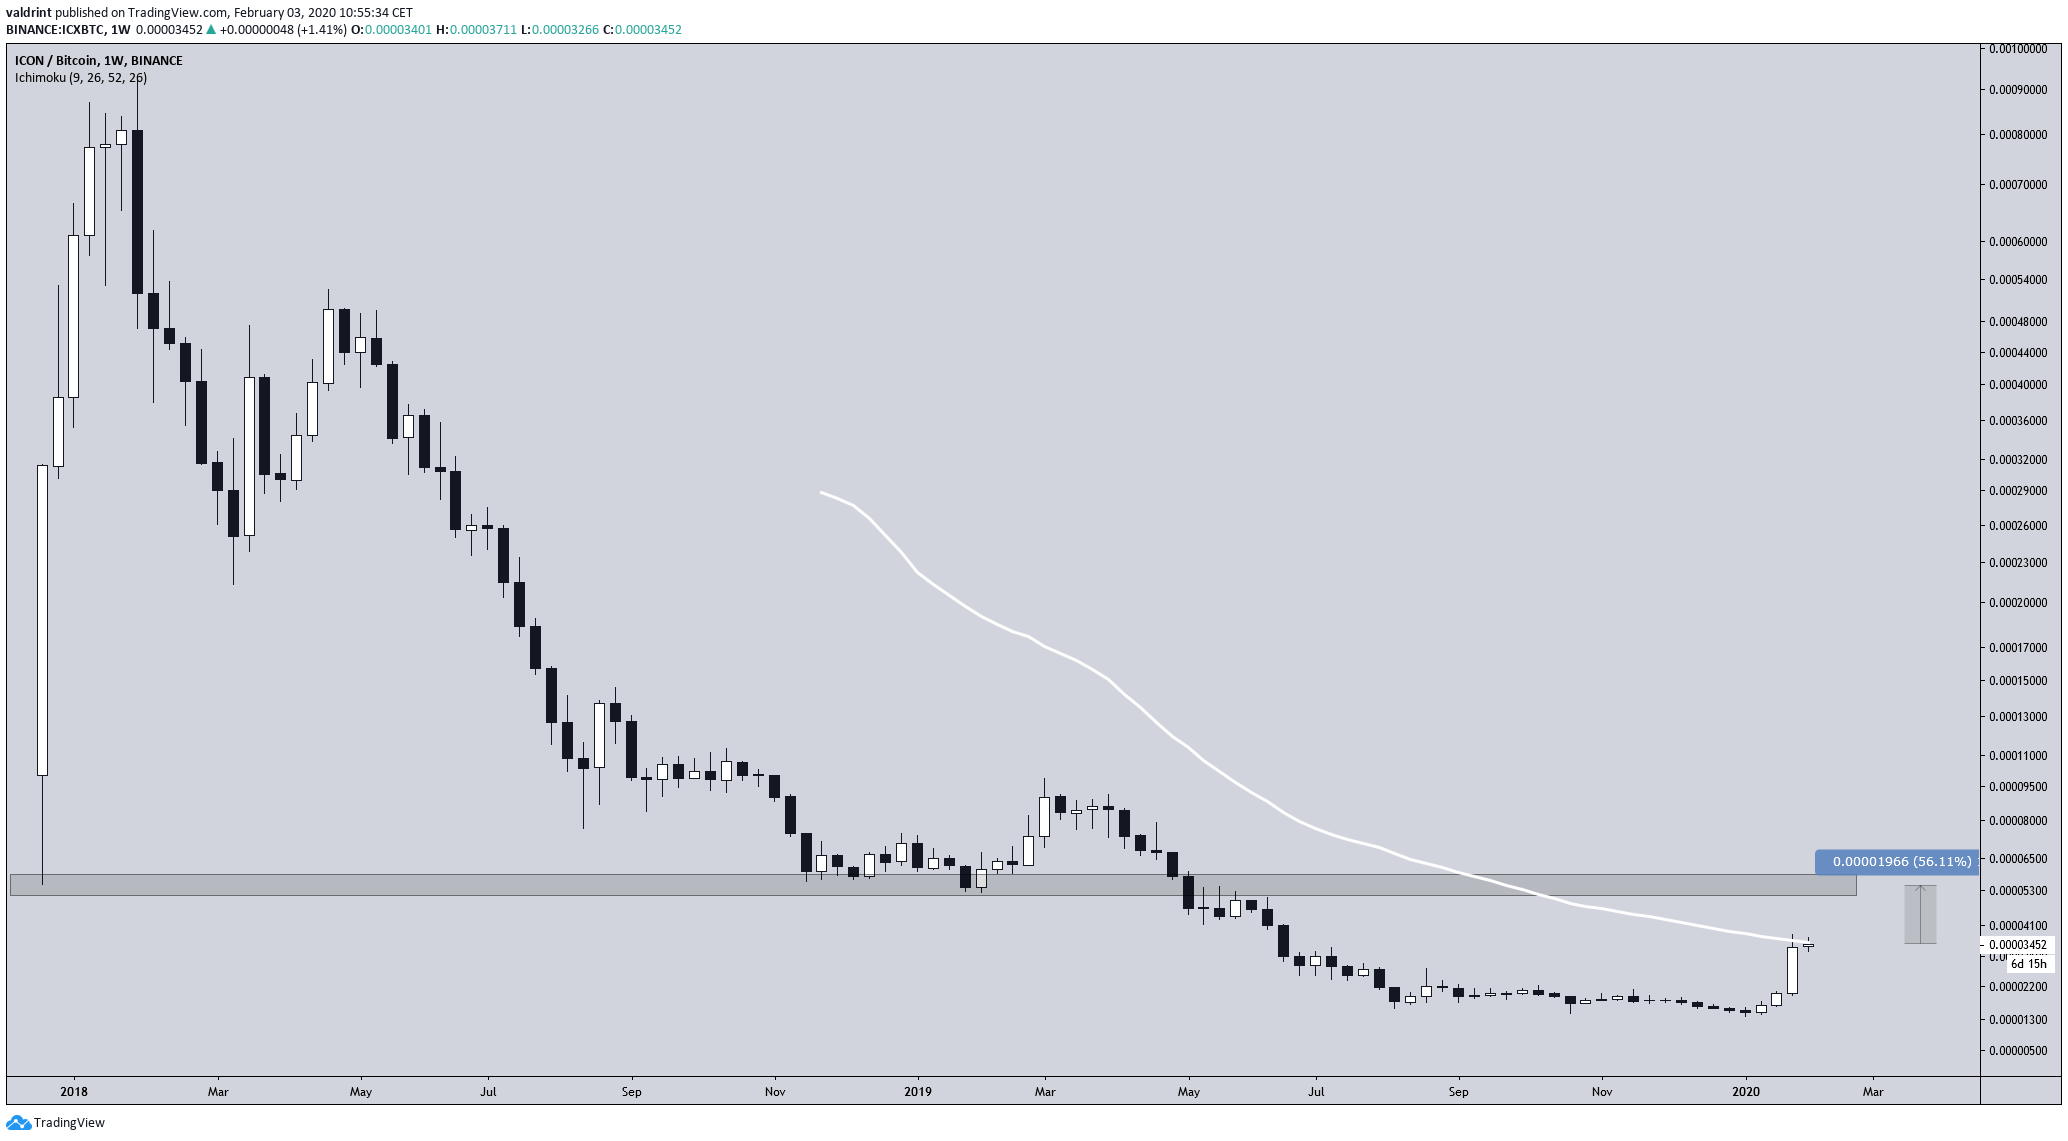
The main resistance area is found at 5,500 satoshis, the level from which the price broke down at the beginning of May 2019. Measuring from the current level, this resistance area is 56% away from the current price of 3,500 satoshis.
The ICX price has just reached the 50-week moving average (MA) and has been unsuccessful in moving above it.
Previous Breakout
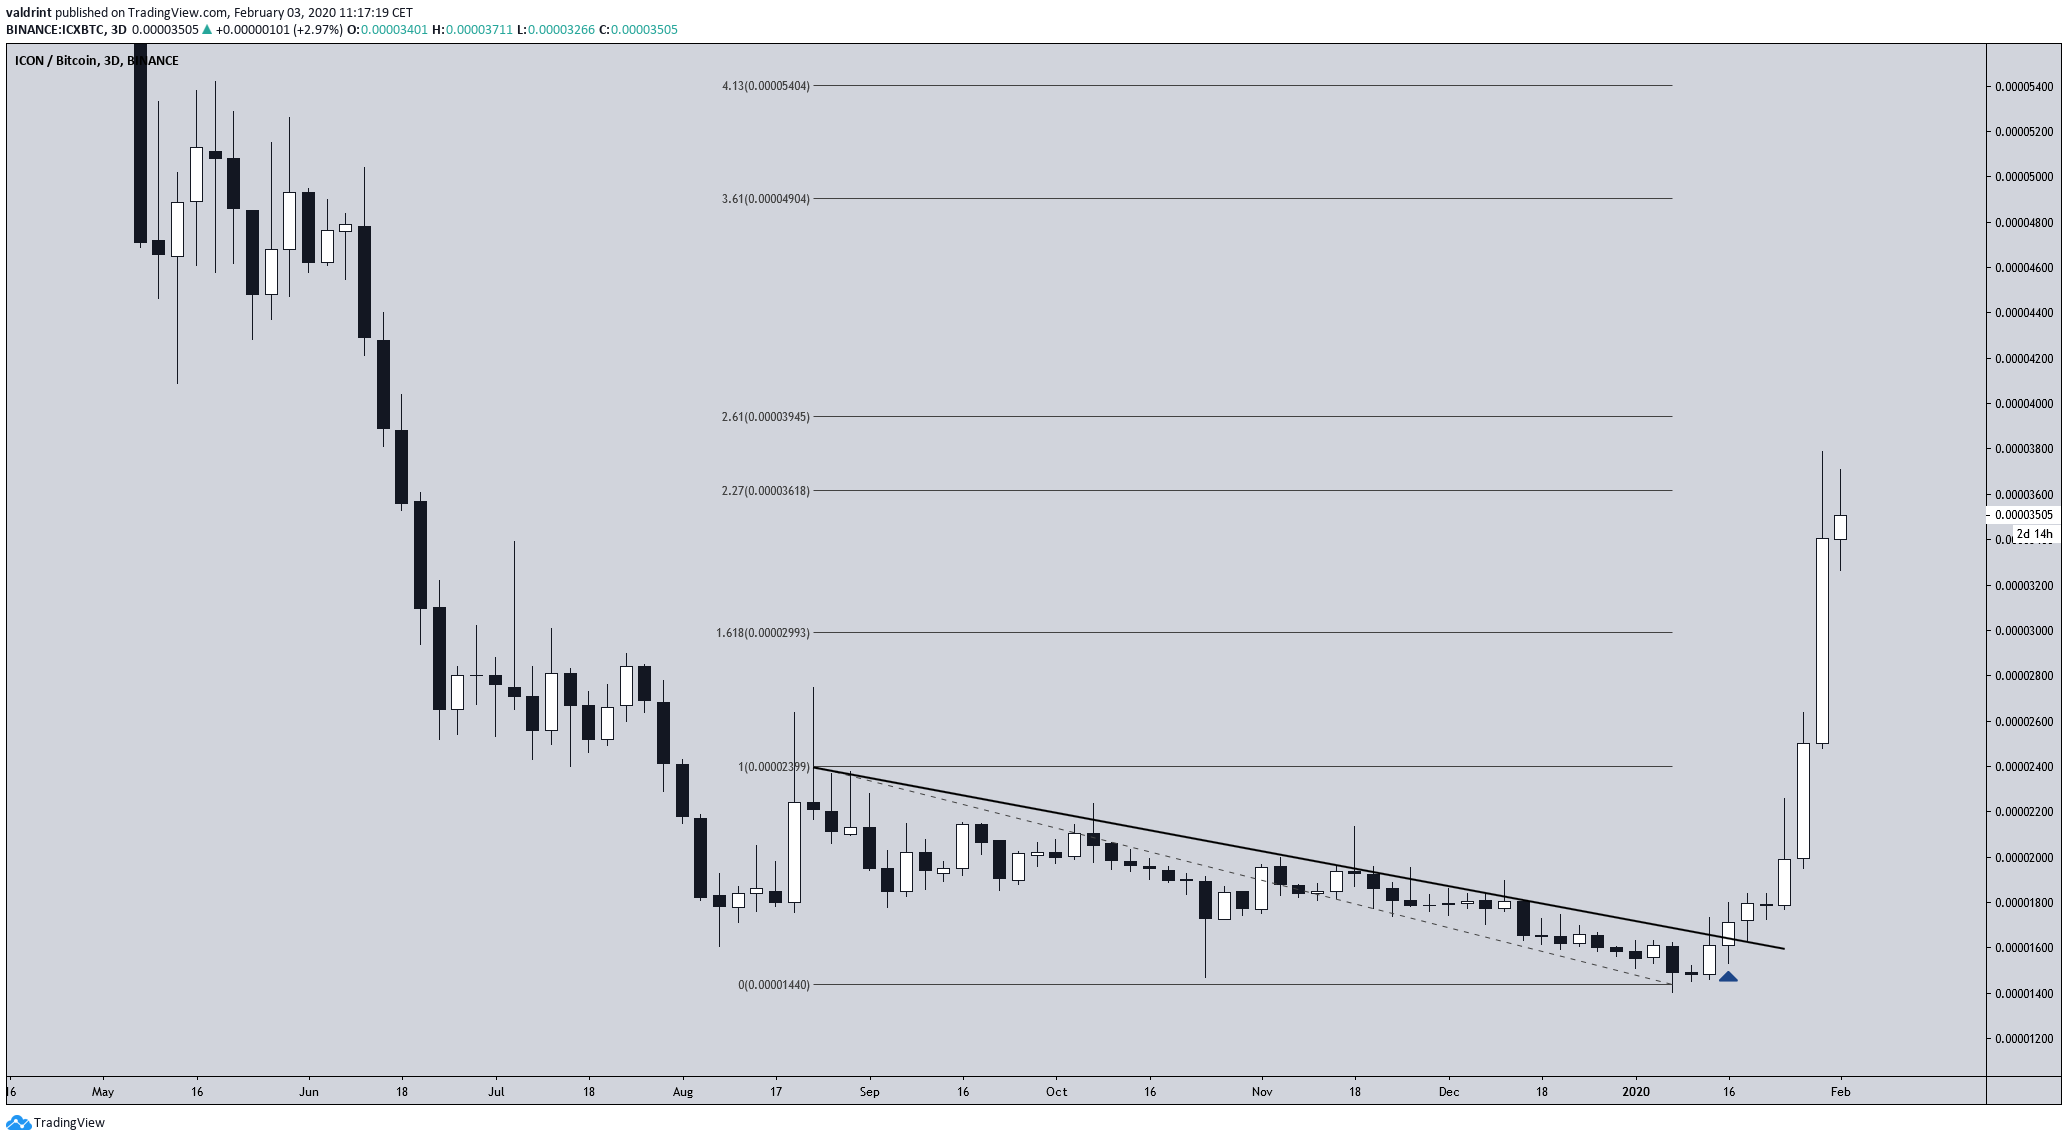
On Jan 16, the ICX price broke out above a long-term descending resistance line. The ensuing increase took out several important resistance levels without experiencing any type of retracement.
Using a fib retracement tool on the descending resistance line, we can see that the price has reached a significant fib level, This is a possible area to watch for the top of the movement, along with the 2.61 fib level at 4,000 satoshis.
However, except for some resistance at 4,900 satoshis, the road upwards until 5,500 satoshis seems probable.
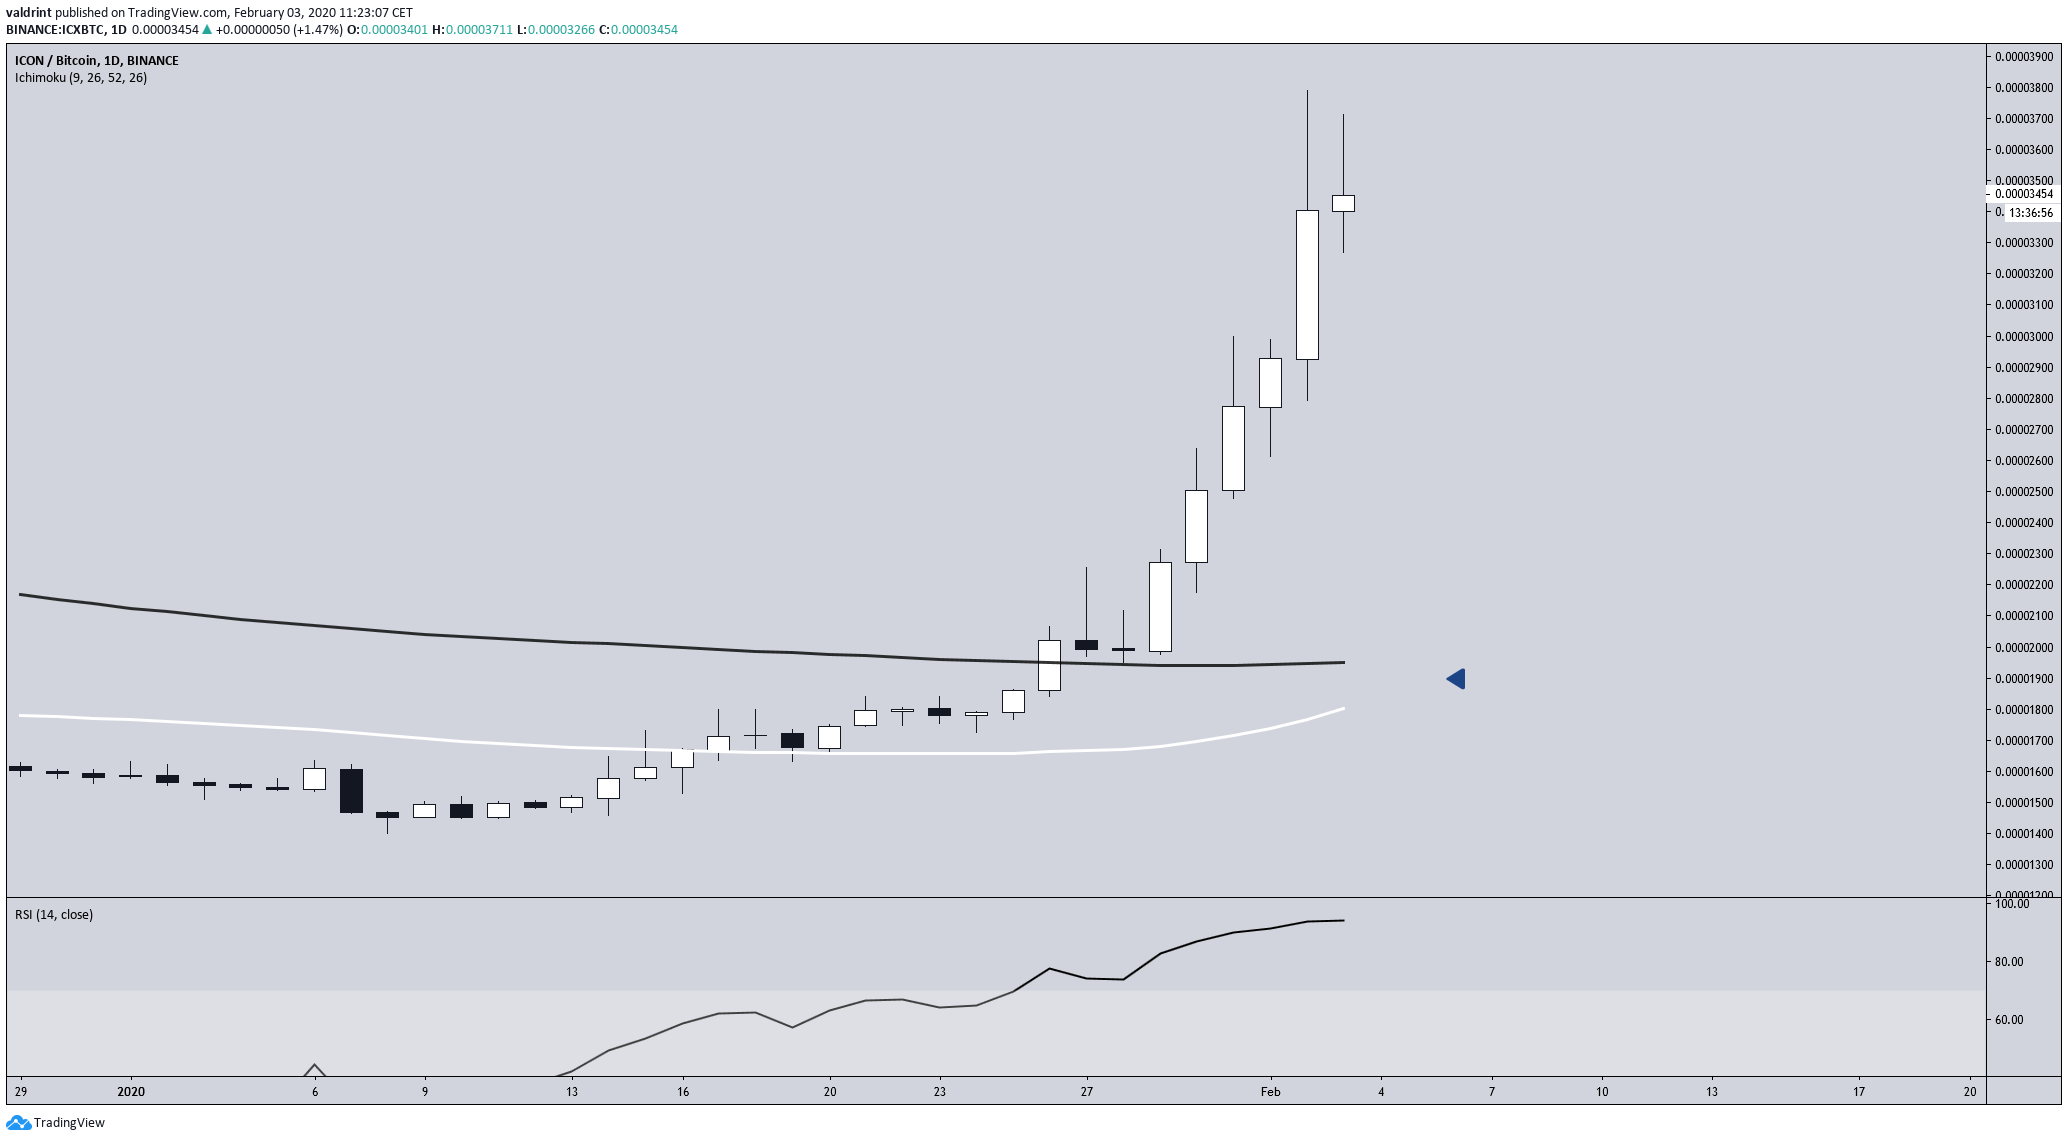
The daily chart reveals a possible ‘golden cross’ — a bullish cross of the 50 and 200-day moving averages (MA).
While the daily RSI is in overbought territory, it has not yet begun to generate bearish divergence yet. The two long upper wicks are the only clear bearish indication.
Future Movement
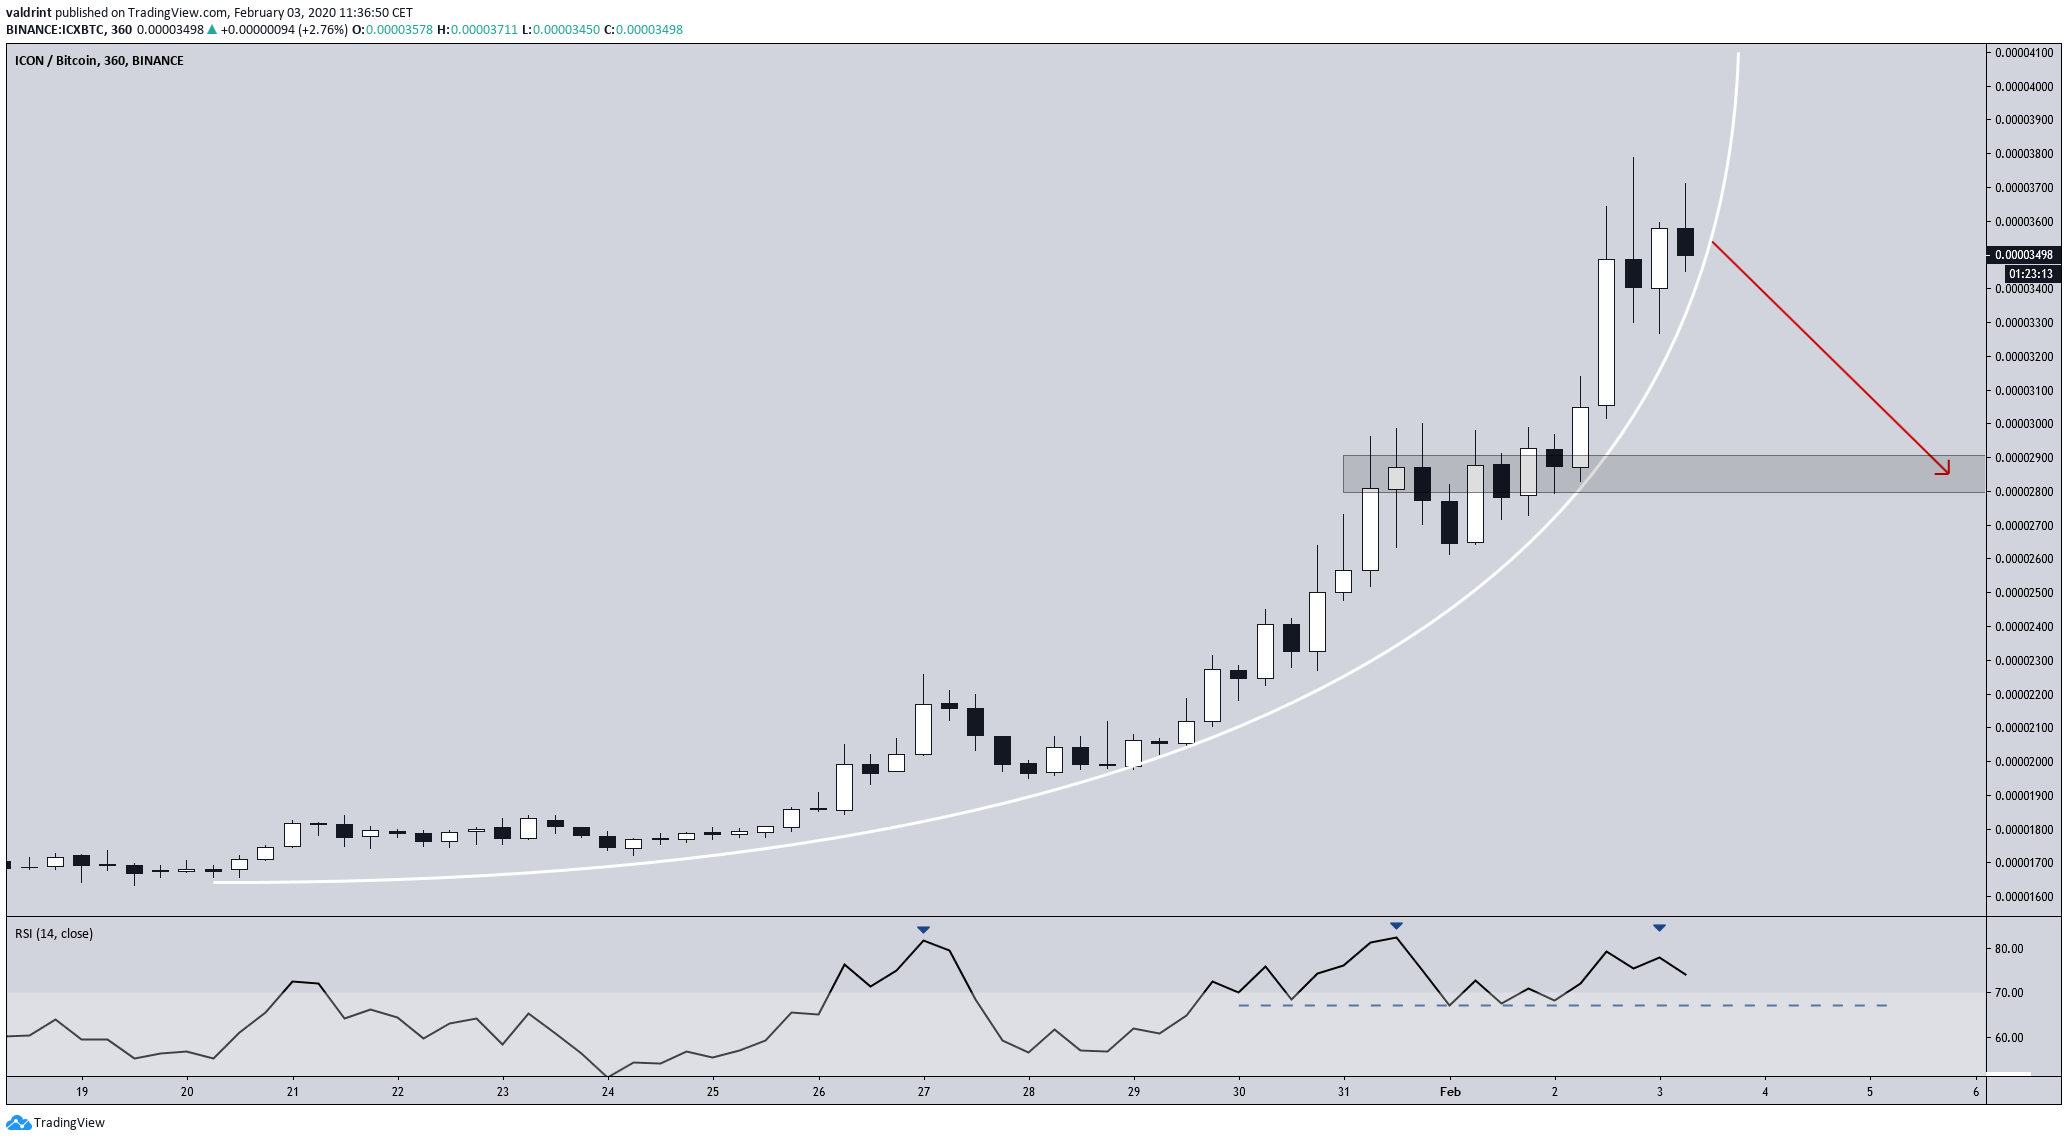
The ICX movement has become completely parabolic since Jan 16.
The price is currently at this parabolic support line. While another final push to 4,000 satoshis looks possible, the support line has almost become vertical, and a breakdown seems inevitable.
In addition, the price has struggled to move upward, visible by long upper wicks.
Finally, the RSI has generated a triple top. However, as long as it is above the dashed line of the valleys at 65, it can be assumed that the trend is still intact. A breakdown from the support line would likely cause an RSI decrease below this line.
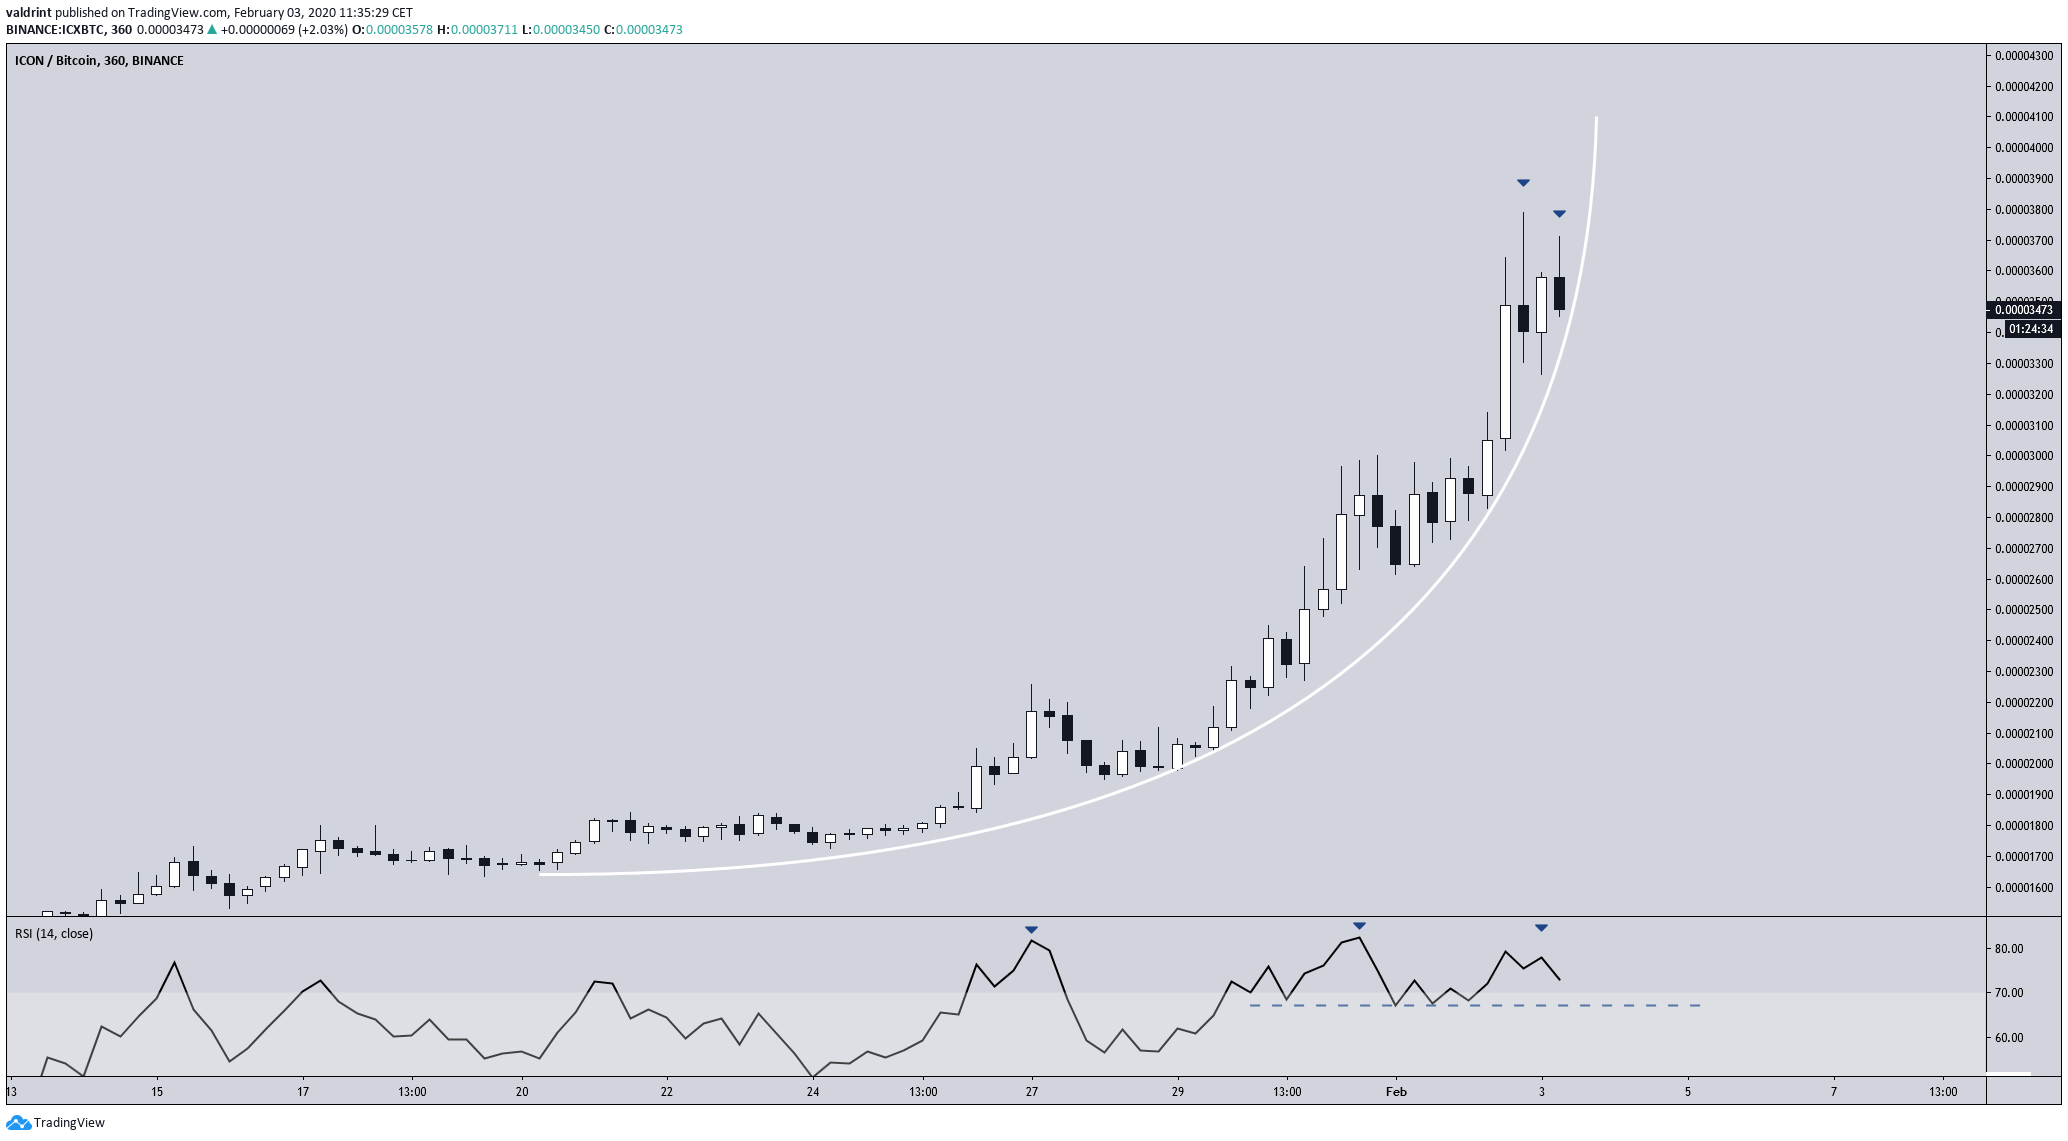
While one final push to 4,000 satoshis could occur prior, the price seems like it will inevitably retrace back to 2,900 sats.
To conclude, the ICX price has been increasing at a parabolic rate since Jan 16. While 4,000 satoshis is within reach, it would be healthy for the current price movement if it were to retrace before continuing upward. It is probable that the current move up is nearing its end.
