


The Elrond (EGLD) price has created a long-term bullish pattern but is trading inside a short-term bearish pattern. The direction of the trend could be determined by which pattern is resolved first.
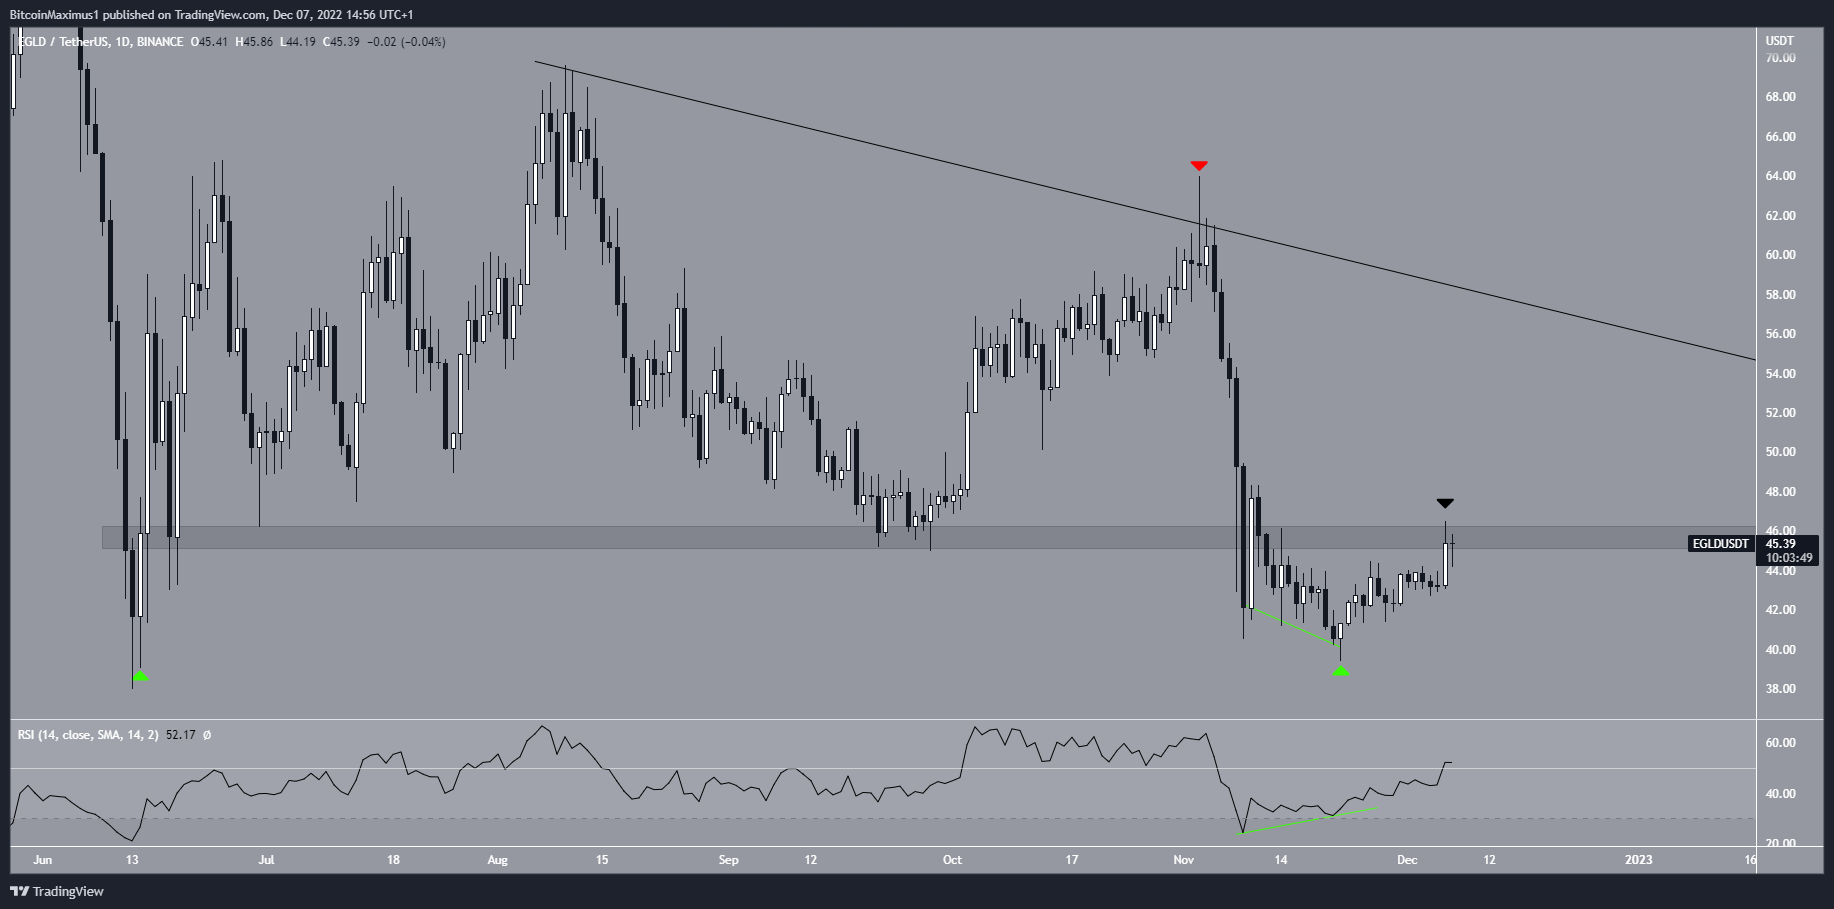
The EGLD price has decreased below a descending resistance line since Aug. 15. The line caused a rejection on Nov. 3 (red icon), creating a long upper wick and leading to a low of $39.43 on Nov. 22.
The downward movement also caused a breakdown from the $45.30 horizontal support area, which has now turned to resistance (black icon).
Despite the fact that the EGLD price is trading below resistance, there are also several bullish signs in place.
Firstly, the Elrond price has created a double bottom relative to the price on June 13 (green icons). The double bottom is considered a bullish pattern.
More importantly, the daily RSI has generated bullish divergence (green line) and moved above 50. Both are considered bullish signs.
Therefore, the technical analysis from the daily time frame suggests that the Elrond price will be successful in moving above the $45.30 area.
Elrond Price Short-Term Breakout
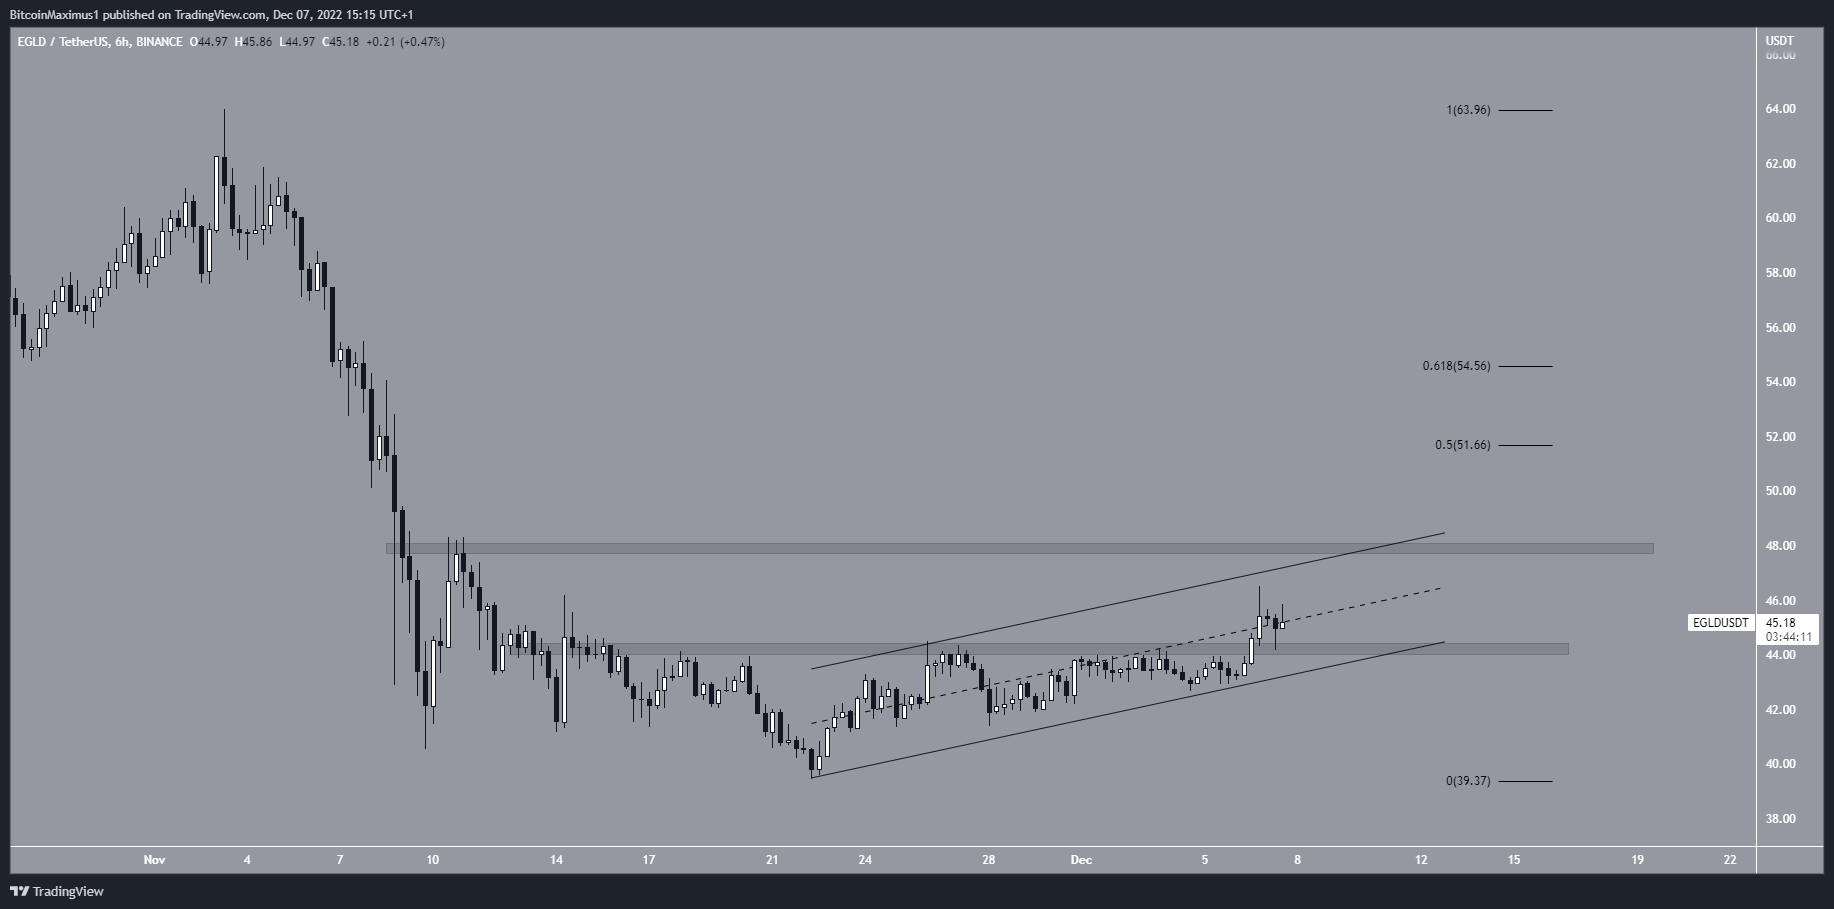
The six-hour chart shows that the Elrond price has increased inside a possible ascending parallel channel since Nov. 21. Such channels are considered corrective patterns, meaning that an eventual breakdown from it would be likely. However, the channel’s resistance line has not been validated sufficiently.
On Dec. 5, the EGLD price broke out from the $44.30 horizontal resistance area and validated it as support afterward during the next 24 hours. The Elrond price today is $45.17, just below the middle of the channel. If the breakout continues, the next closest resistance is at $48, also coinciding with the channel’s resistance line.
A breakout from the latter would also confirm the long-term double bottom pattern, leading to an increase toward $51.66-$54.56.
On the other hand, a breakdown from the channel would invalidate the long-term double bottom pattern and could lead to a new yearly low.
For BeInCrypto’s latest crypto market analysis, click here.
Disclaimer: BeInCrypto strives to provide accurate and up-to-date news and information, but it will not be responsible for any missing facts or inaccurate information. You comply and understand that you should use any of this information at your own risk. Cryptocurrencies are highly volatile financial assets, so research and make your own financial decisions.


