


Often times when having an open position, Bitcoin traders are subject to bias when trying to determine the direction of future price movement. Naturally, the bias is in the same direction as their open position. One effective way to remove this bias is by using an inverted chart.
Say that the chart of an asset — like Bitcoin (BTC) — looks bullish but you are skeptical since you think that this might be because you have recently opened a long position and want to profit by an upward move.
We can remove this bias by using an inverted chart. If the chart looks bearish after inverting than there is no bias present. If the opposite is true, you might need to go back and redo the analysis in order to determine where the bias is coming from. The opposite is true if we want to remove bearish bias. Inverting the chart and getting a bullish outlook means that there is no bearish bias.
Entrepreneur and technical analyst @traderescobar stated that the current Bitcoin price action looks bearish. He used the inverted chart in order to make his point.
Furthermore, he stated that “Bitcoin will get smashed this week” and encouraged people to go short. Let’s analyze this closely and see how likely it is.
https://twitter.com/TraderEscobar/status/1182217122383925248
Bitcoin: Bull or Bear?
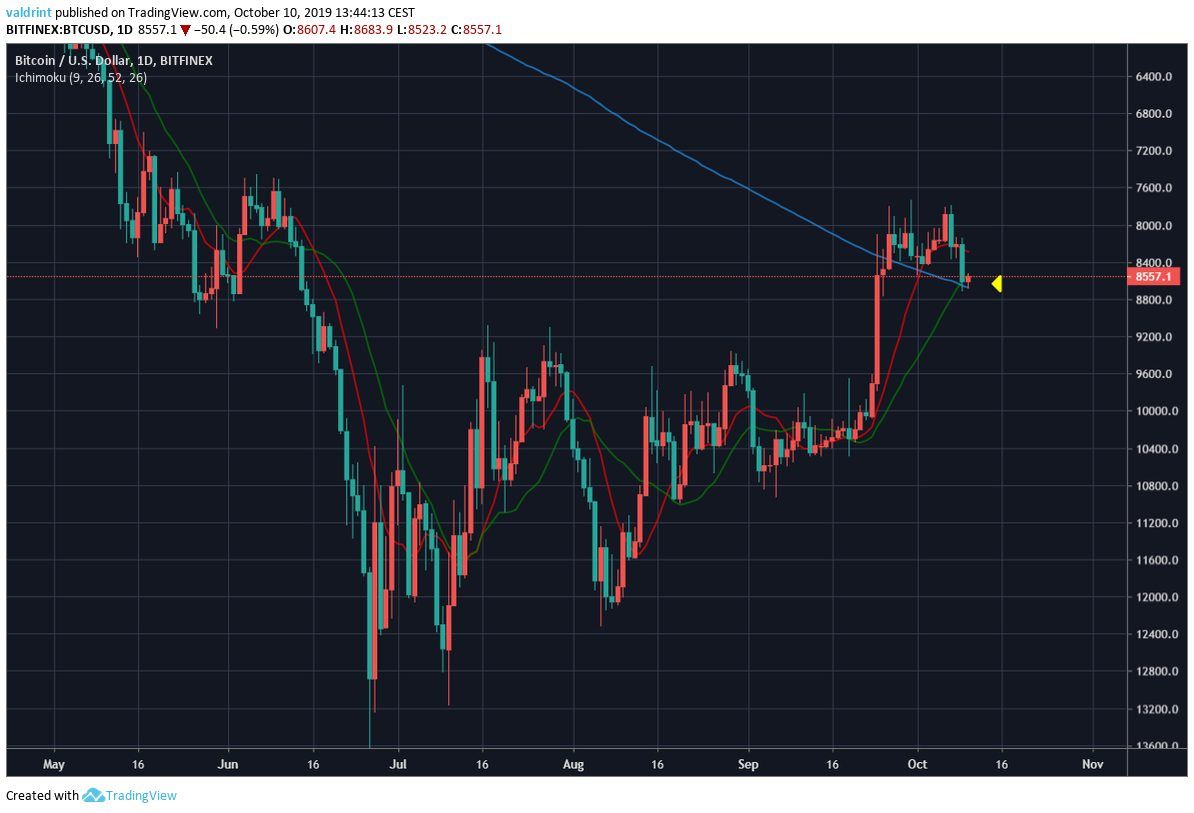
Looking at the Bitcoin chart, the moving averages (MA) immediately stand out.
The price just broke out above the 200-day MA and has found support above it and the 20-day one.
However, the 10-day MA has begun to turn downward, potentially setting itself up for a bearish cross.
The bullish indication of breaking out above the 200-day MA is stronger than that of the potential bearish cross from the short-term MAs.
[Author’s Note: both charts presented below are inverted.]
Low Volume
Another interesting development is the extremely low levels of volume during this decrease.
Furthermore, the Bitcoin price is still struggling at the 0.382 fib level of the previous move — making this more likely to be a retracement than the beginning of a new trend.
The support area at $9000-$9200, between the 0.5 and 0.618 fib levels, presents a very likely reversal area before the potential move towards $7000.

Summary
When inverting the Bitcoin chart, we get a bearish outlook. Since the initial price prediction is bearish and the inverted chart looks bullish, we can come to the conclusion that there is no bias present.
Therefore, the Bitcoin price is likely to decrease, after potentially reaching a high of around $9200.
Do you believe using an inverted chart has any merit? Which way will the Bitcoin price go? Let us know in the comments below.
Disclaimer: This article is not trading advice and should not be construed as such. Always consult a trained financial professional before investing in cryptocurrencies, as the market is particularly volatile.
Images are courtesy of Shutterstock, TradingView, Twitter.


