


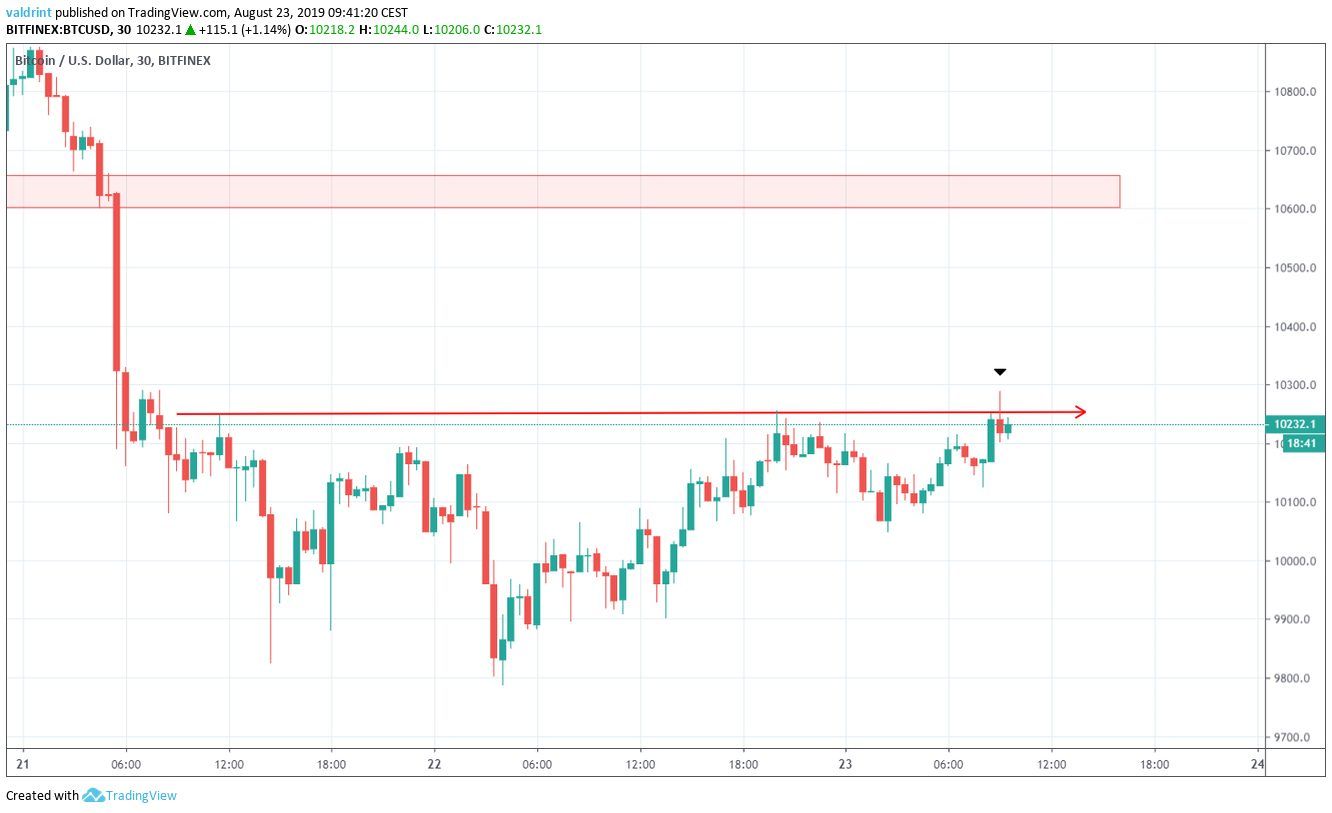
A look at the hourly time-frame shows that there is a possible bullish pattern developing in BTC — an inverse head and shoulders.
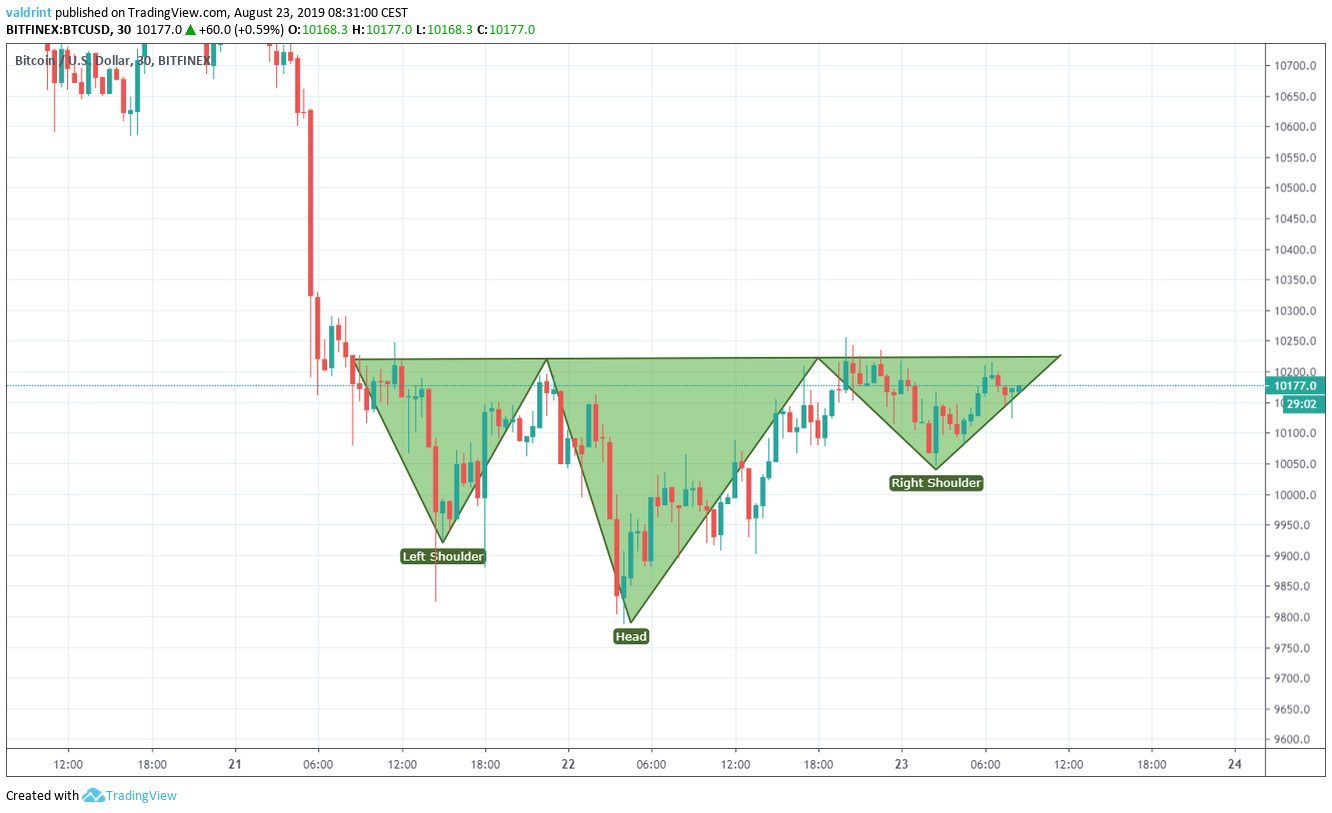
An inverse head and shoulders pattern has been created — beginning on August 21, with resistance at $10,250.
While it looks as if the Bitcoin price has completed the right shoulder and is ready to break out, the retracement from the neckline to the right shoulder was very small.
While the left shoulder reached lows of $9850, the right one only decreased to $10,050.
Therefore, it is possible that the price makes another decrease before breaking out.
The breakout target is $10,700 — found by projecting the height of the pattern.
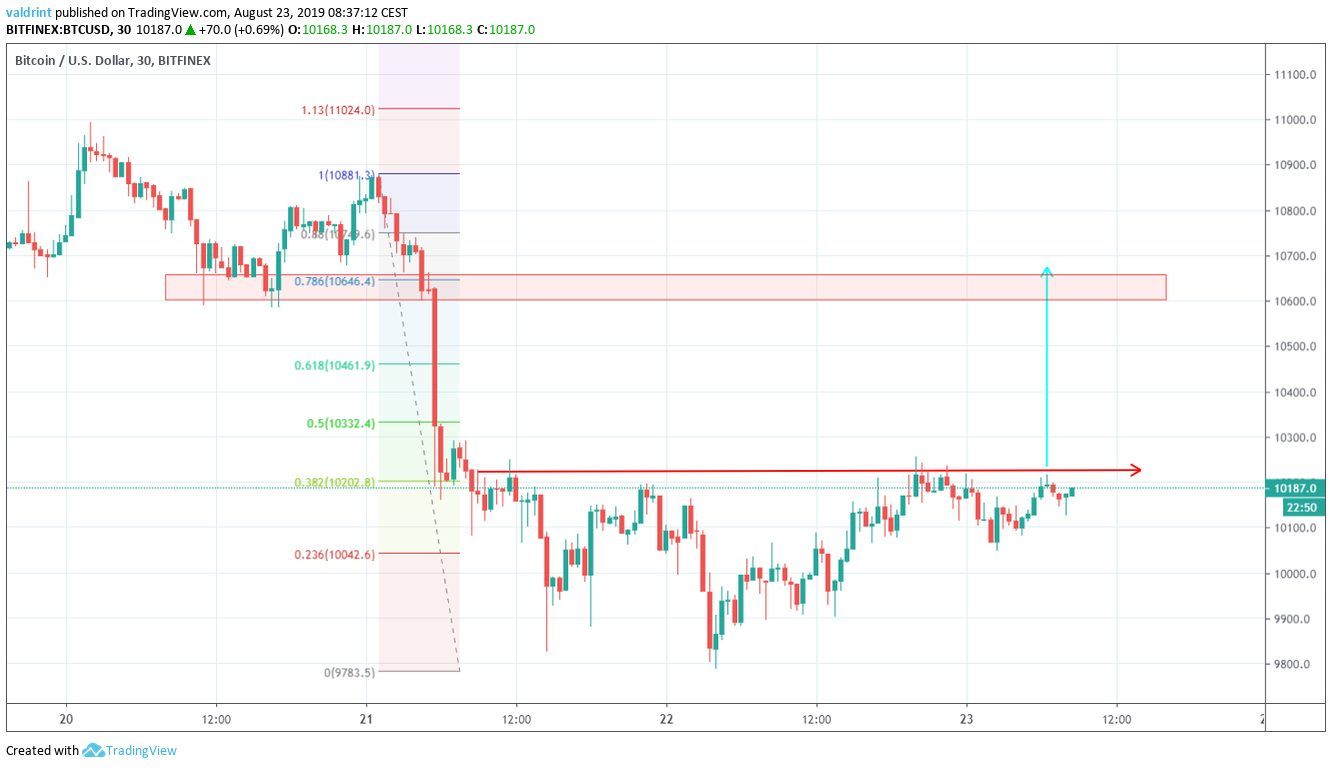
However, we will adjust this to $10,600-$10,650 due to the resistance area there and the fib level.
Now, let’s look at different ways to trade this pattern in order to maximize our profits while minimizing the risk.
Disclaimer: This article is not trading advice and should not be construed as such. Always consult a trained financial professional before investing in cryptocurrencies, as the market is particularly volatile.

Buy and Wait Approach
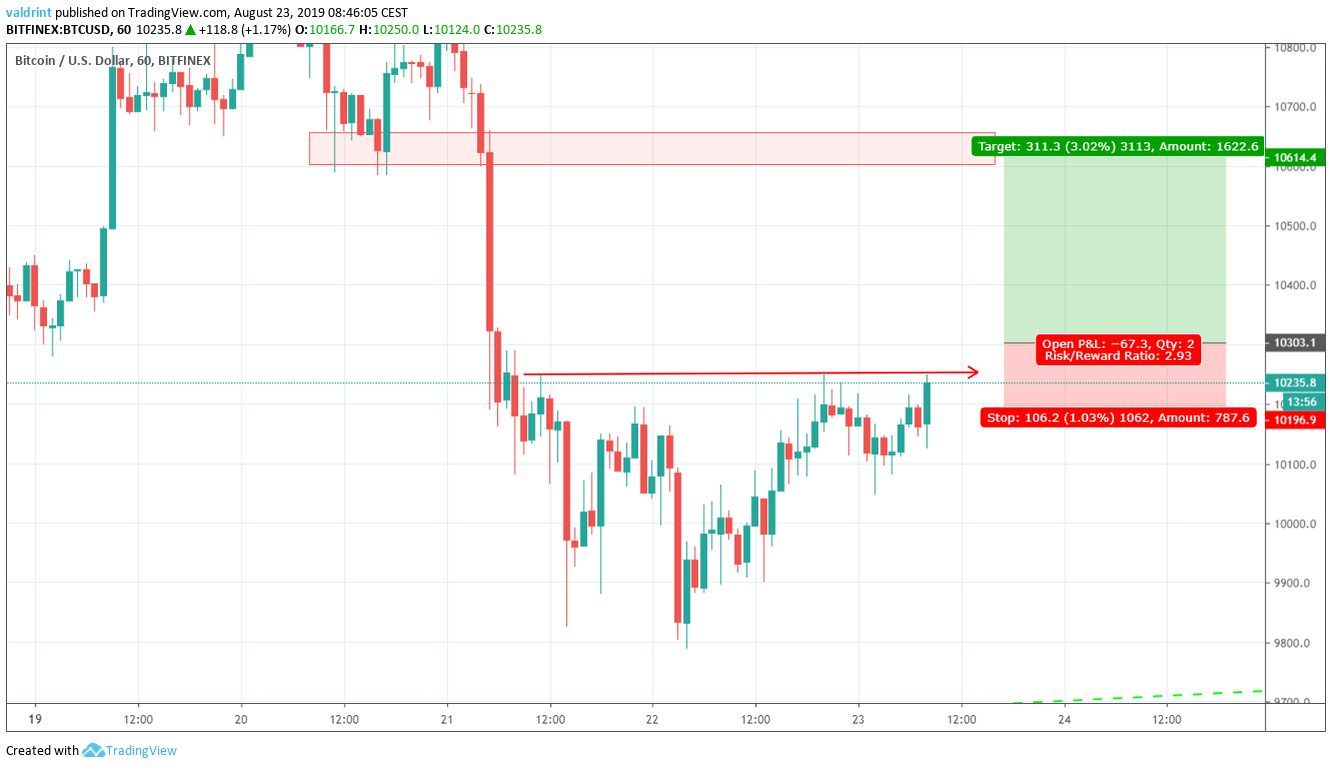
The first scenario we are going to look at is to buy at the current price and wait for a breakout.
The target will remain $10,600-$10,650 for all three of our trading scenarios.
- Entry point = $10,250
- Stop/Loss = $10,030
- R;R Ratio = 2.3
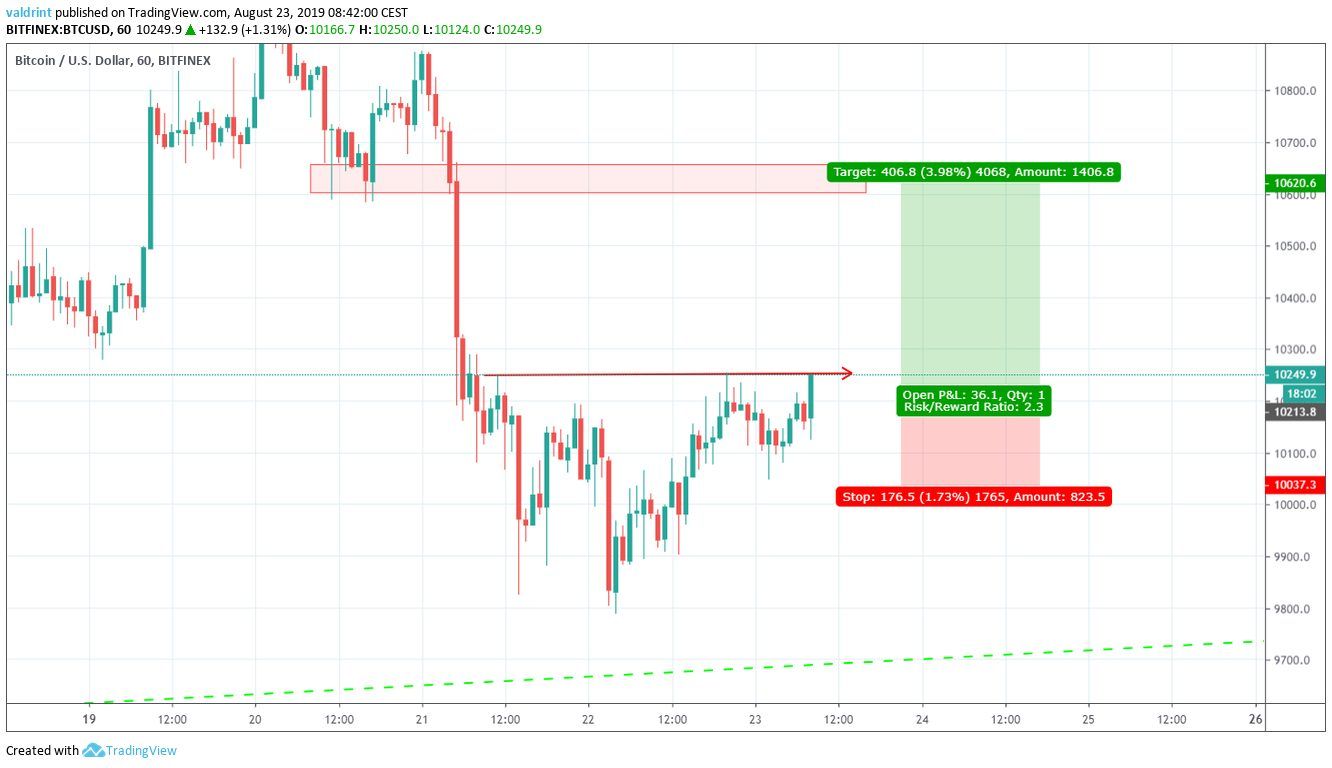
In my opinion, the only upside to buying immediately is that you remove the risk of the price breaking out without triggering your order.
The stop/loss would be placed below the current low of the right shoulder.
I would prefer to do this trade manually, due to the risk of the stop/loss being triggered and the market moving against you.
Due to the shaky placement of the stop/loss, I think that is likely. However, for the sake of comparing the R;R ratios of the three scenarios, we are assuming it is placed at $10,030.
Additionally, if the Bitcoin price reaches our target, it would amount to an increase of four percent. This is not an incredibly lucrative trade by any means.
Due to the reasons mentioned above, this is my least favorite scenario.
However, it is also the simplest. It would likely not require any quick decisions to be made resulting from a rapid price movement since our exit level is far from the entry point.
Wait For a Better Entry Point
In the second scenario, BTC has yet to finish the right shoulder and will make another low similar to that on August 21.
- Entry point: $10.000 – $10,100
- R:R Ratio: 5.5
- Stop/Loss: $9880
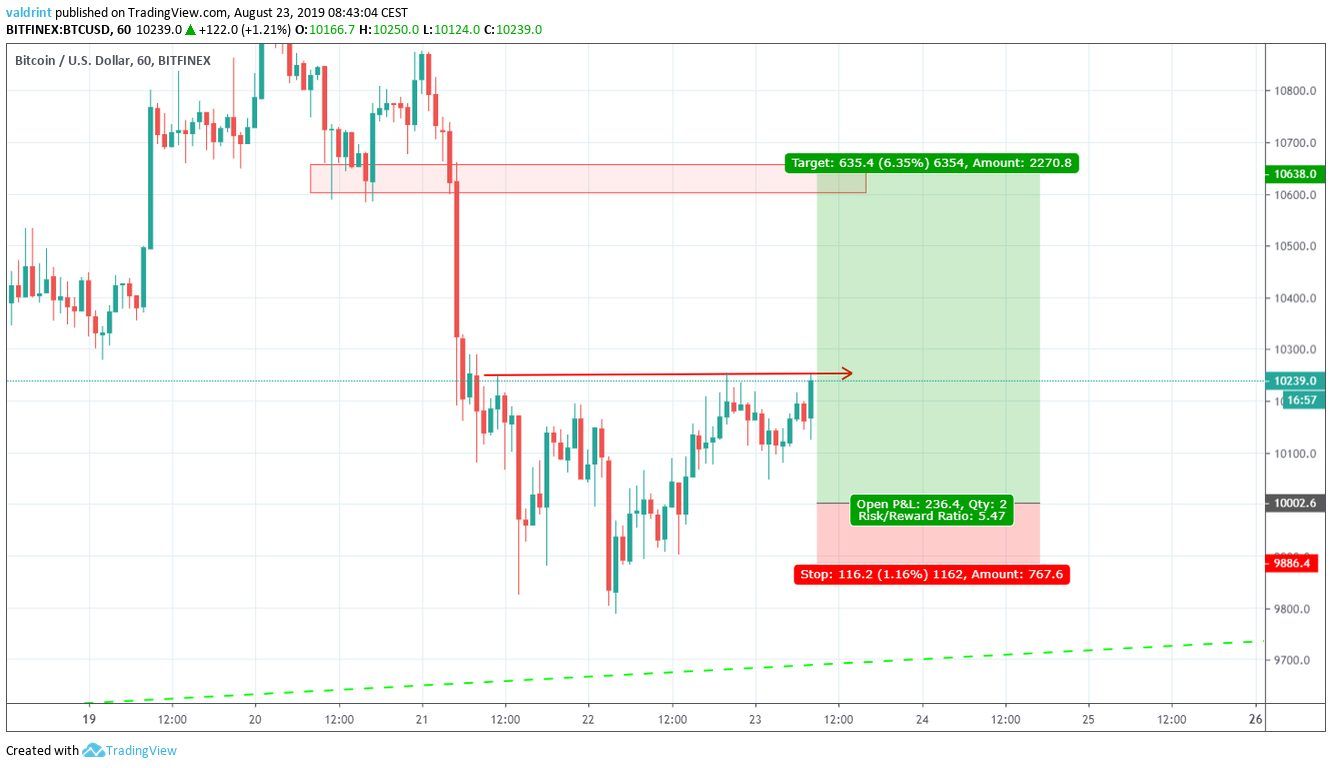
The biggest downside to doing this trade is that we risk the price breaking out without triggering our order.
However, if the Bitcoin price decreases and we enter, we would gain about 6.50 percent if our target is reached.
This is a good profit margin — especially considering the fact that the breakout is likely to be rapid — providing us with a quick gain.
Additionally, I am comfortable with the placement of the stop loss.
I don’t think it is likely for the price to trigger it and then move upward.
Also, I like the risk/reward ratio.
Likewise, this trade scenario would most likely not require any manual adjustments — since we are comfortable with the entry and stop/loss placements.
Buy After Breakout
The third scenario is riskier and only suggested for advanced traders.
Since the resistance line has been validated several times, I do not think the Bitcoin price will move above it unless it breaks out.
So, we will buy after the price breaks out, and look to make a very quick profit.
- Entry point : $10,300
- Stop/Loss : $10,200
- R:R : 3
Since our entry point is not optimal, we would most likely exit the trade as soon as the price begins to show weakness — most likely before the target is reached.
Also, I would not place a stop/loss at the given level, but rather trade it manually.
I like the idea of buying after a breakout here since I think the resistance line is quite strong.
Also, allowing some room for price movement between the resistance and our entry point ($10,250 – $10,300) removes the risk of our stop being triggered on a fakeout — effectively having us buy the top.
During the time of writing this article, the BTC price reached a high of 10,289 before decreasing. This emphasizes the importance of allowing some room for price movement since BTC is known to be extremely volatile.
Summary
A table summarizing the three scenarios is given below:
Suitable stop/loss placement
Very quick profit.
Requires manual adjustment
Which one of our proposed trade scenarios do you prefer? Let us know in the comments below.

Disclaimer: This article is not trading advice and should not be construed as such. Always consult a trained financial professional before investing in cryptocurrencies, as the market is particularly volatile.
Images are courtesy of Shutterstock, TradingView.


