


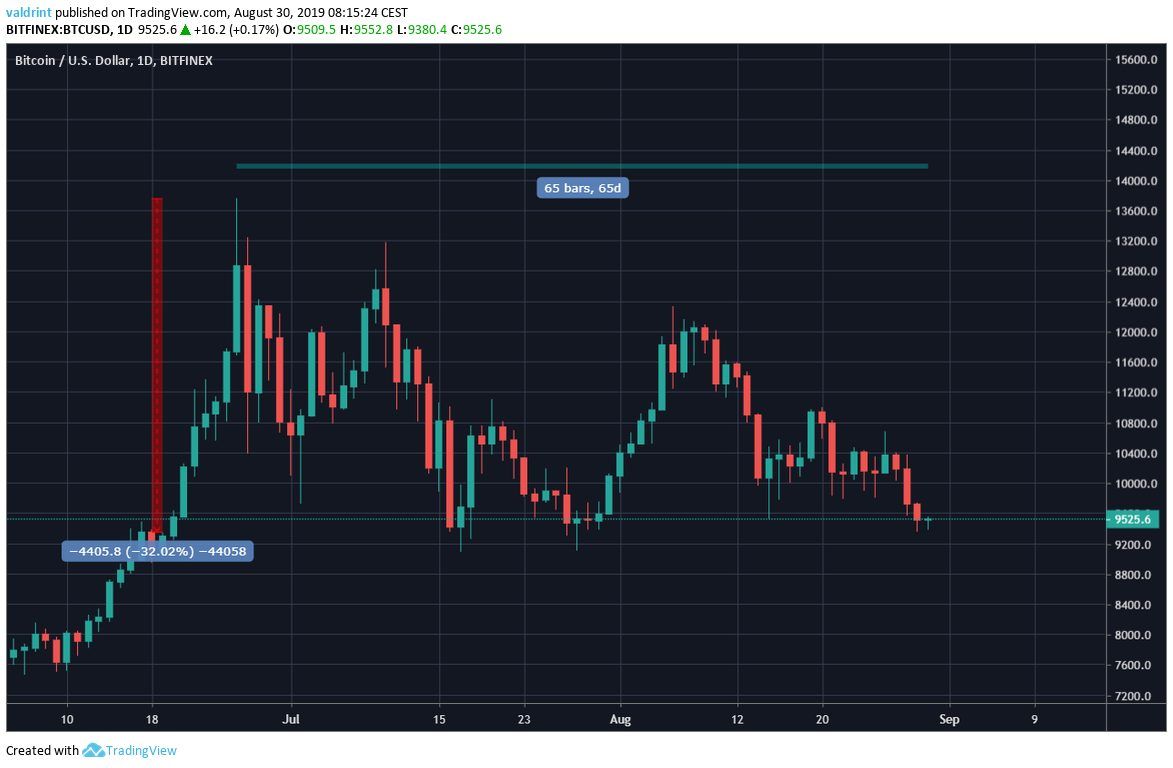
Bitcoin has been in a downtrend since reaching a high of $13,764 on June 26. Counting today, the price of BTC has been decreasing for 65 days for a total decrease of 32 percent.
How To Spot a Downtrend
There are three ways to spot a downtrend in the Bitcoin market.
- Candlestick Analysis
- Volume
- Divergence
Let’s examine each, below!
Candlestick Analysis
The first sign of weakness is given at point (0). There, the price created a bearish engulfing candle.
However, the price decrease fit in with previous price movement. Bitcoin had been increasing for more than two and a half months without experiencing any retracement at all.
So, at the time, this candle could have been explained as a long-overdue retracement after a significant uptrend.
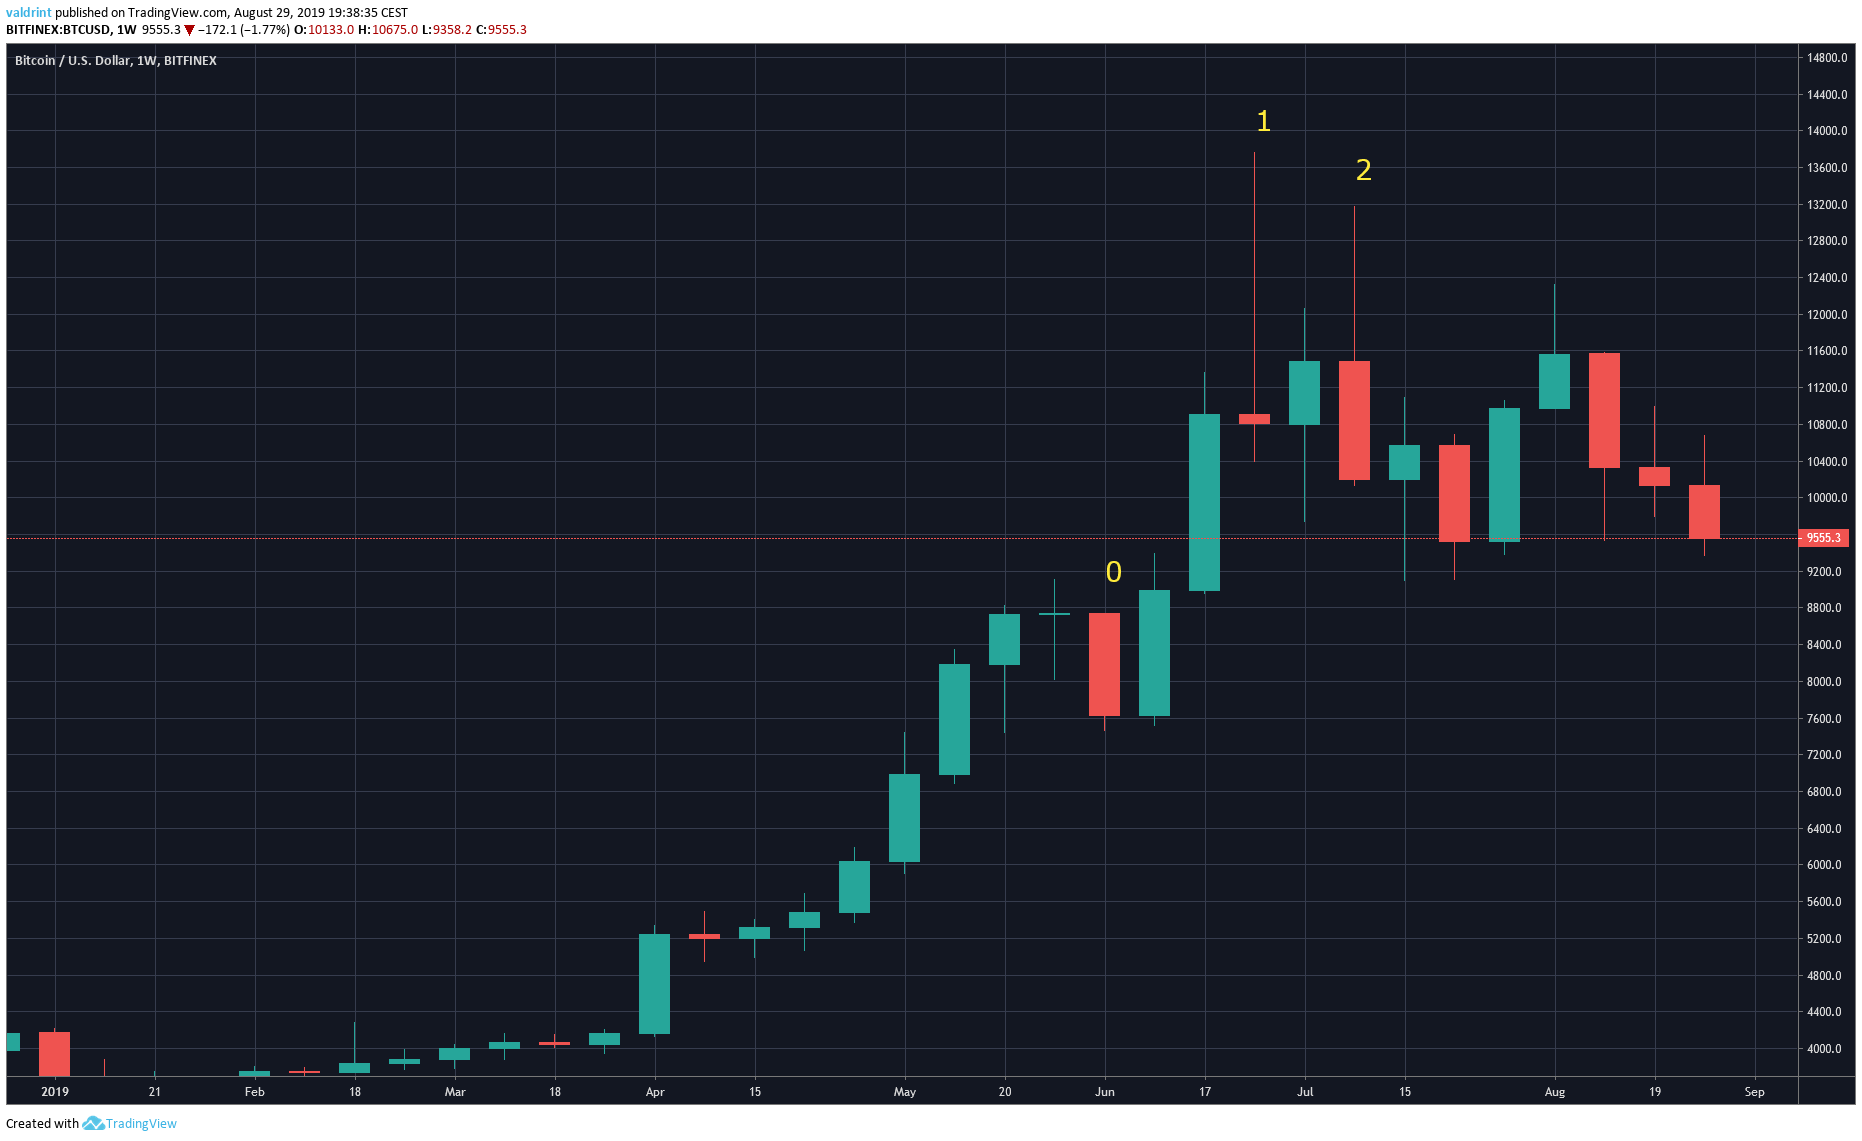
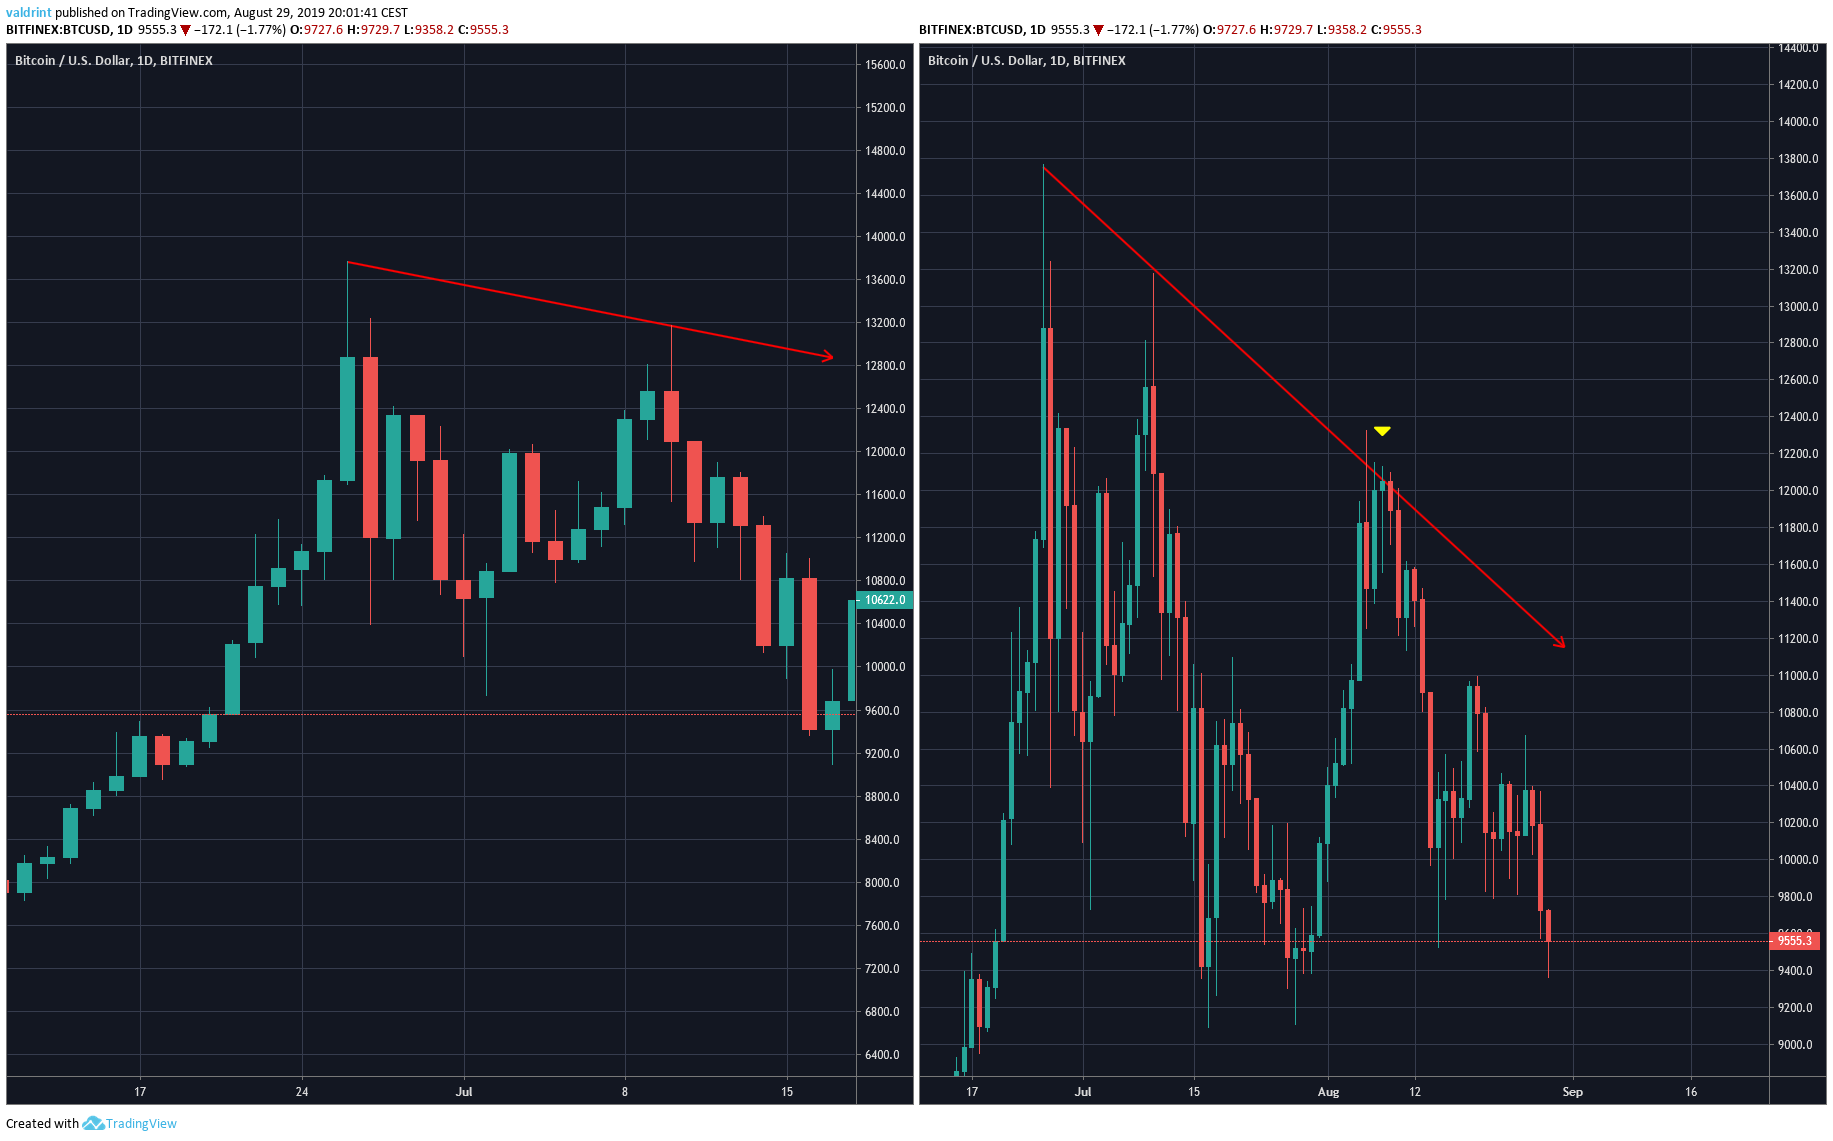
The bearish signs, which actually indicated that the downtrend will begin, are given at (1) and (2).
Bitcoin continued its rally after (0) and reached a high of $13,768 before decreasing to $10,308. This was the first rapid crash. It created a weekly doji, characterized by a very long upper wick, which indicates selling pressure.
After a relatively bullish week, (2) gave the final blow to the price. This created a candle that resembles a shooting star. Furthermore, instead of creating a doji as it did at point (1), the weekly close was almost at its lowest point. Once we take into account prior movement, we can see the significant bearish outlook.
The price made a top of nearly $13,700 before decreasing rapidly. It gained strength and made another attempt. This one ended at $13,200, and the price decreased even more. Therefore, it made a lower high and low.
At this point, we can begin to trade on the assumption that the Bitcoin price is in a downtrend.
Volume
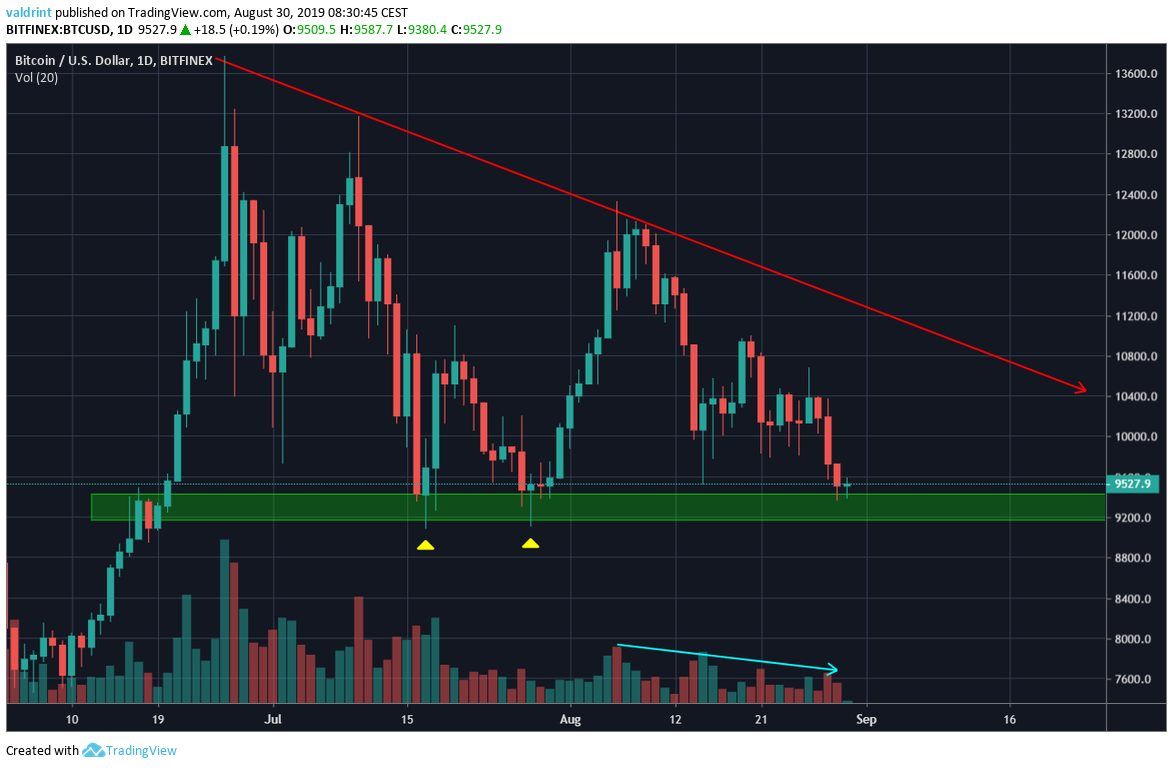
Paying attention to volume and combining it with these signs is helpful in determining the legitimacy of these movements.
In (0) volume was higher than the preceding two weeks in (0), but not in such a magnitude that it stands out.
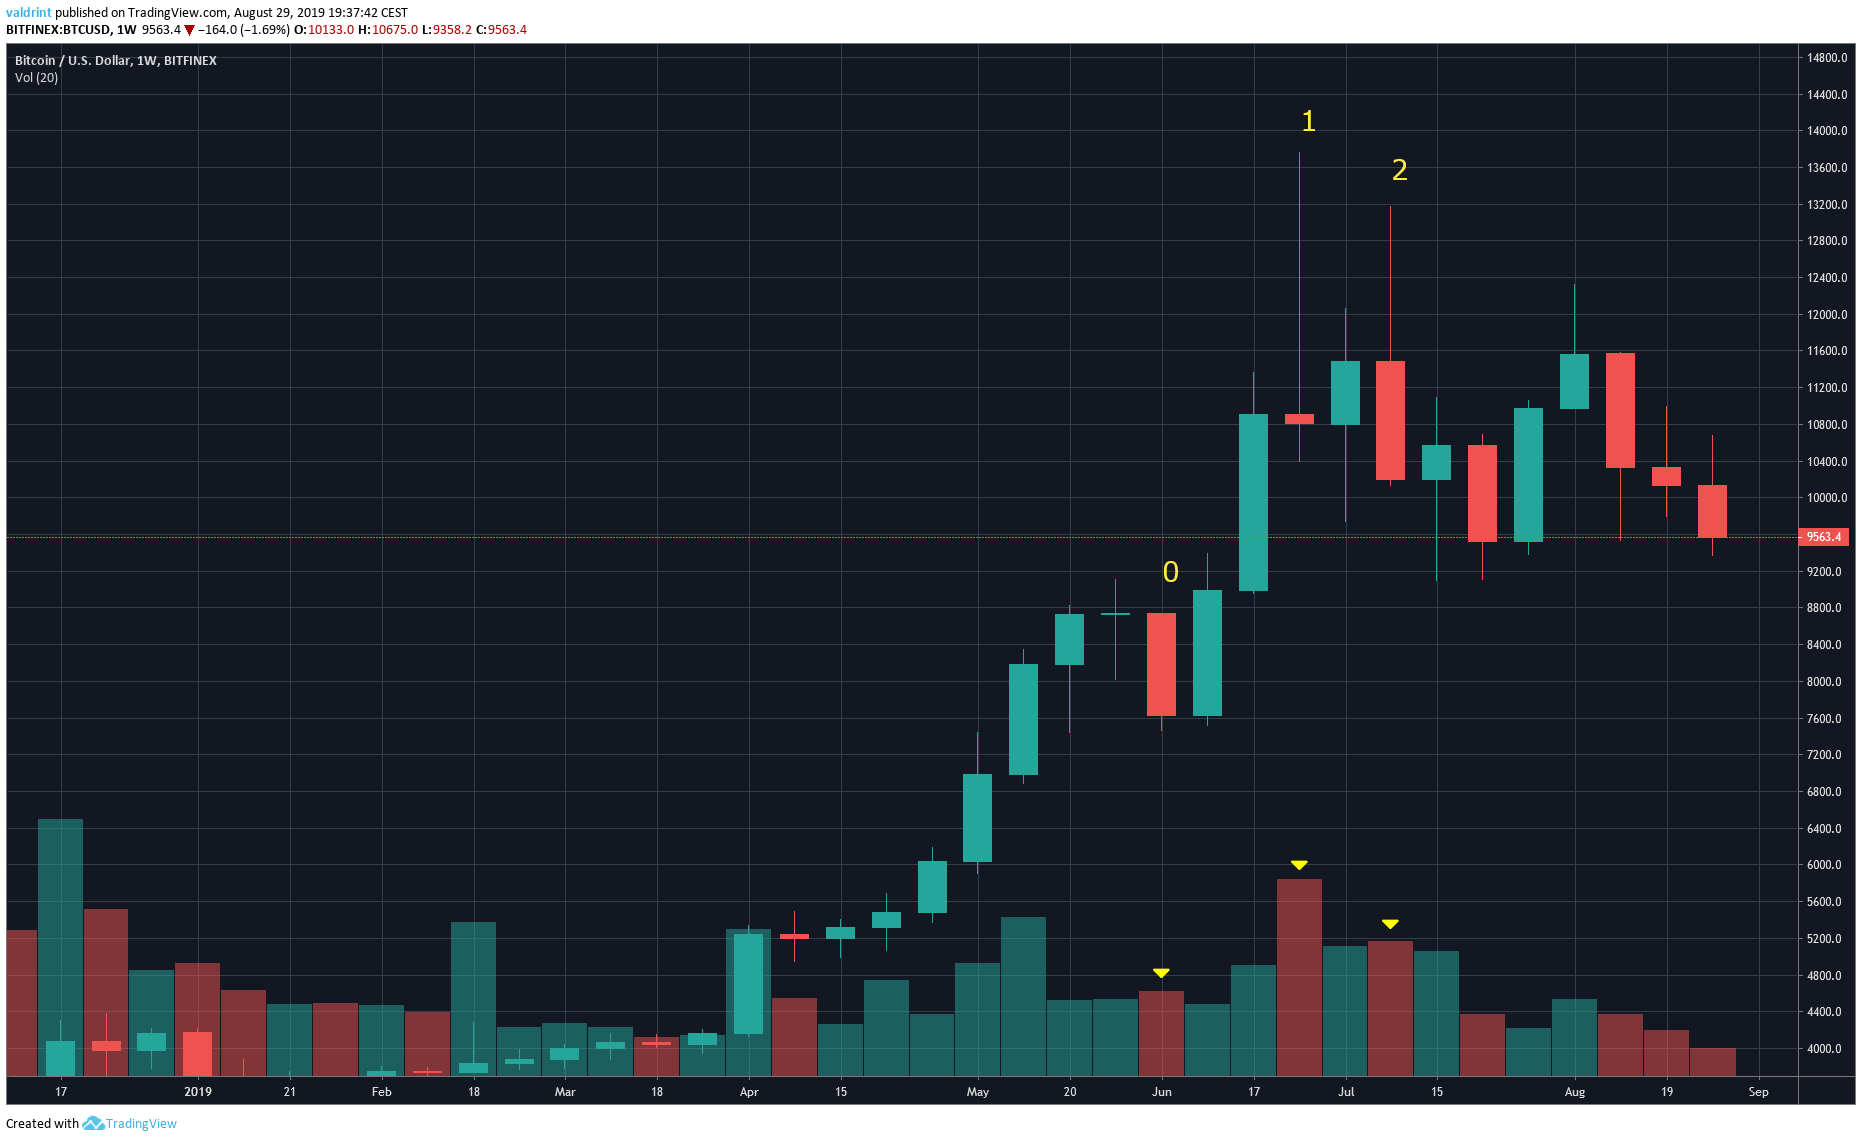
However, the decrease at (1) had the highest volume of the year and (2) has the fifth-highest volume. At this point, we can safely say that the sellers are in full control.
If we missed these signs, we got a very good exit point at (3). While this doesn’t always happen, the downtrend was confirmed by bearish divergence in a very weak upward move.
Divergence
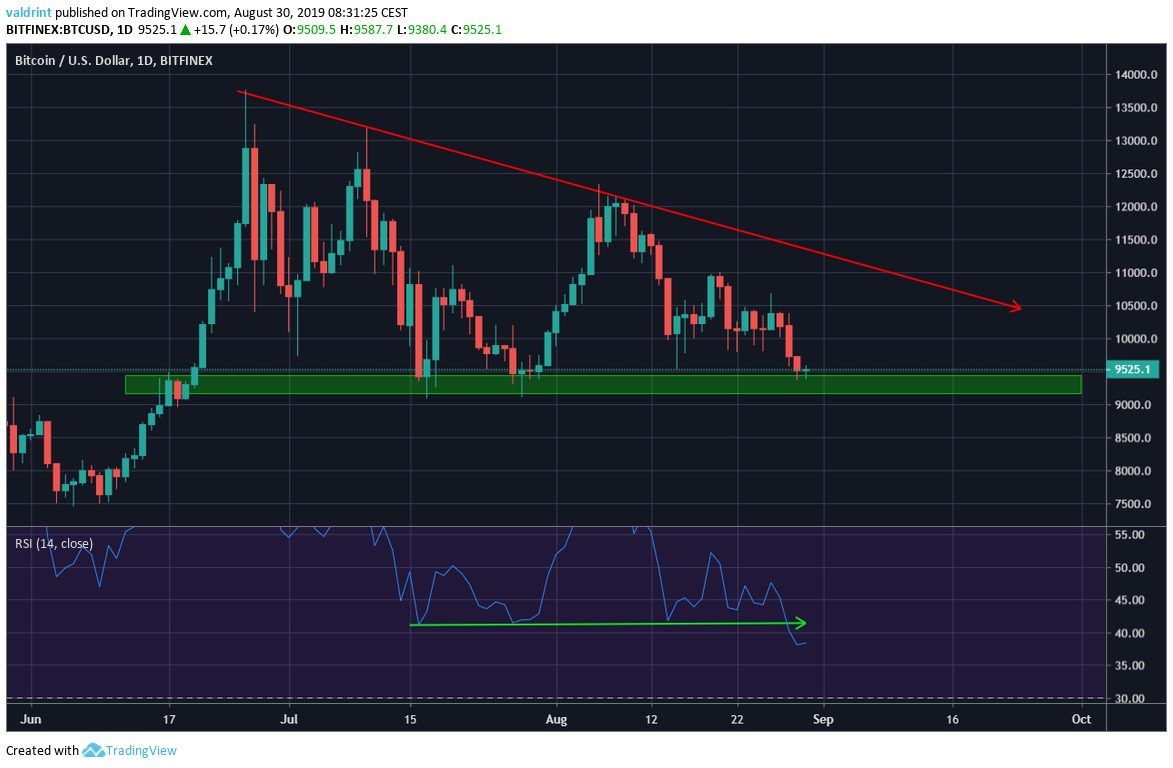
The RSI reached oversold values of 80 in late May, close to (0), the first sign of weakness.
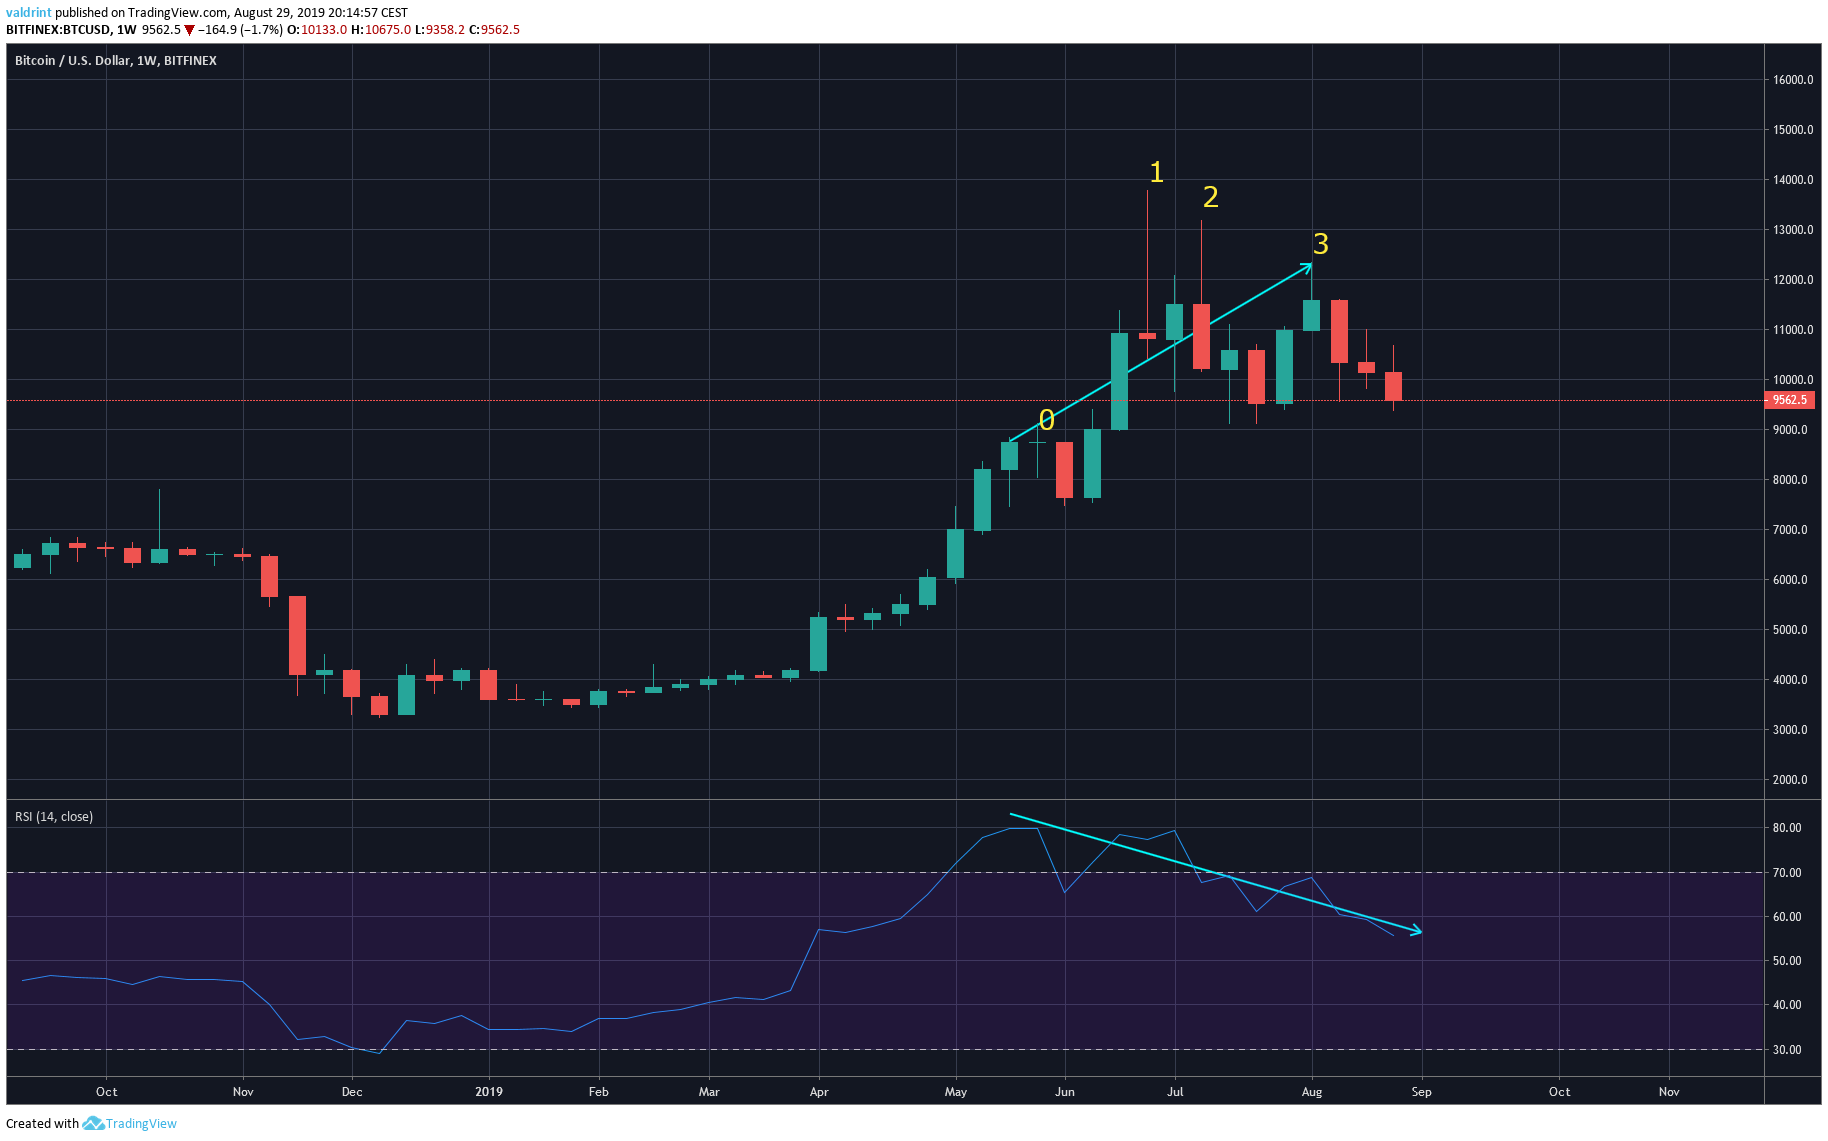
Afterward, while the price increased, the RSI made lower highs.
This culminated in August when the RSI made a very lower high while the price increased.
This is almost a surefire confirmation that the price will decrease.
After making two attempts at going higher (1 and 2), the price makes an extremely weak move, without strength — however, it increased slightly. This would have offered a very good exit level.
In order to determine the exact exit point, resistance lines can be very helpful.
Resistance
While three touches of the line are usually required to confirm it, let’s see how we would have done after two.
The left side of the graph connects the two highest points, which were previously labeled (1) and (2).
The right side shows the exact same line continued, which predicted the top of (3), giving a great exit point.
The convergence of all these signs increases the likelihood that a downtrend will begin and gives us a way to determine where we should exit our trades.

Where to Buy During a Crash
Let’s say that we sold near $12,000 and we are looking to buy back in.
Our first support area is found at $9200, therefore we will look for signs there.
We can see a double bottom characterized by long lower wicks on July 15 and 29.
At the current time, the past three daily candles have been bearish — showing no signs of a reversal.
Additionally, the volume has been higher on bearish candlesticks.
Finally, the RSI has not generated any bullish divergence and just broke down below a support line.
So, there have not yet been any reversal signs that suggest an upward move might begin and our outlook remains bearish.
However, the markets are unpredictable. Let’s say that an upward move begins. Keeping in mind that our outlook is bearish, we should be looking for levels to short BTC or close our positions.
In order to do so, we will outline a resistance line from the three most recent lower highs.
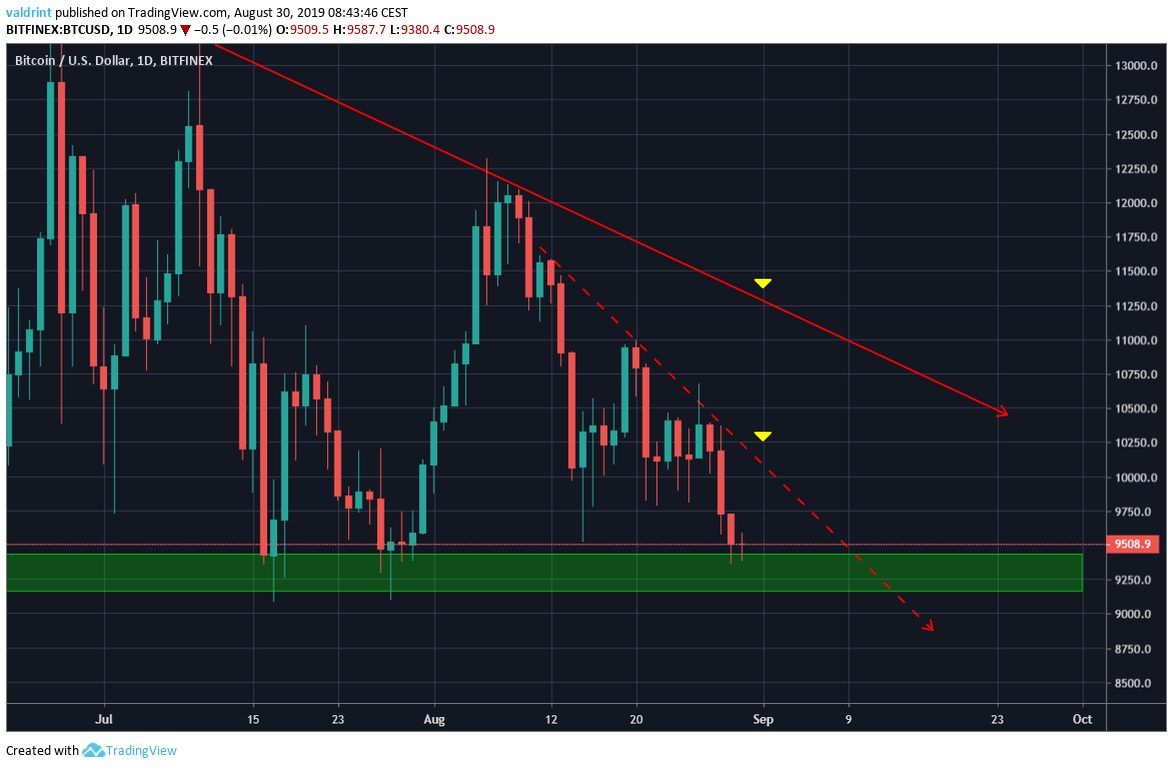
Doing so gives us an exit point of around $10,000. However, since the line is descending, the exit point will decrease as time passes.
The second exit point, which at the current time looks very unlikely to be reached, is found around $11,200.
It is possible that the price stays around $9200 and gives us some reversal signs — causing us to initiate a long trade.
If it does not, however, we need to find the next support area and monitor price movement once it gets there.
The next support area is found near $8500.
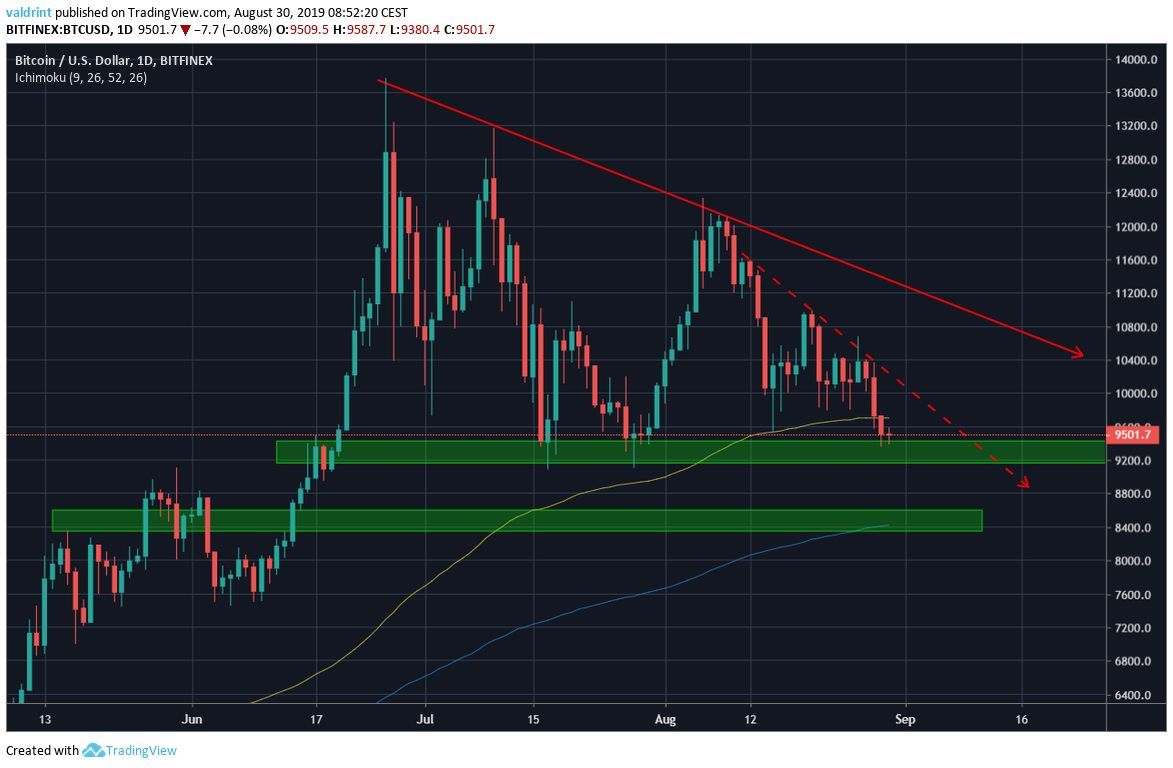
It is created by previous support and the 200-day moving average.
One way to take positions is by using orders instead of waiting for reversal signs.
While this can be riskier, it also offers a higher rate of profitability, since — if done correctly — you will buy the exact bottom, instead of buying once the price has confirmed its upward movement.
However, you run the risk of buying and watching the price continuing its downward movement.
So, setting the buy orders at the lower limit of the range (around $8300) increases the rate of profit if the price begins an upward move — since we are taking positions at the possible bottom.
It also offers the possibility of the price creating a very long wick, filling your order and moving upward, creating a bullish doji or inverted hammer. In that case, we would have a reversal sign and an open position at the low of that sign.
In addition, if our order is left unfilled, we can always wait for a retracement. Once the upward move is confirmed, buy at slightly less prosperous prices — but with a higher certainty that an upward move will follow.
So to conclude, the closest entry points are at:
- $9200: No reversal signs yet
- $8500: Very strong support
At what level are you opening long positions for the ensuing upward move? Let us know in the comments below.

Disclaimer: This article is not trading advice and should not be construed as such. Always consult a trained financial professional before investing in cryptocurrencies, as the market is particularly volatile.
Images are courtesy of Shutterstock, TradingView.


