


The IOTA (MIOTA) price broke out from a descending resistance line and followed that with an ascending triangle breakout. The closest resistance area is found at 3450 satoshis.
IOTA Price Highlights
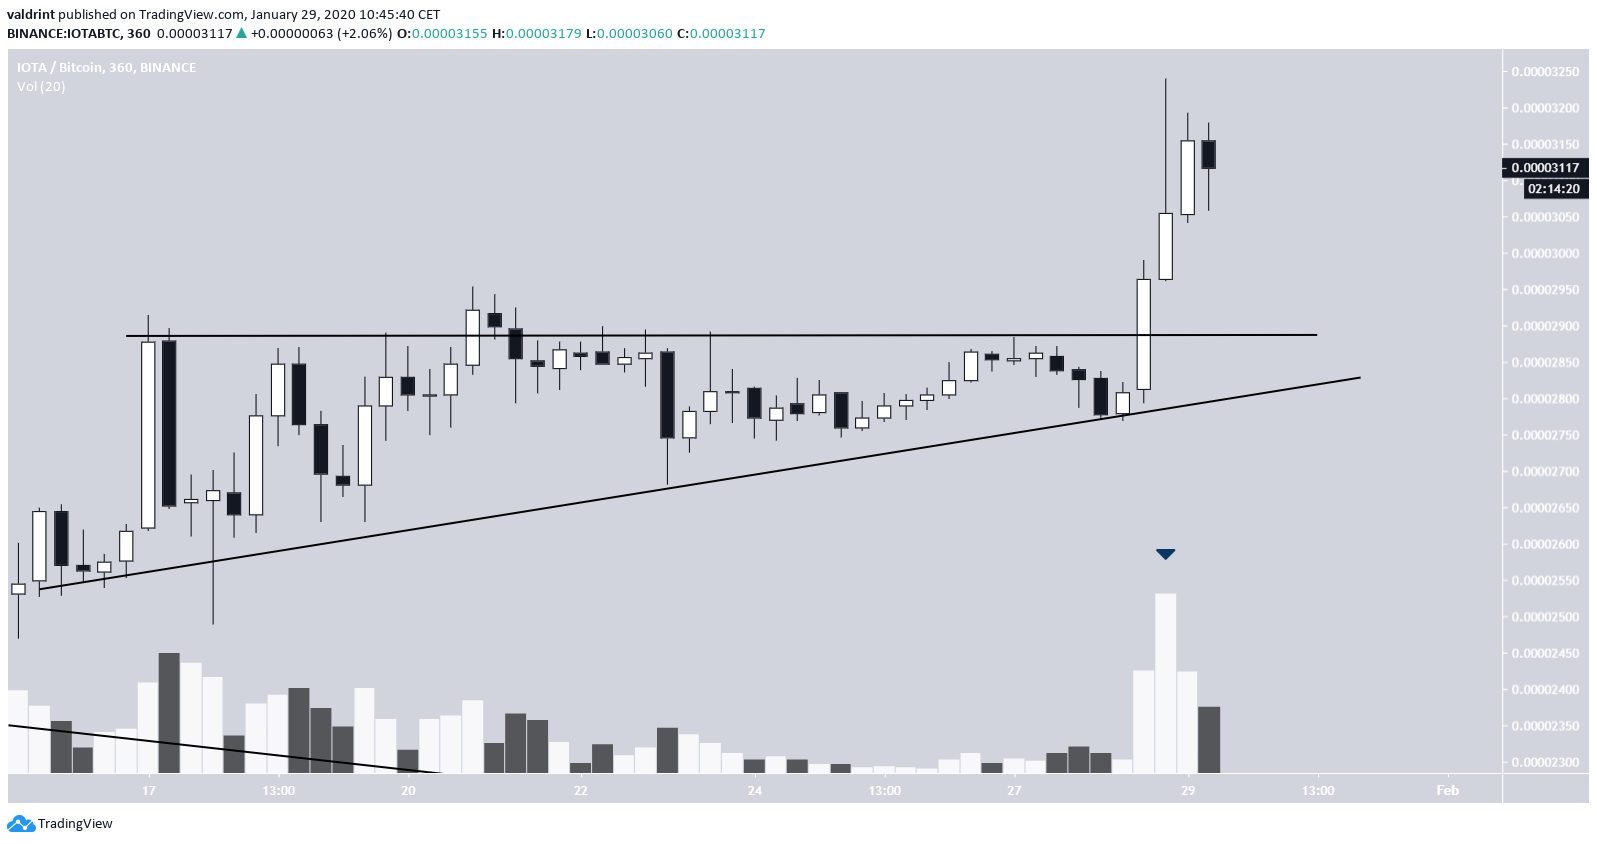
- IOTA broke out from an ascending triangle.
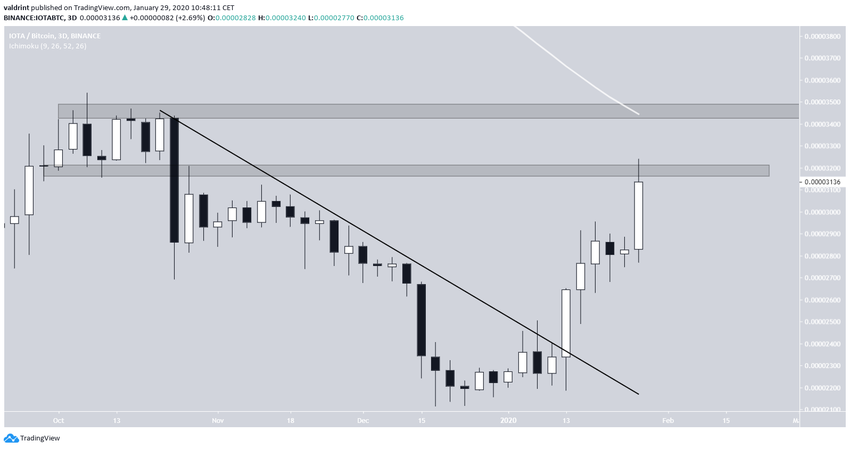
- There is resistance at 3200 and 3450 satoshis.
- There is support at 2900 satoshis.
On January 14, the IOTA price broke out from a descending resistance line. The increase has been continuing since, with the price reaching new highs.
Technical analyst @LomahCrypto outlined the IOTA price chart — stating that he has fully closed his position with a 14 percent profit. In addition, he stated that he is waiting for a pullback in order to re-enter the trade.
$IOTA +~14%
Closed second position fully at 3110.
Will look to buy a pullback or a daily close above that OB. pic.twitter.com/tATWXKk1DI
— Loma (@LomahCrypto) January 28, 2020
Will the pullback occur? If yes, what would be the optimal method of re-entering the trade? Continue reading below if you are interested in finding out.
Triangle Breakout
The IOTA price traded in an ascending triangle between January 17-27. The price broke out from this triangle on January 27 and has been increasing since. The breakout transpired with significant volume — increasing its validity.
We successfully predicted this breakout in our previous analysis.
Looking at a slightly longer-term time-frame, we can see that the IOTA price has reached a minor resistance area at 3200 satoshis. The next resistance area is found at 3450 satoshis and coincides with the top of the descending resistance line, the breakout from which began the current upward movement.
The 3450 satoshi resistance area also coincides with the 100-day moving average (MA) — increasing its significance.
How to Trade IOTA
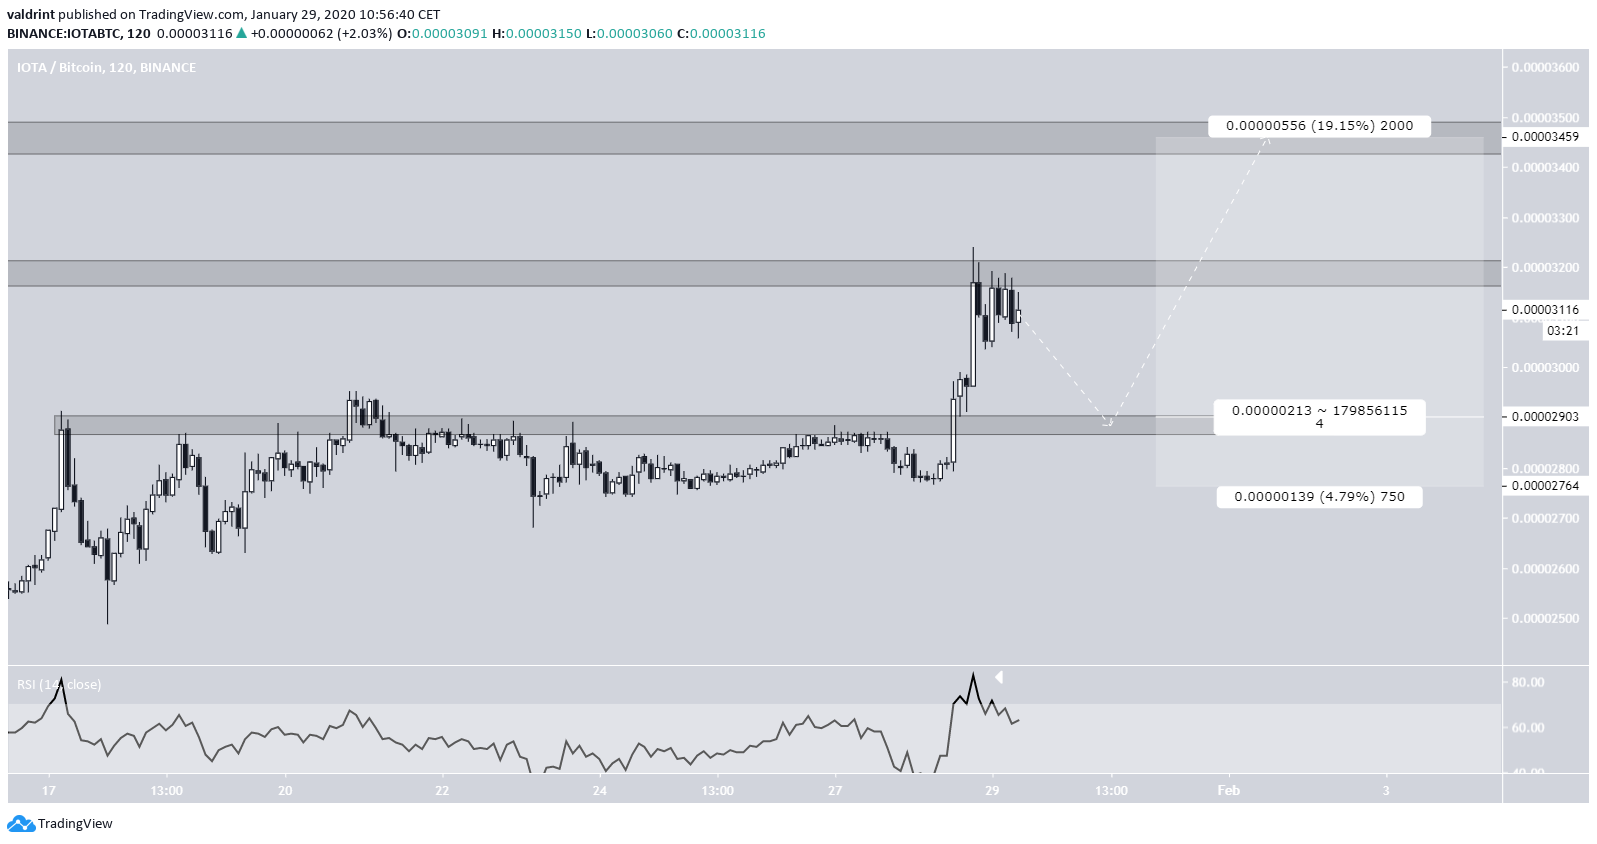
The short-term RSI has yet to show any weakness, even though it is into overbought territory. This allows for the possibility that the price continues to increase until it reaches the next resistance area at 3450 satoshis.
In case the pullback occurs, the 2900 satoshis area, from which the price broke out, is likely to act as support. Initiating a trade with an average entry of 2900 satoshis, a stop loss of 2759 and a target of 3450 satoshis offers a Risk:Reward ratio of four.
To conclude, the IOTA price broke out from an ascending triangle. We believe the increase will continue at least until the price reaches 3450 satoshis.


