
The Middle East conflict is driving up oil prices, raising US inflation risk, and placing Bitcoin (BTC) in a macroeconomic stress test.
The key question that arises is: how will the largest cryptocurrency fare amid war tensions and a potential recession?
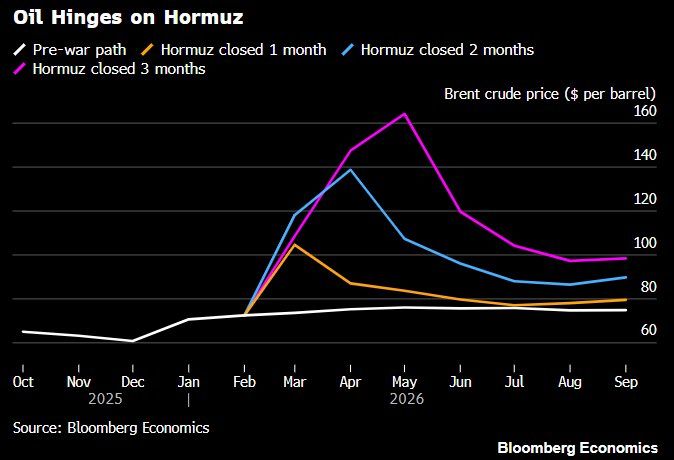
Bloomberg Maps Three Oil Price Scenarios
About a fifth of the world’s oil and natural gas flows through the Strait of Hormuz. Its effective closure following the US-Israeli strikes on Iran in late February has already sent oil prices surging.
According to WSJ, Brent crude futures closed at $100.46 per barrel on Thursday. This marked the first time the benchmark settled above the $100 threshold during regular trading hours since August 2022.
Amid this, Bloomberg has modeled several scenarios based on the duration of the waterway’s closure. According to the projection, a one-month shutdown could send oil to around $105 per barrel.
If the disruption lasts two months, prices could jump to around $140. Lastly, a three-month closure is projected to drive oil to roughly $165.
Follow us on X to get the latest news as it happens
Analysts at Milk Road Macro outlined what sustained high prices would mean for the global economy. As noted in a recent post, Brent between $80 and $90 per barrel is manageable. Yet, when prices reach $90 to $100, this would mark a headwind zone.
“Growth starts to take a visible hit if prices sustain here. Goldman Sachs said a temporary move to $100 could shave about 0.4 percentage points off global growth,” the post read.
The $100 to $120 range marks the stagflation zone, pairing slow growth with sticky inflation. The $120 to $150 window is the “danger zone.”
“This is the level where commentary typically shifts from ‘macro drag’ to ‘heightened recession risk.” Economists generally believe the US economy likely remains mostly resilient unless oil sustains at $125 or above,” Milk Road Macro wrote.
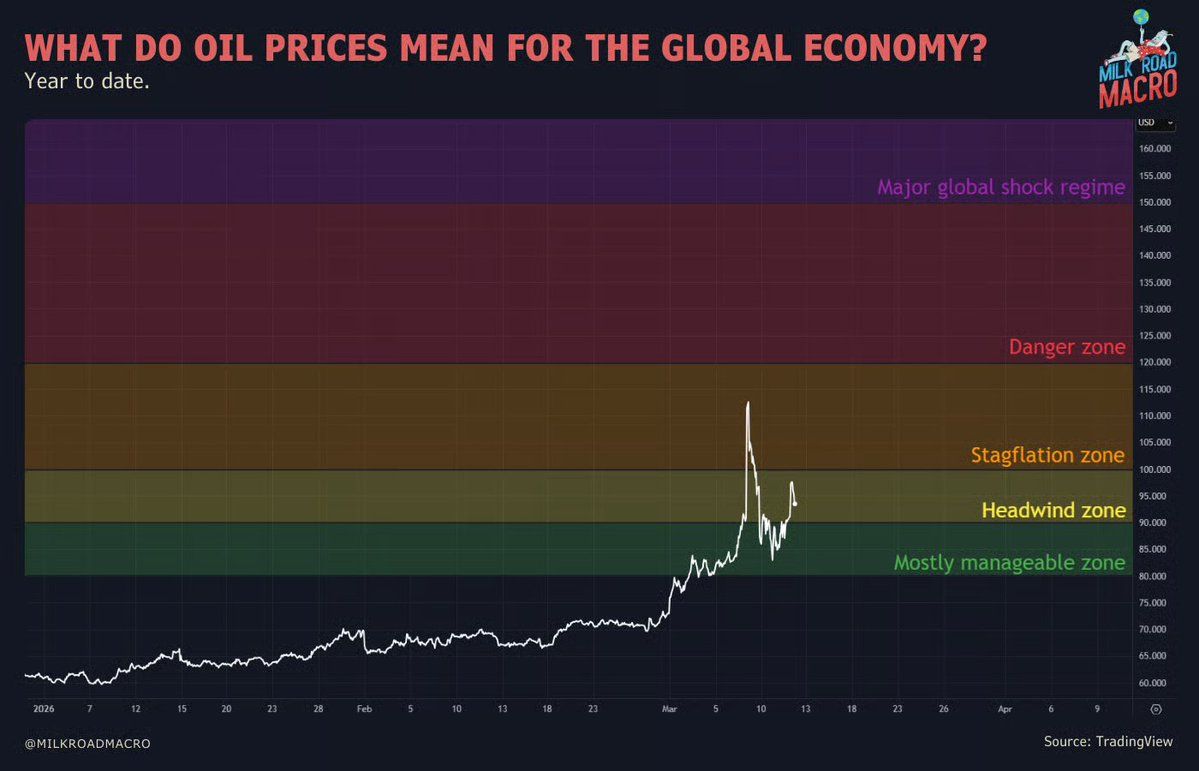
Lastly, if oil surpasses $150 per barrel, it would be what they describe as a “global shock regime.” At that level, surging transportation, manufacturing, food, and energy costs function as a broad tax on economic activity.
Household spending contracts and corporate profit margins compress simultaneously. According to Milk Road Macro,
“Sustaining at this level, the conversation turns to a global recession…And it tightens financial conditions and makes central banks less willing to cut rates, just as growth is slowing.”
Inflation Threatens to Stall Fed Rate Cuts
Sustained high oil prices create inflation risks, complicating central bank decisions. Adam Kobeissi, founder of The Kobeissi Letter, citing a Fed study, noted that every $10 rally in oil increases inflation by approximately 20 basis points.
“As US oil prices rise above $95/barrel, our models indicate that if current levels are sustained for 3 months, US CPI inflation would rise to ~3.2%. This would put US inflation at its highest level since May 2024,” The Kobeissi Letter posted.
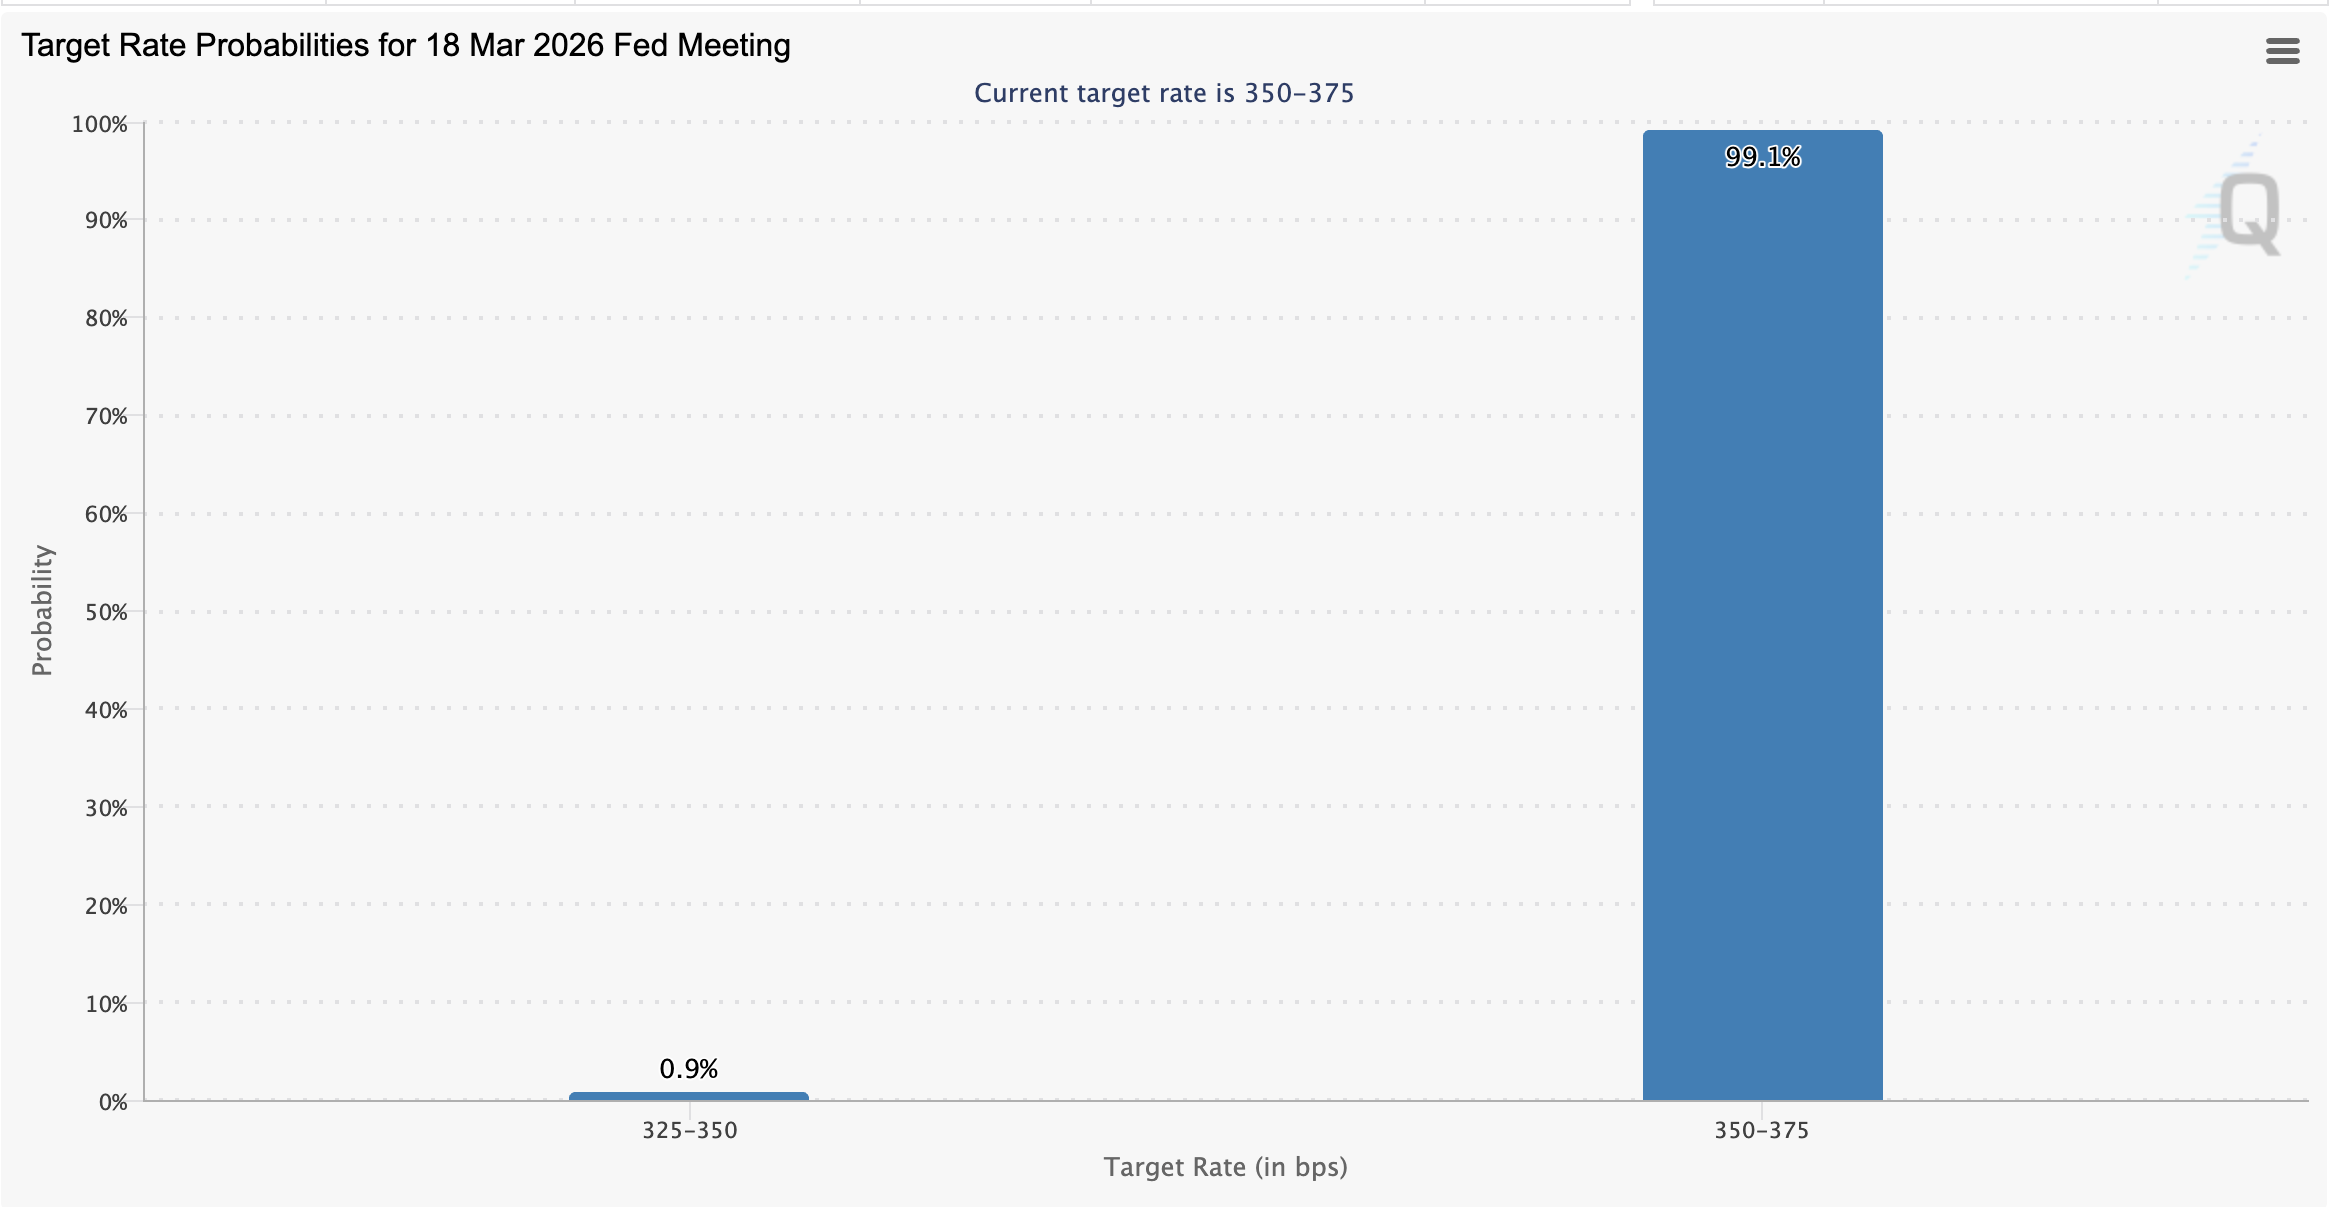
If inflation expectations continue to rise, the Federal Reserve may be forced to delay or scale back anticipated rate cuts. Markets currently price in a 99.1% probability that rates will remain unchanged at the upcoming FOMC meeting, according to CME FedWatch data.
Tighter financial conditions usually hurt riskier assets. As Treasury yields rise, liquidity tightens, and support withdraws from speculative markets. The combination of stubborn inflation and fewer rate cuts creates a tough climate for risk assets, including Bitcoin.
Bitcoin Outperforms Major Assets Amid Tension
Despite the economic challenges, recent market data shows Bitcoin’s surprising resilience. Since the late February strikes on Iran, Bitcoin is up 7.3%, beating out traditional safe havens and stock markets.
As market analysis shows, the S&P 500 and Nasdaq dropped 1% to 2% in the same span, while gold lost 3.7% and silver tumbled over 10%.
Bitcoin’s recent strength amid ongoing uncertainty is notable. Still, if liquidity dries up, cascades of liquidations could hit leveraged crypto derivative trades. Because crypto markets run 24/7, both rapid gains and sudden losses can be amplified during global shocks.
In the near future, Bitcoin’s durability will likely be tested if oil stays high and central banks hold firm on tight policy. If tension in Hormuz cools, risk appetite could return. But continued disruption will challenge Bitcoin’s ability to withstand the pressure.
Subscribe to our YouTube channel to watch leaders and journalists provide expert insights
