


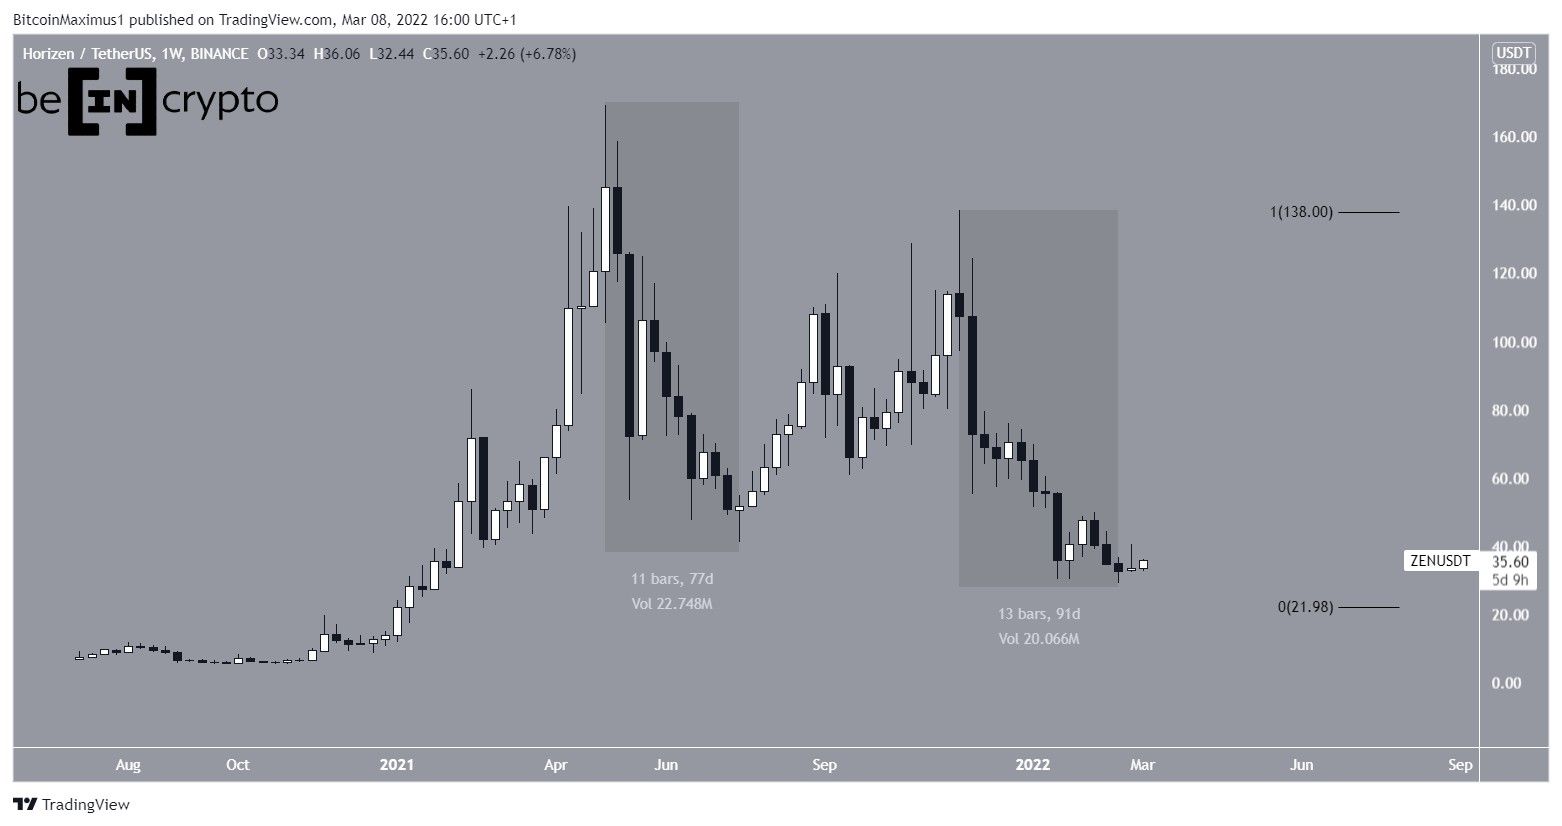
Since January 24, Horizen (ZEN) has bounced three times at the $33 level. The first two bounces also created long lower wicks, which are considered signs of buying pressure.
ZEN has been falling since reaching an all-time high price of $169.23 on May 8. ZEN initially bounced on July 20, 2021, but created a higher low on Nov 26 before falling once more.
The second downward movement led to a low of $29 on Feb 24.
Until now, both downward movements (highlighted) have had very similar rates of decrease.
However, there is no support below the current price.
Bullish ZEN pattern
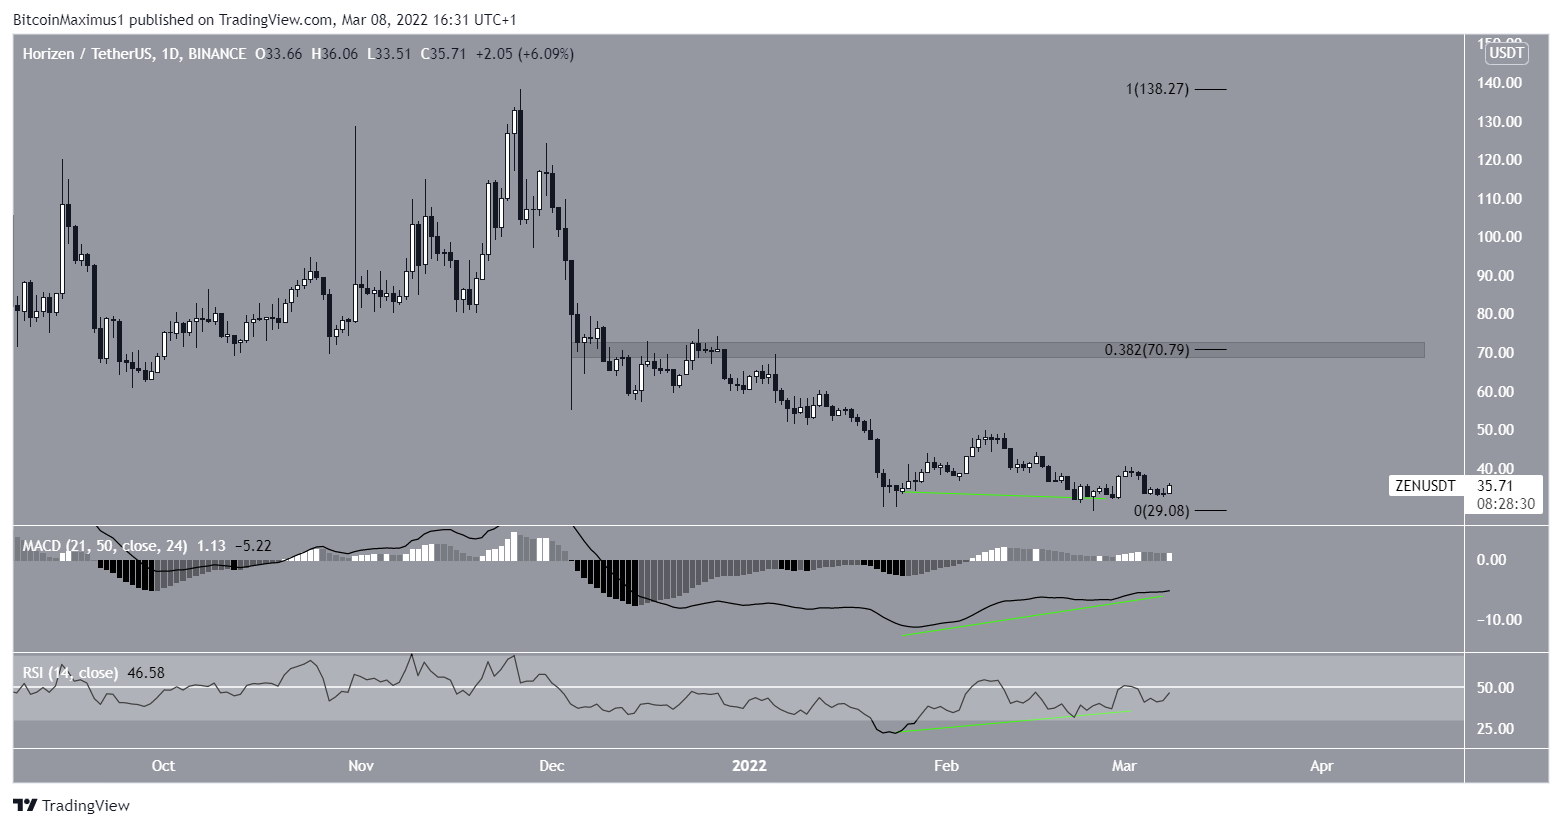
The daily time-frame provides a more bullish chart. In the period between Jan 24 – Feb 24, ZEN created a triple bottom, which is considered a bullish pattern. This means that it often leads to bullish trend reversals.
In addition to this, the double bottom has been combined with bullish divergence in both the MACD and RSI.
If an upward movement followed, the closest resistance area would be at $70.78. This is the 0.382 Fib retracement resistance level and a horizontal resistance area.
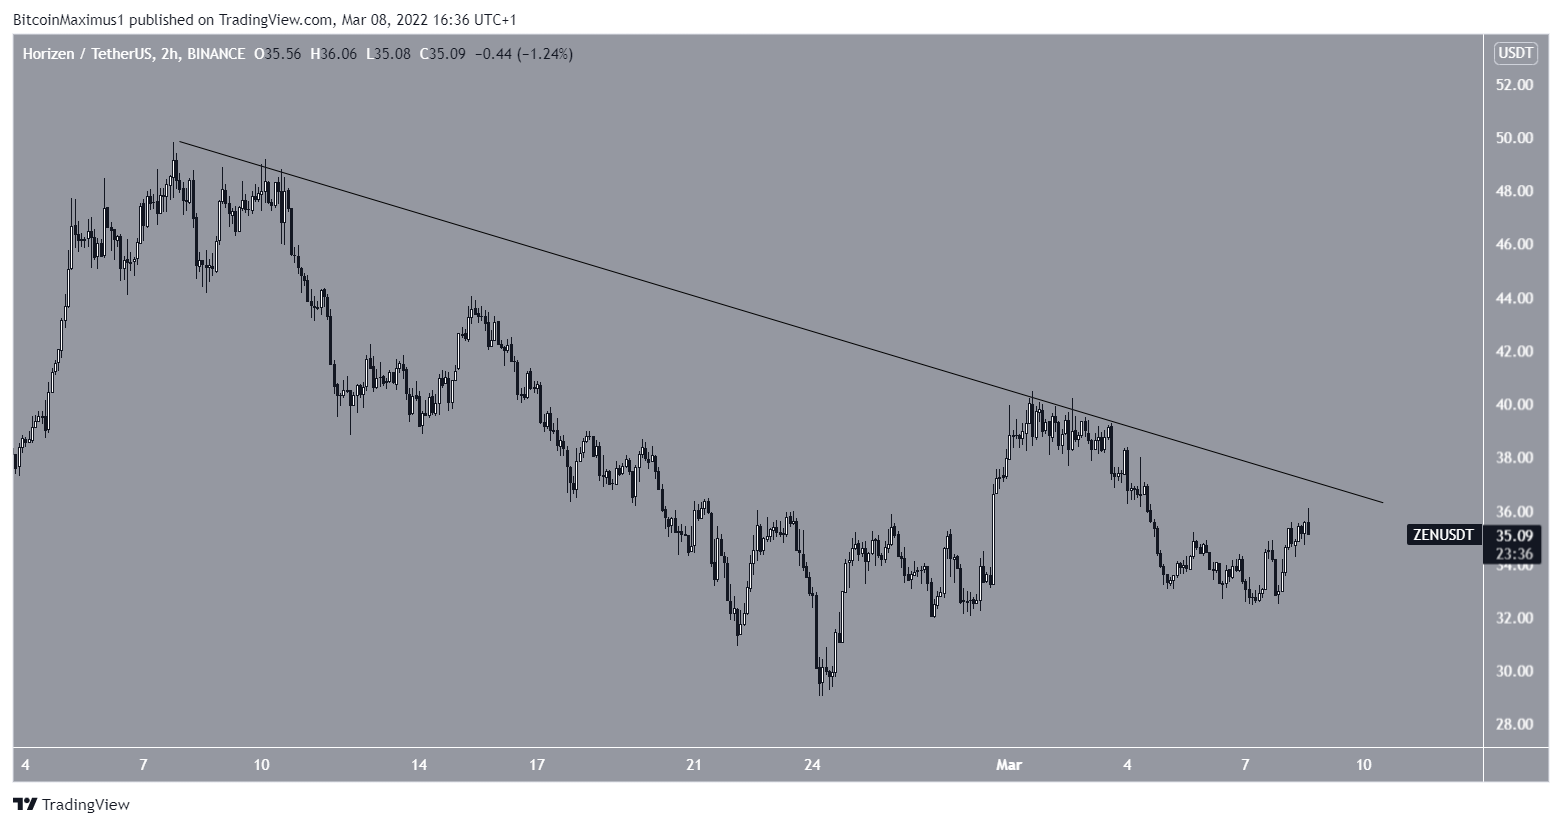
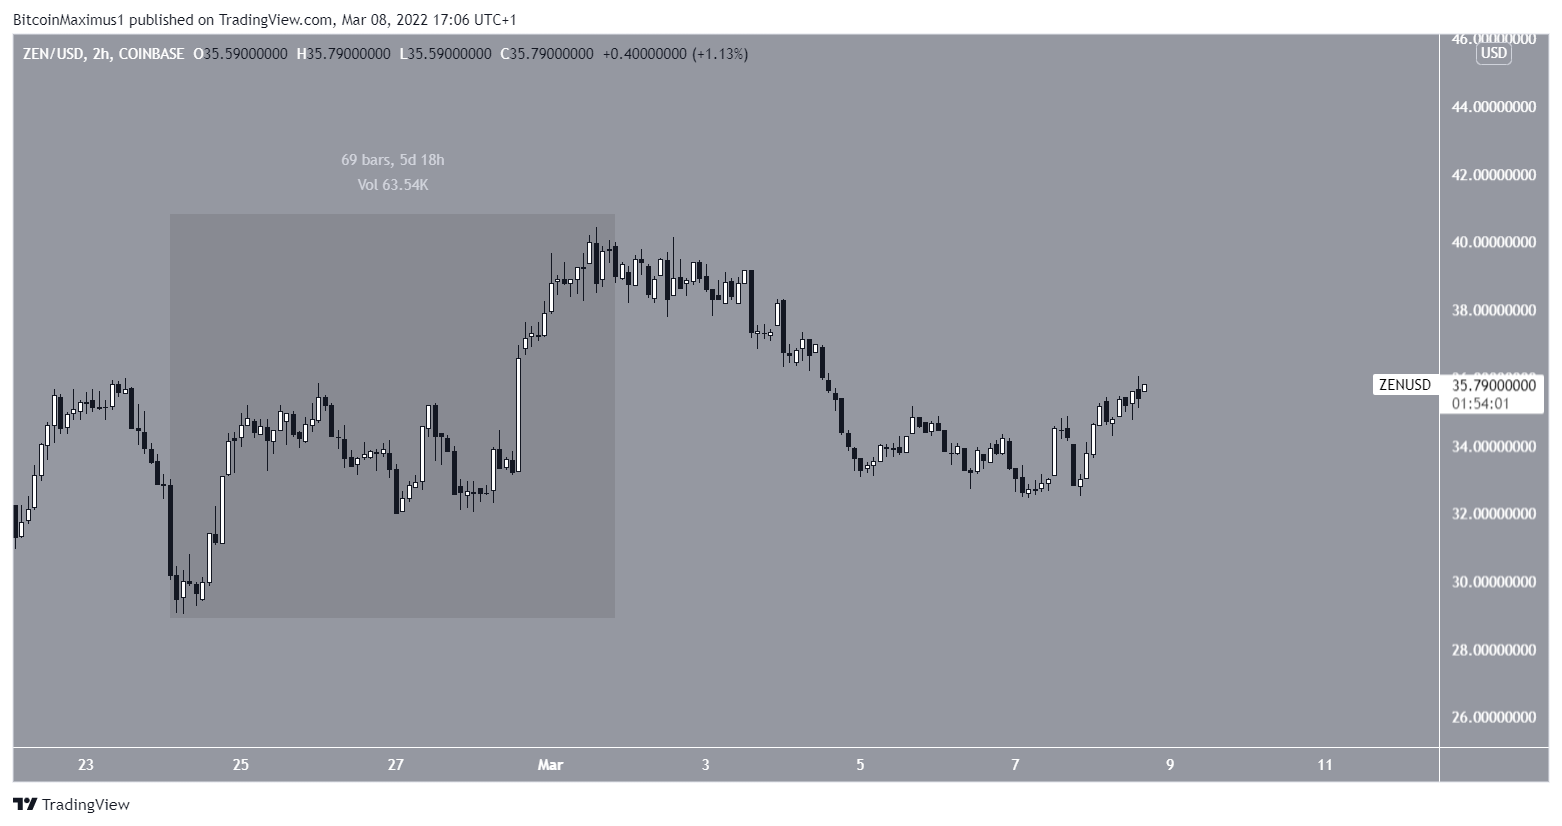
Finally, the two-hour chart shows that ZEN has been following a descending resistance line since Feb 7. The rate of increase is likely to accelerate once the price manages to break out from this resistance level.
Wave count analysis
Cryptocurrency trader @TheTradingHubb tweeted a chart of ZEN, stating that the price might have completed its correction.
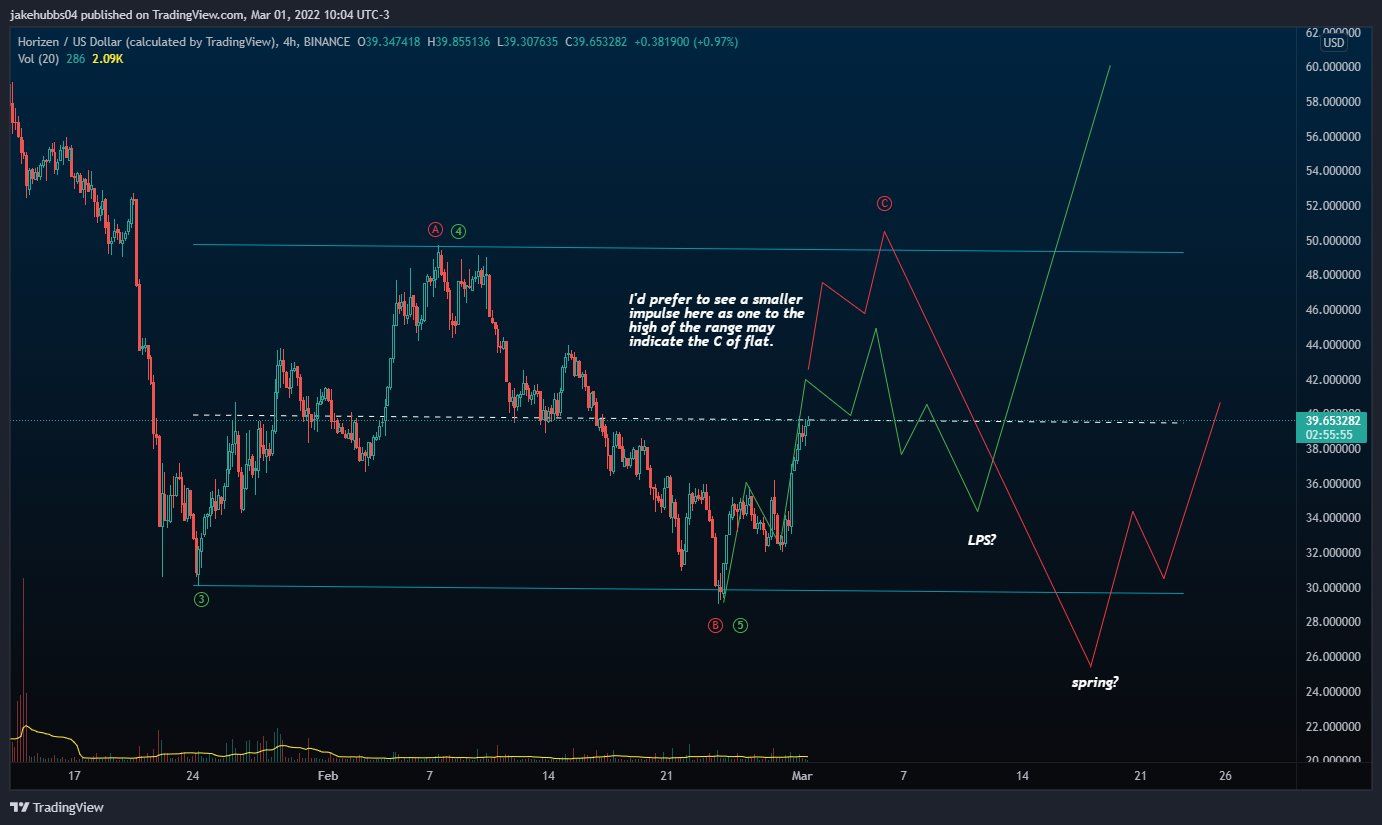
In order for the count to remain valid, ZEN has to create a higher low at the current level and bounce.
However, the increase since the Feb 24 low is clearly a three wave upward movement, suggesting that it is corrective.
As a result, it seems unlikely that it is the beginning of a longer-term bullish trend reversal.
For BeInCrypto’s latest Bitcoin (BTC) analysis, click here



