


Be[in]Crypto takes a look at the five cryptocurrencies that decreased the most last week, more specifically, from Aug 26 to Sept 2.
These cryptocurrencies are:
- Helium (HNT): -24.24%
- Ankr (ANKR): -15.30%
- Avalanche (AVAX): -14.74%
- Arweave (AR): -14.70%
- STEPN (GMT): -11.84%
HNT
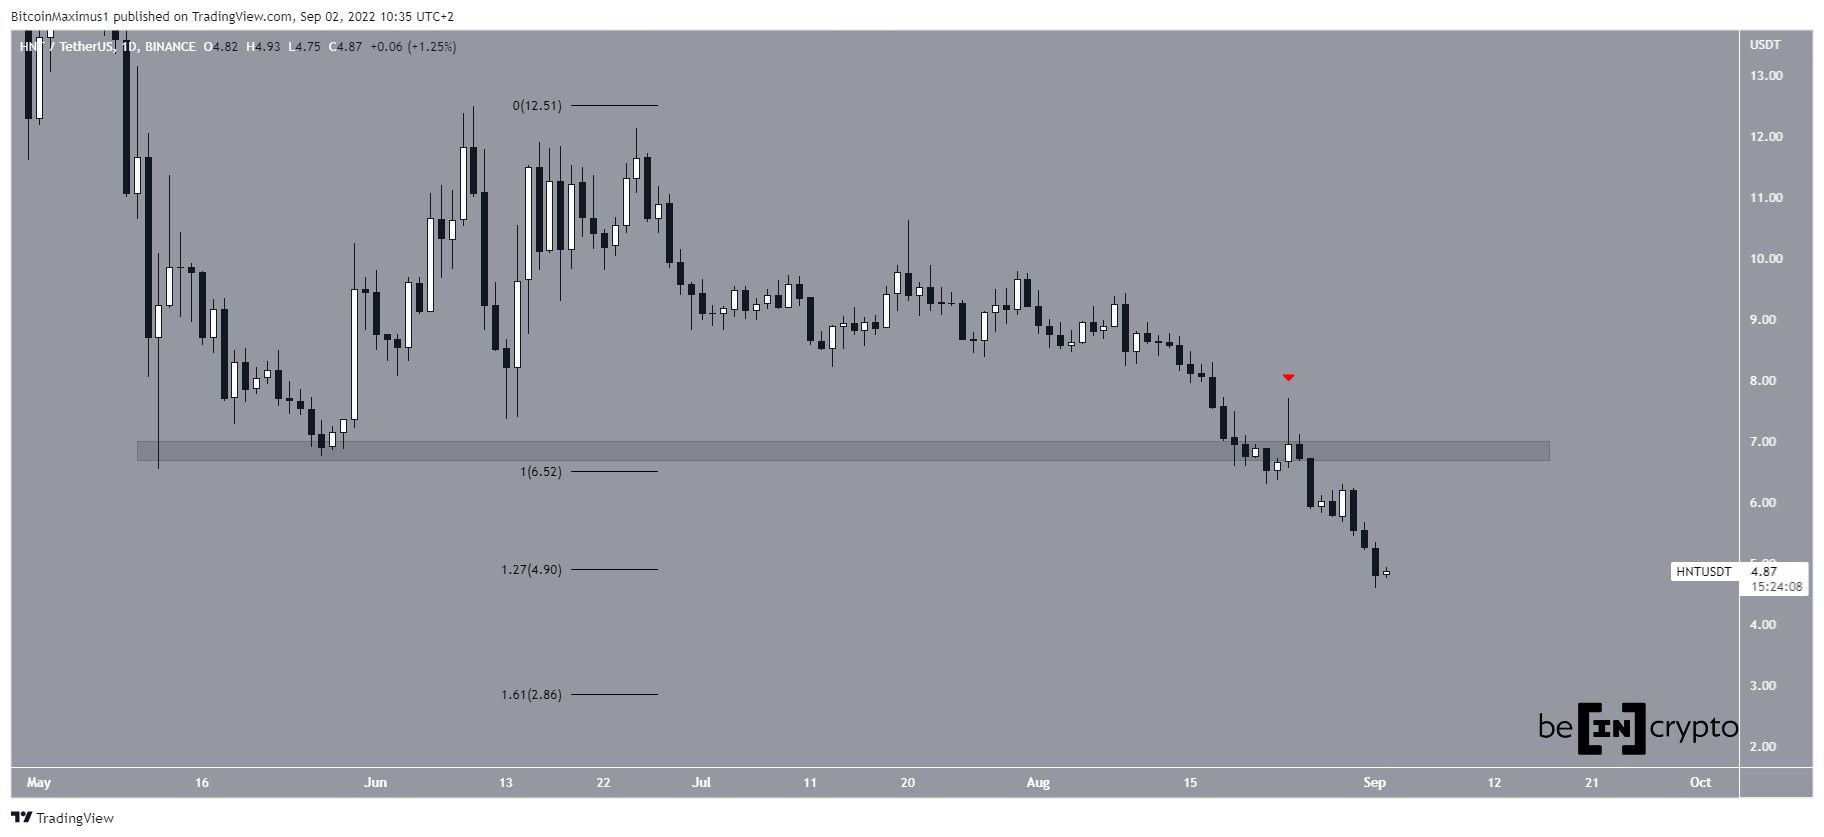
HNT has been decreasing since reaching a high of $12.50 on June 10. It created a lower high on June 25 before accelerating its rate of decrease.
On Aug 22, HNT broke down from the $6.80 horizontal support area and validated it as resistance (red icon).
Since then, it has been fallen at an even more accelerated rate and has so far reached a low of $4.60 on Sept. 1.
Using an external retracement on the previous bounce, the closest support area seems to be at $2.85.
ANKR
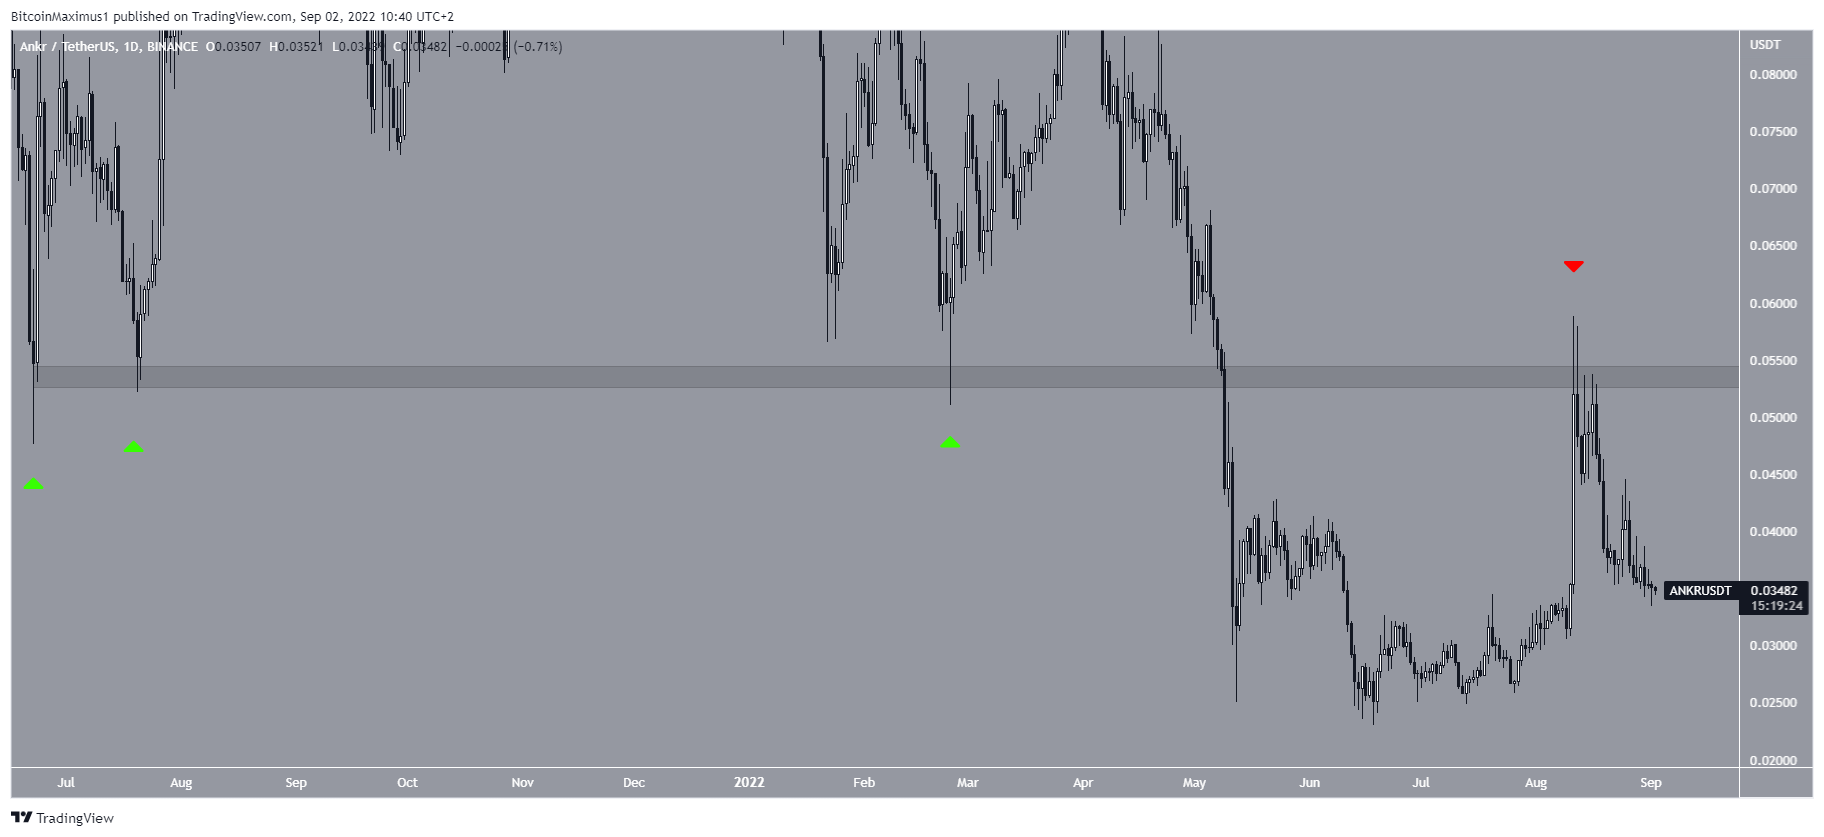
On May 12, ANKR broke down from the $0.054 resistance area. Previously, the area had acted as support since July 2021.
Afterward, the price began an upward movement and reached the area once more. However, it was rejected on Aug 11 (red icon).
The trend cannot be considered bullish until ANKR manages to reclaim this level.
AVAX
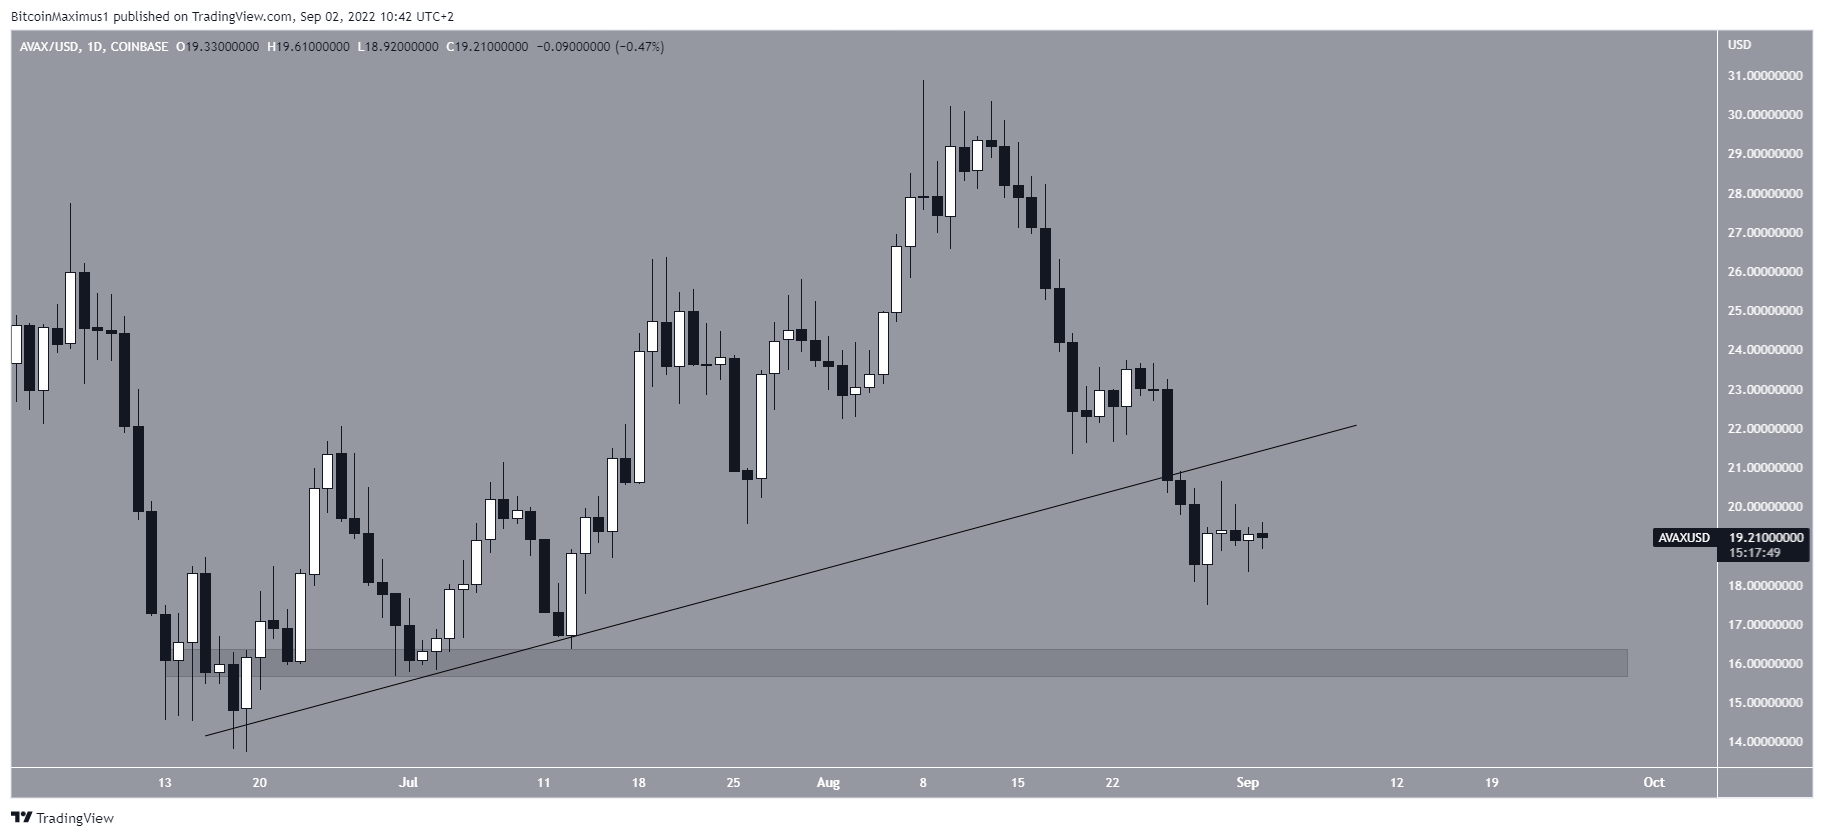
AVAX has been falling since reaching a high of $30.88 on Aug 8. On Aug 27, the downward movement caused a breakdown from an ascending support line, which had previously been in place since the May lows. This is a sign that the preceding upward movement has now ended.
If the downward movement continues, the closest support area would be at $16, created by those same May lows.
AR
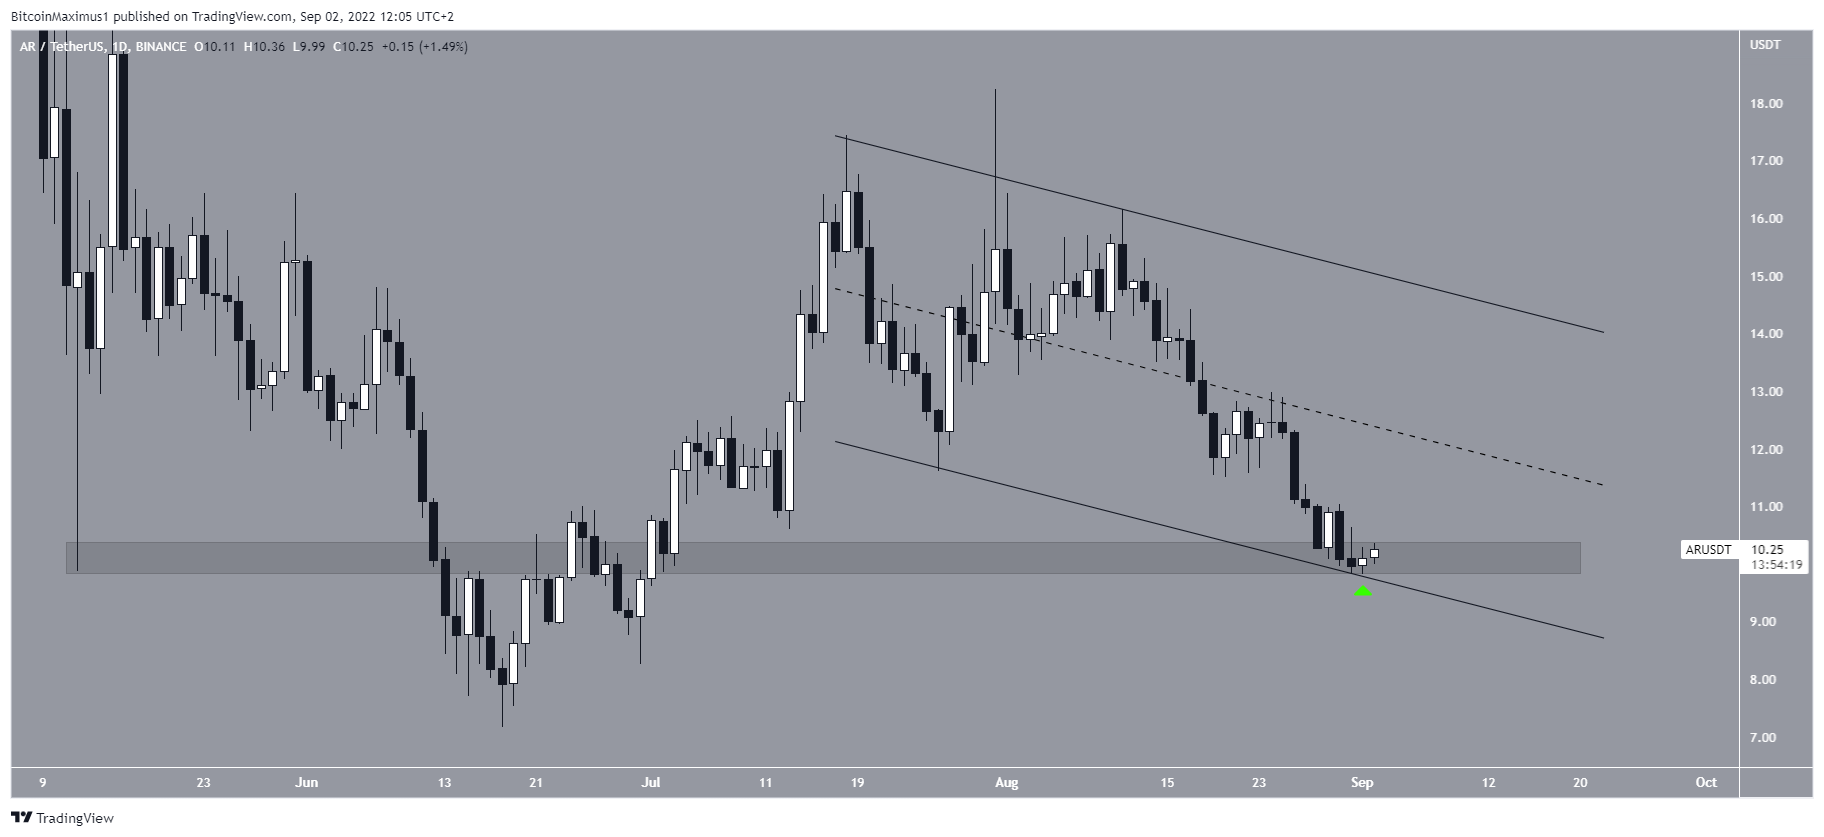
AR has been decreasing inside a descending parallel channel since July 31. Such channels usually contain corrective movements, meaning that a breakout from it would be expected.
On Aug 31, AR bounced at the support line of the channel and the $10 horizontal support area. Due to the confluence of these support levels, it is possible that AR will initiate a significant bounce at this level.
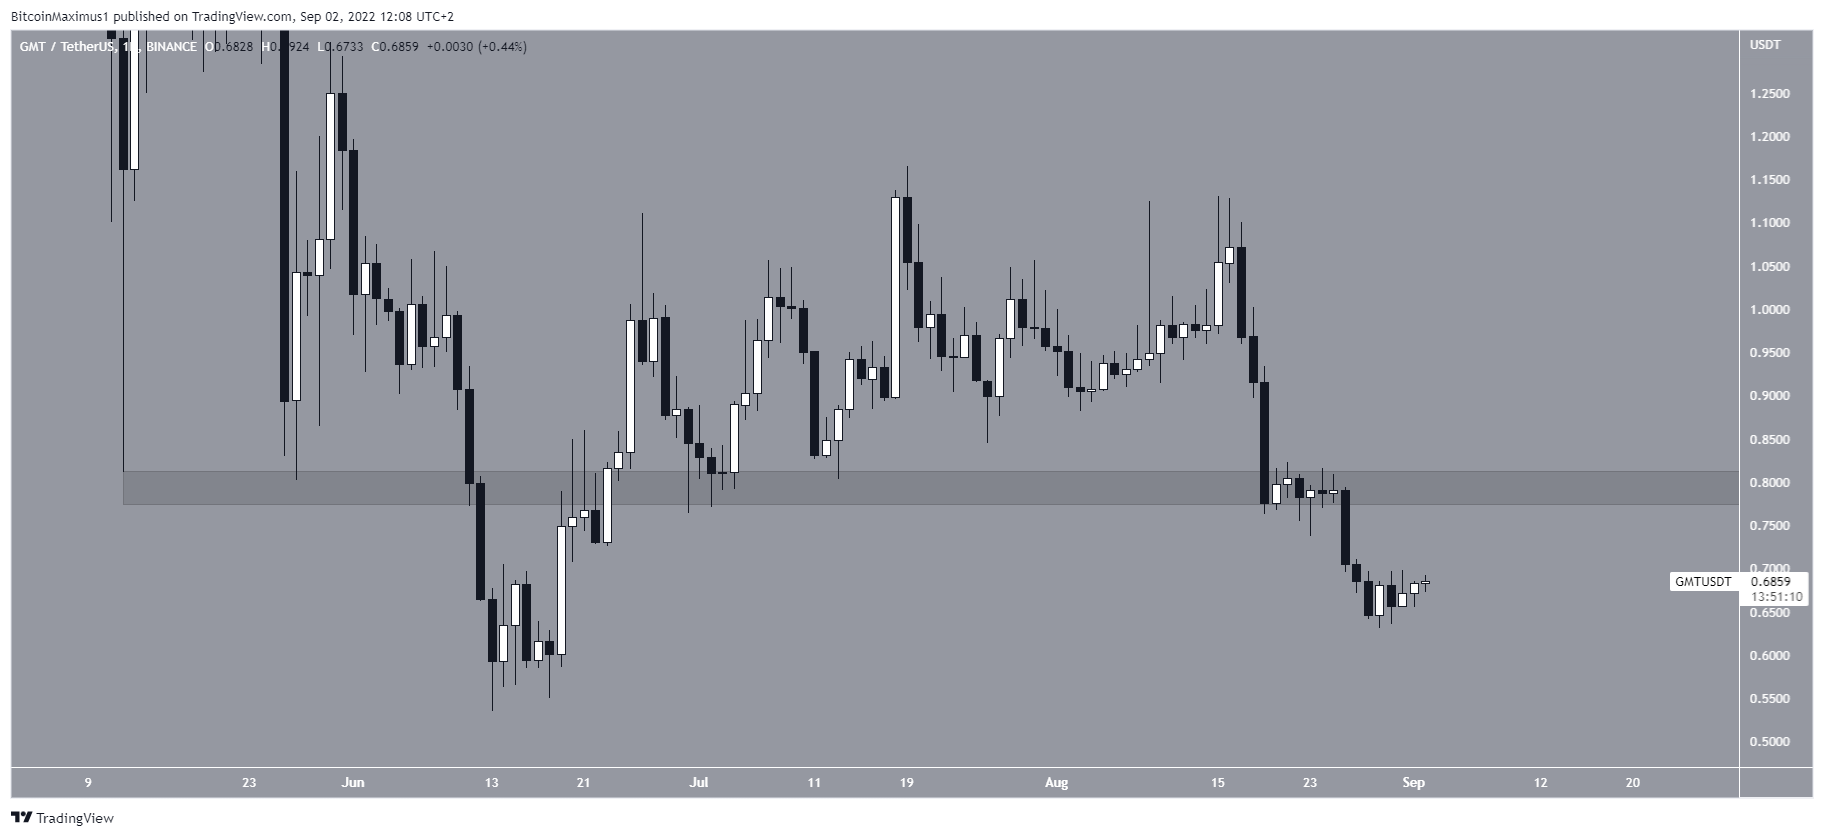
GMT
GMT has been falling at an accelerated rate since reaching a lower high on Aug 16. The downward movement caused a breakdown from the support area on Aug 26.
Similarly to ANKR, the trend cannot be considered bullish until GMT reclaims this level. Failure to do so would take GMT to new yearly lows.
For Be[in]Crypto’s latest Bitcoin (BTC) analysis, click here


