
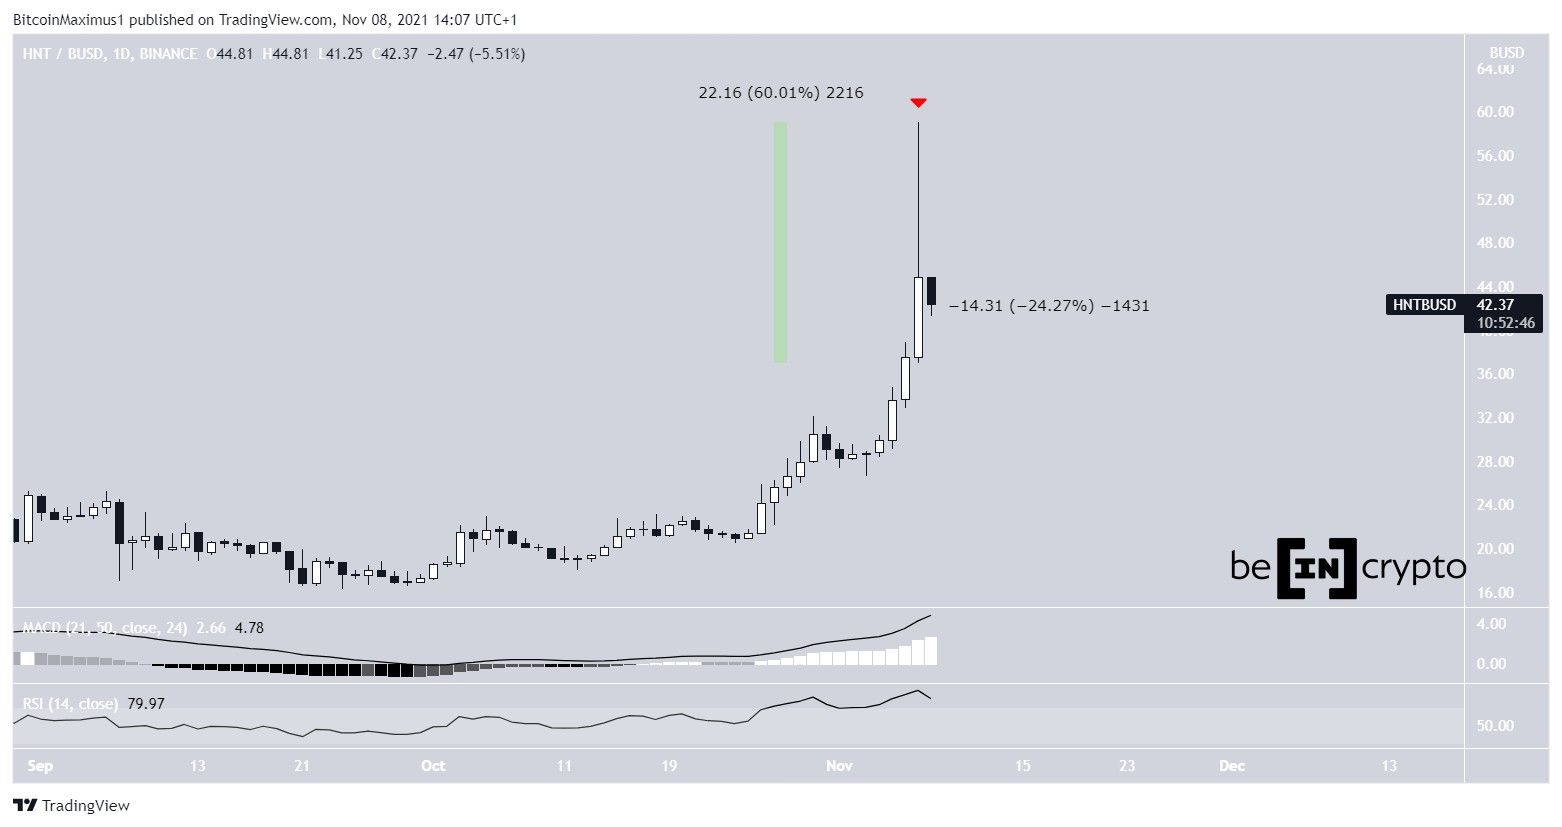
HNT was subject to a massive increase on Nov 7, at one point moving upwards by 60%. This led to a new all-time high price of $59.07.
However, the higher prices could not be sustained and HNT created a long upper wick with a magnitude of 24%. This is considered a bearish since, since the price dropped due to the heavy selling pressure.
However, despite the drop, technical indicators in the daily time-frame are still bullish.
The MACD, which is created by a short- and a long-term moving average, is positive and moving upwards. This means that the short-term trend is faster than the long-term one.
The RSI, which is a momentum indicator, is above 70 and increasing. This is a sign of bullish momentum.
Therefore, there are no present signs that would indicate that the upward movement has ended.
Wave count
Cryptocurrency trader @javonmm outlined a HNT chart, stating that the token could increase all the way to $36.
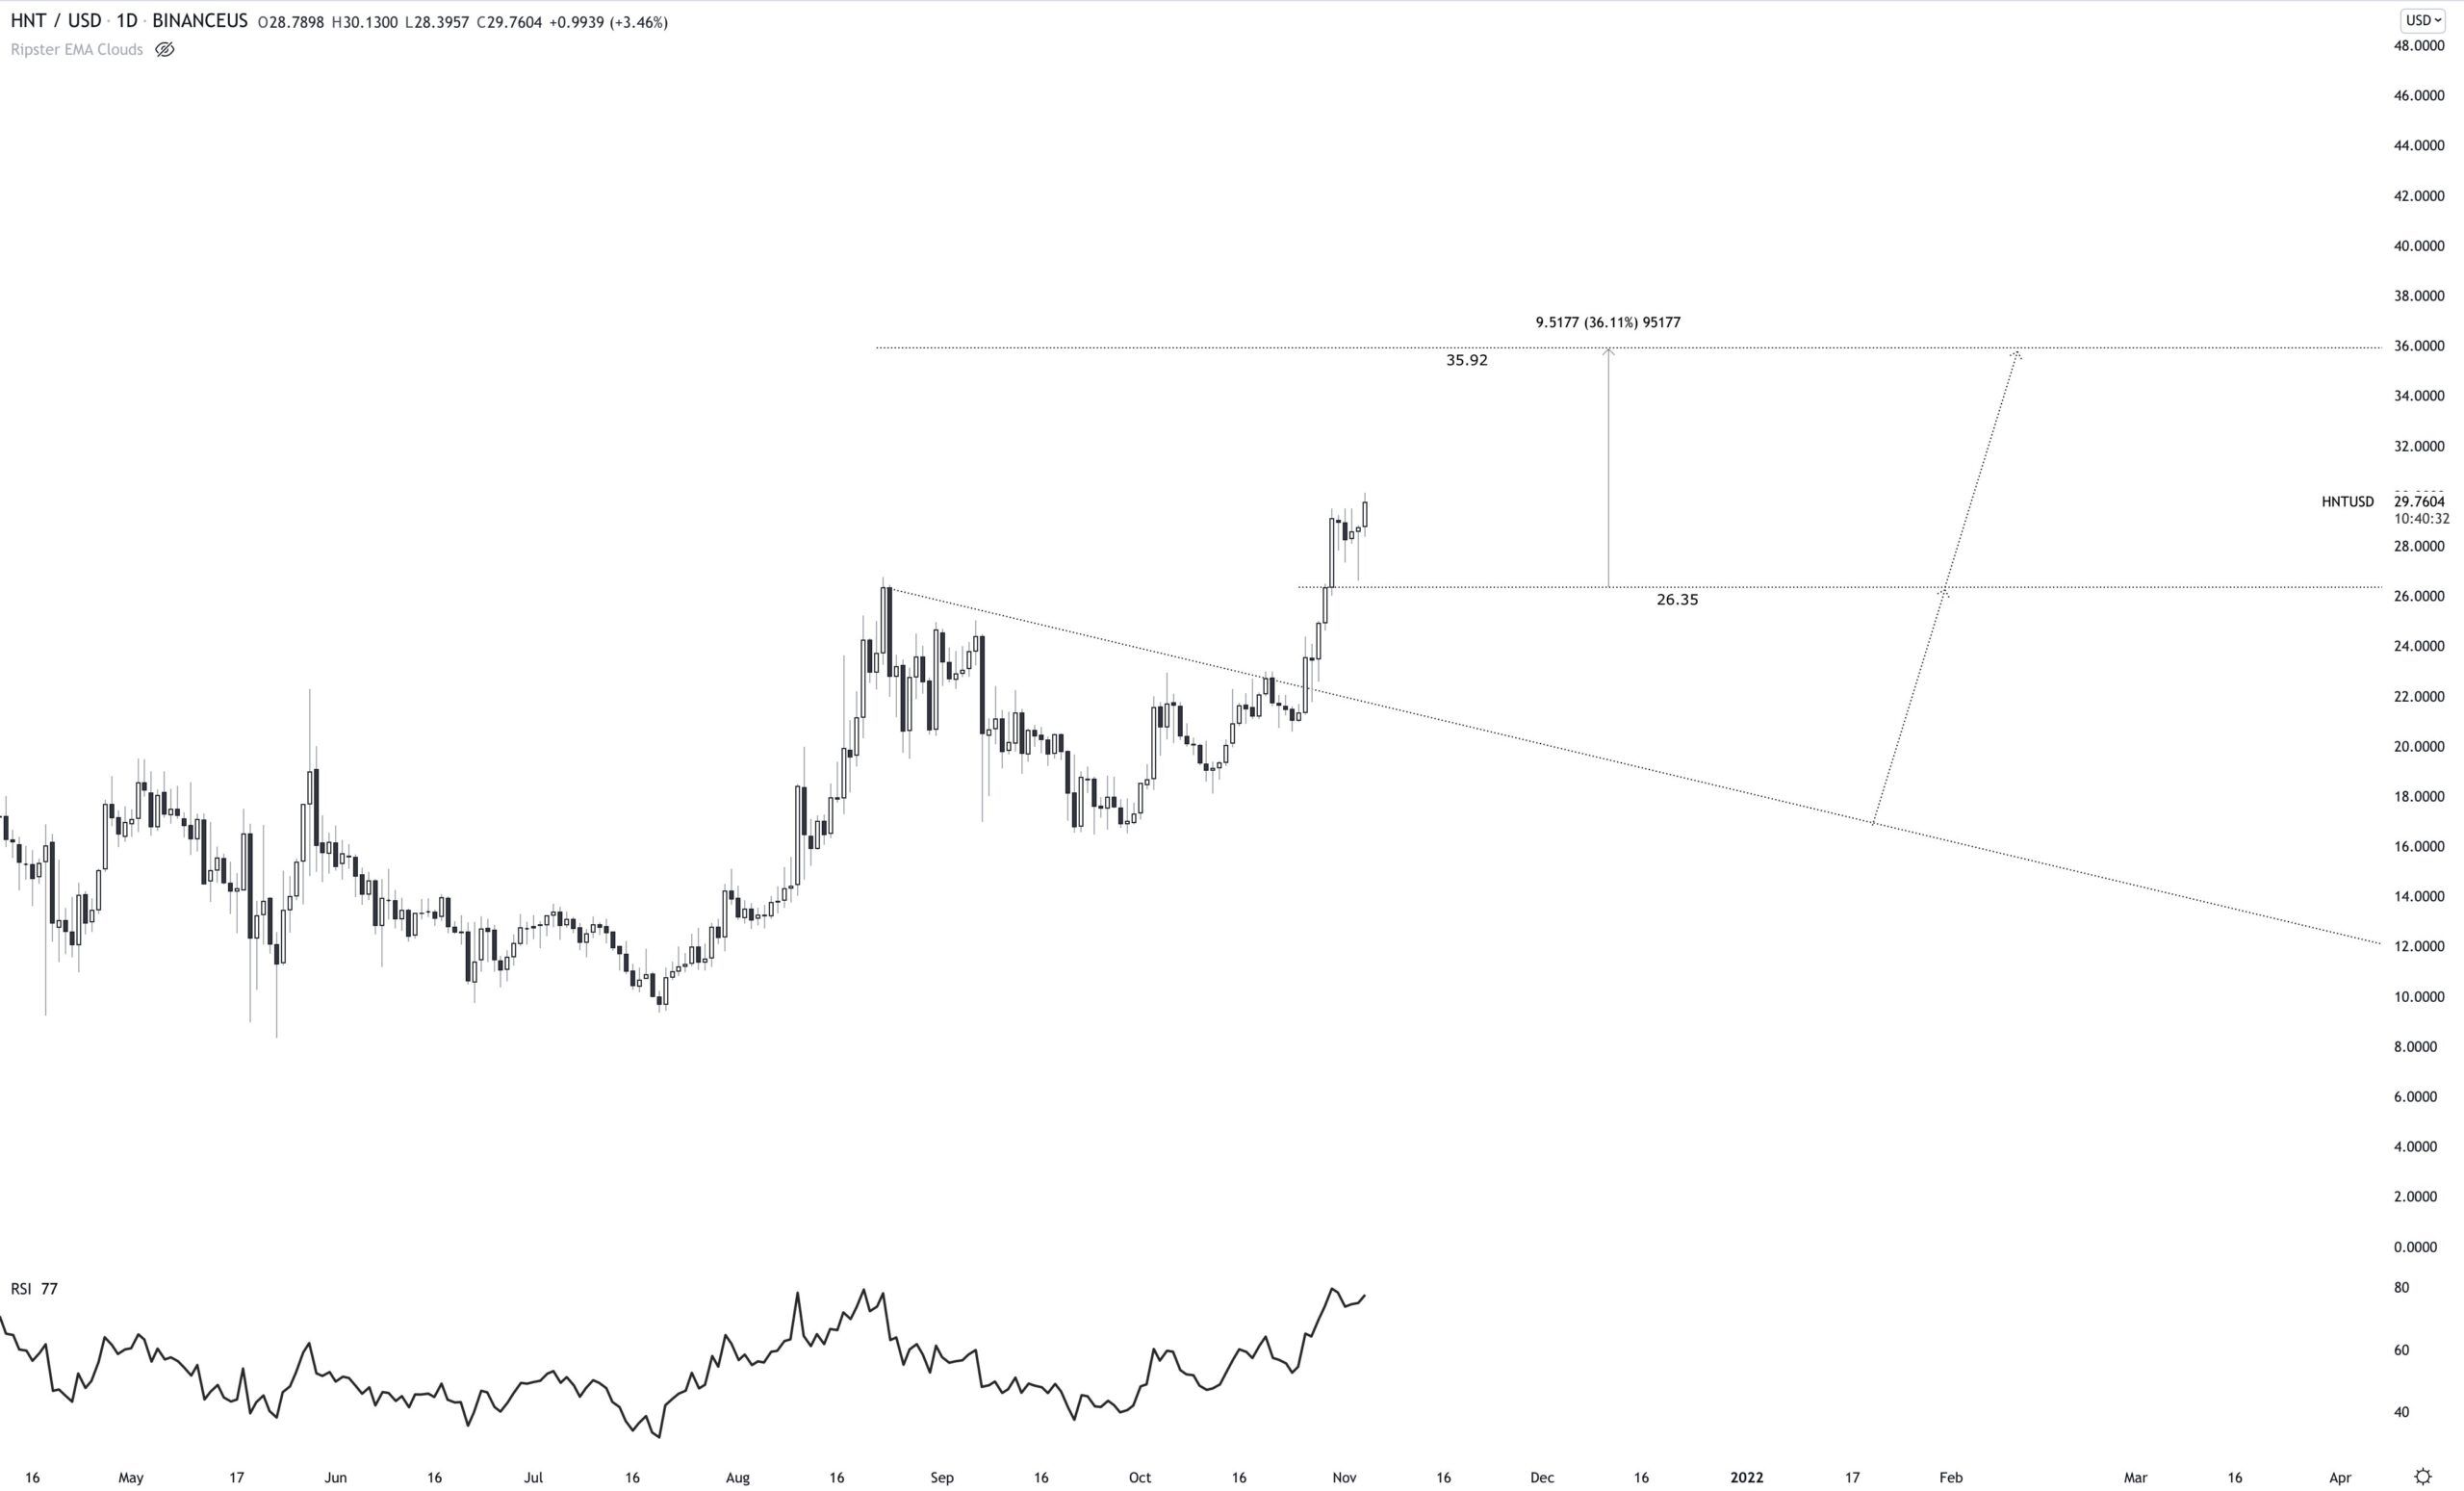
Since the tweet, HNT has moved to $36 and considerably above the level.
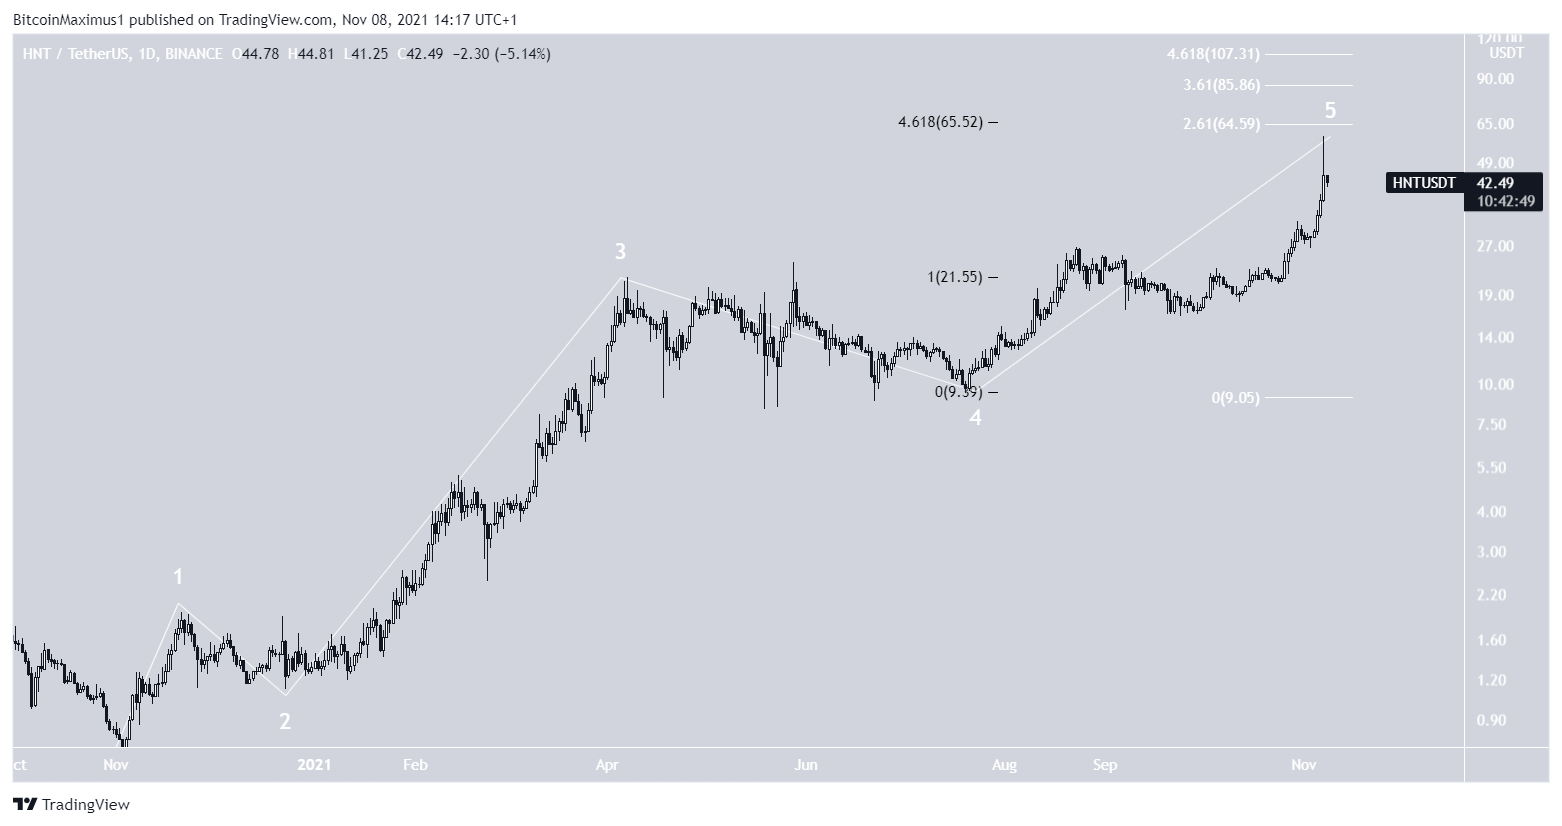
When looking at the entire upward movement since Nov 2020 (logarithmic chart), it seems that HNT is in wave five of a long-term bullish impulse (white).
The most likely target for the top of the impulse is between $64.59 – $65.52. It is found by the 4.61 external Fib retracement of wave four (black) and the 2.61 projection of waves 1-3.
If the wave extends further, the next most likely targets would be at $85 and $107.
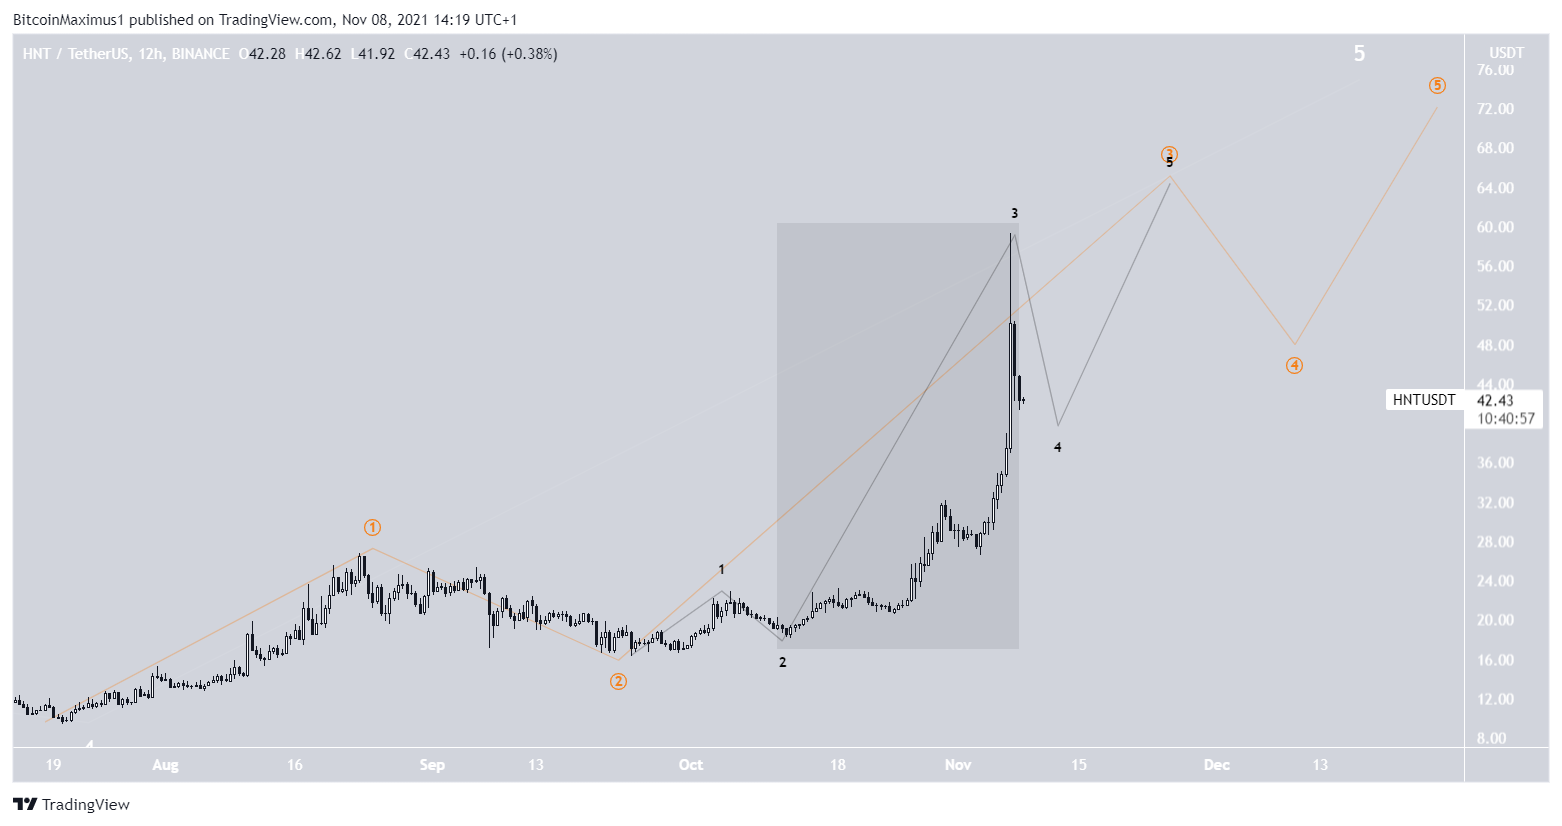
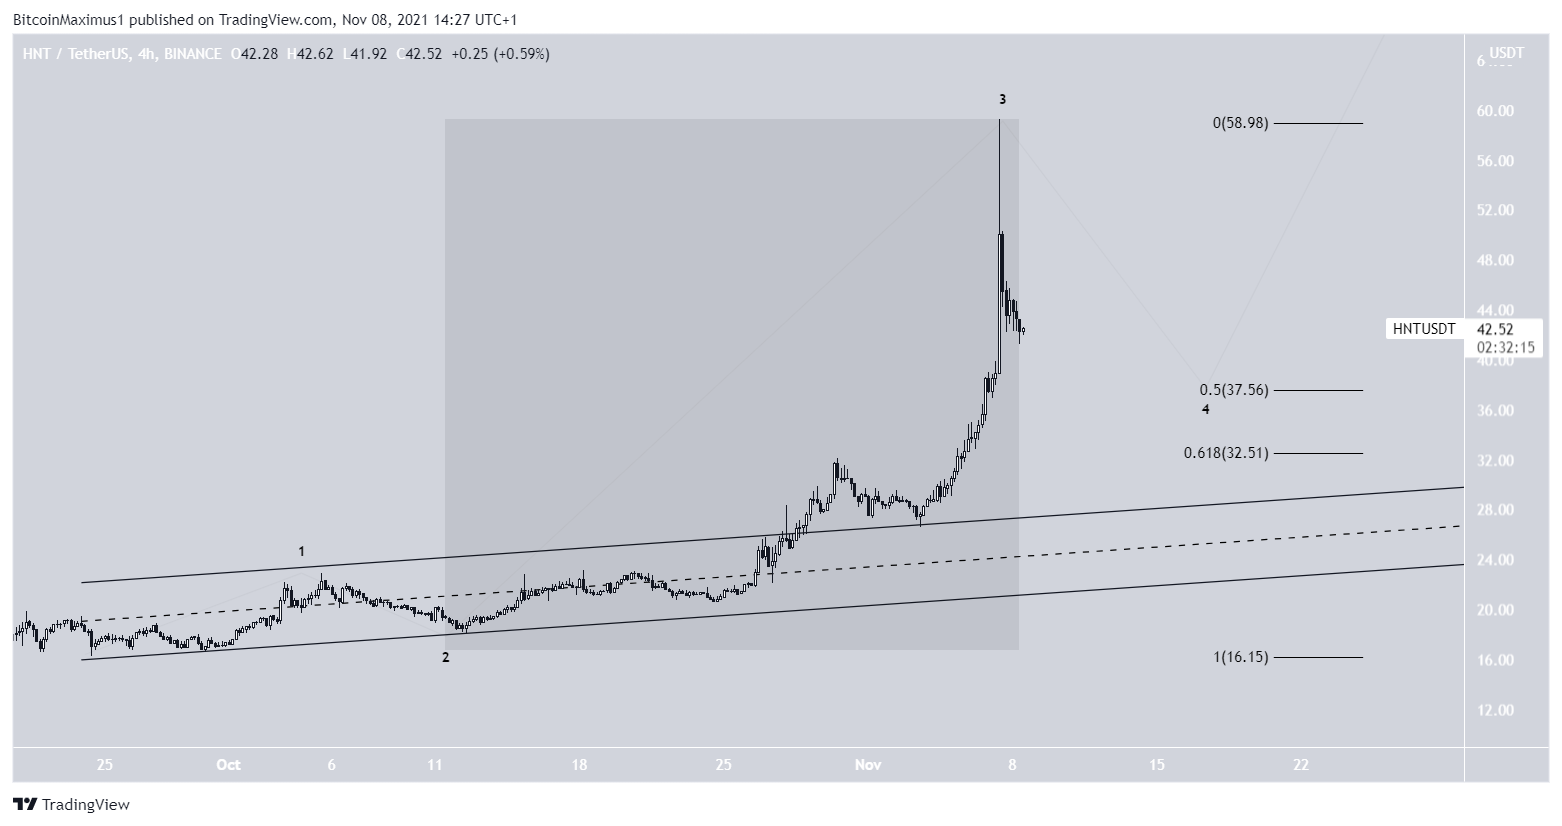
A look at the short-term chart shows an extension (highlighted) in the period between Oct 11 and Nov 16.
When taking it into account, it does not seem possible to count five waves upwards. Therefore, it does look like the upward movement has not yet come to an end.
So, HNT is expected to increase at least to $65 and potentially higher, towards the $85 and $107 targets.
Short-term movement
In order to find potential areas that are likely to act as support, a Fib retracement tool is used in the aforementioned extension.
The closest support areas are at $37.5 and $32.5. These are the 0.5 and 0.618 Fib retracement support levels. The latter also coincides with an ascending parallel channel from which HNT previously broke out.
Afterwards, the token would be expected to resume its upward movement.
For BeInCrypto’s latest Bitcoin (BTC) analysis, click here.
What do you think about this subject? Write to us and tell us!
