
Hedera price still holds a faint hope for a rebound — but the bar has been set low. After a steady week of declines, the token trades near $0.16, showing little energy to move higher. The market mood has weakened, and confidence among traders continues to slip.
For now, only one potential signal stands between HBAR and deeper losses, keeping hopes alive in what has become an increasingly bearish setup.
Bearish Indicators Stack Up: Weak Retail Flow and Fading Hype
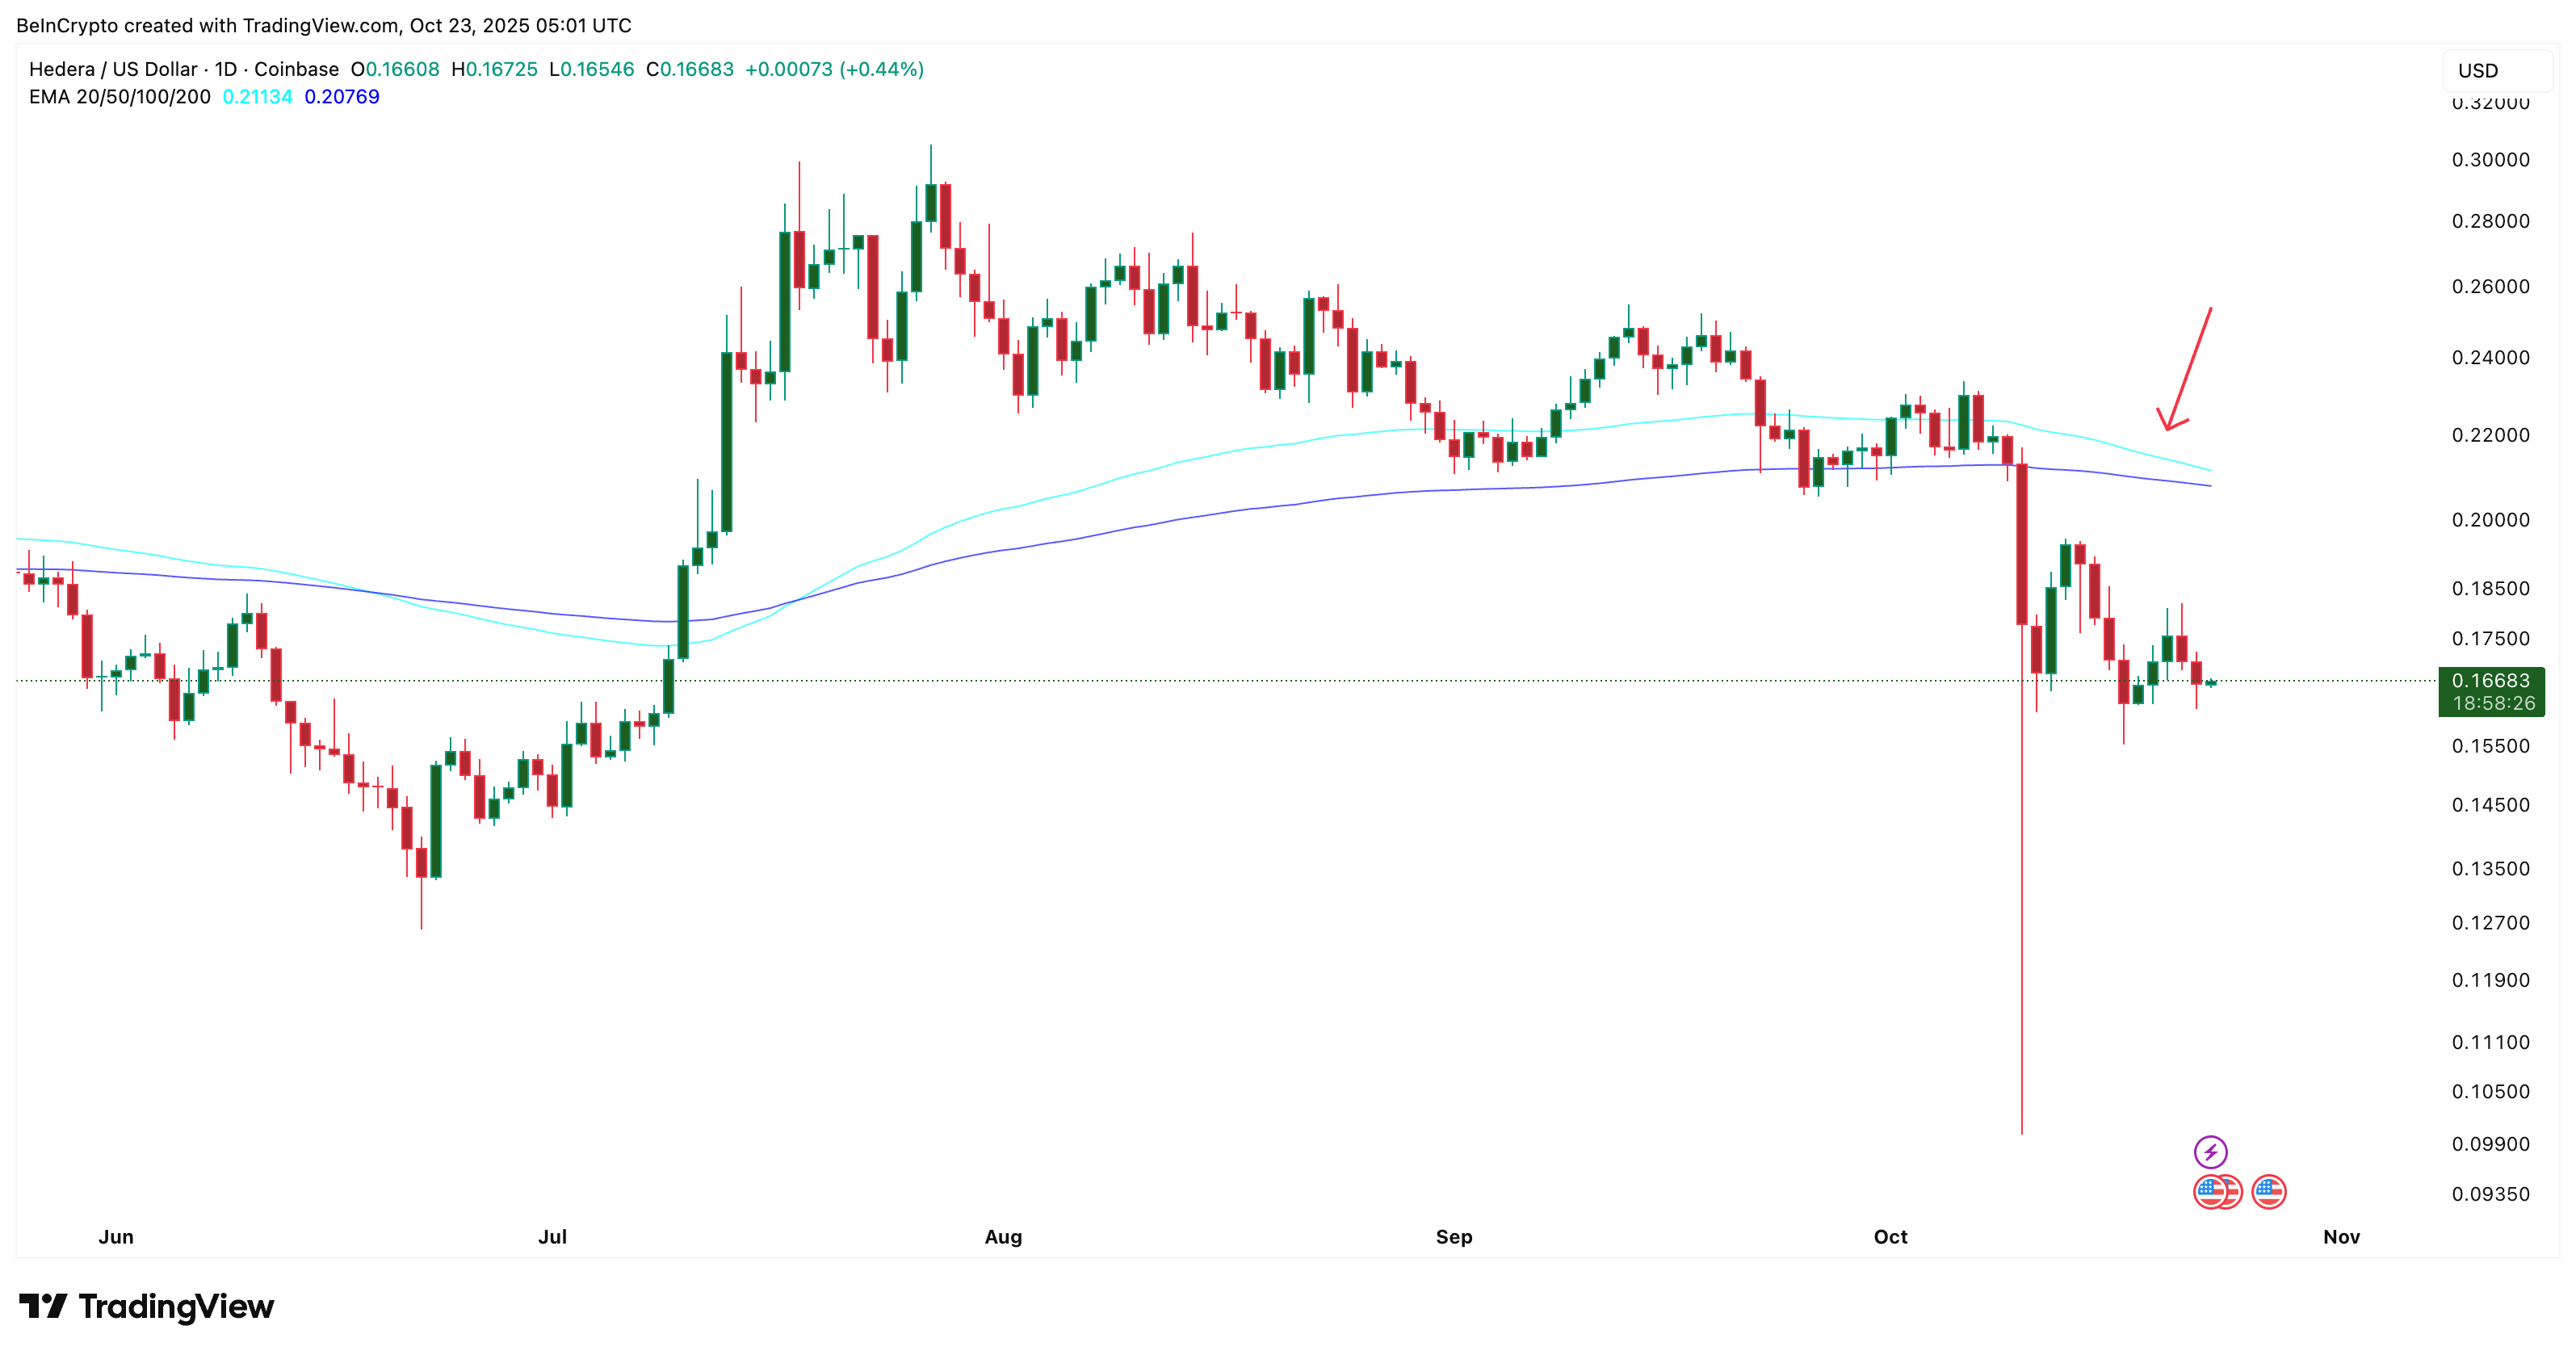
The biggest warning sign for HBAR sits right on the daily chart — a looming death cross between the 100-day and 200-day Exponential Moving Averages (EMAs). EMAs smooth out price data to show broader market direction, and a “death cross” forms when the shorter-term average dips below the longer-term one. It often signals that selling could accelerate if the cross completes.
Want more token insights like this? Sign up for Editor Harsh Notariya’s Daily Crypto Newsletter here.
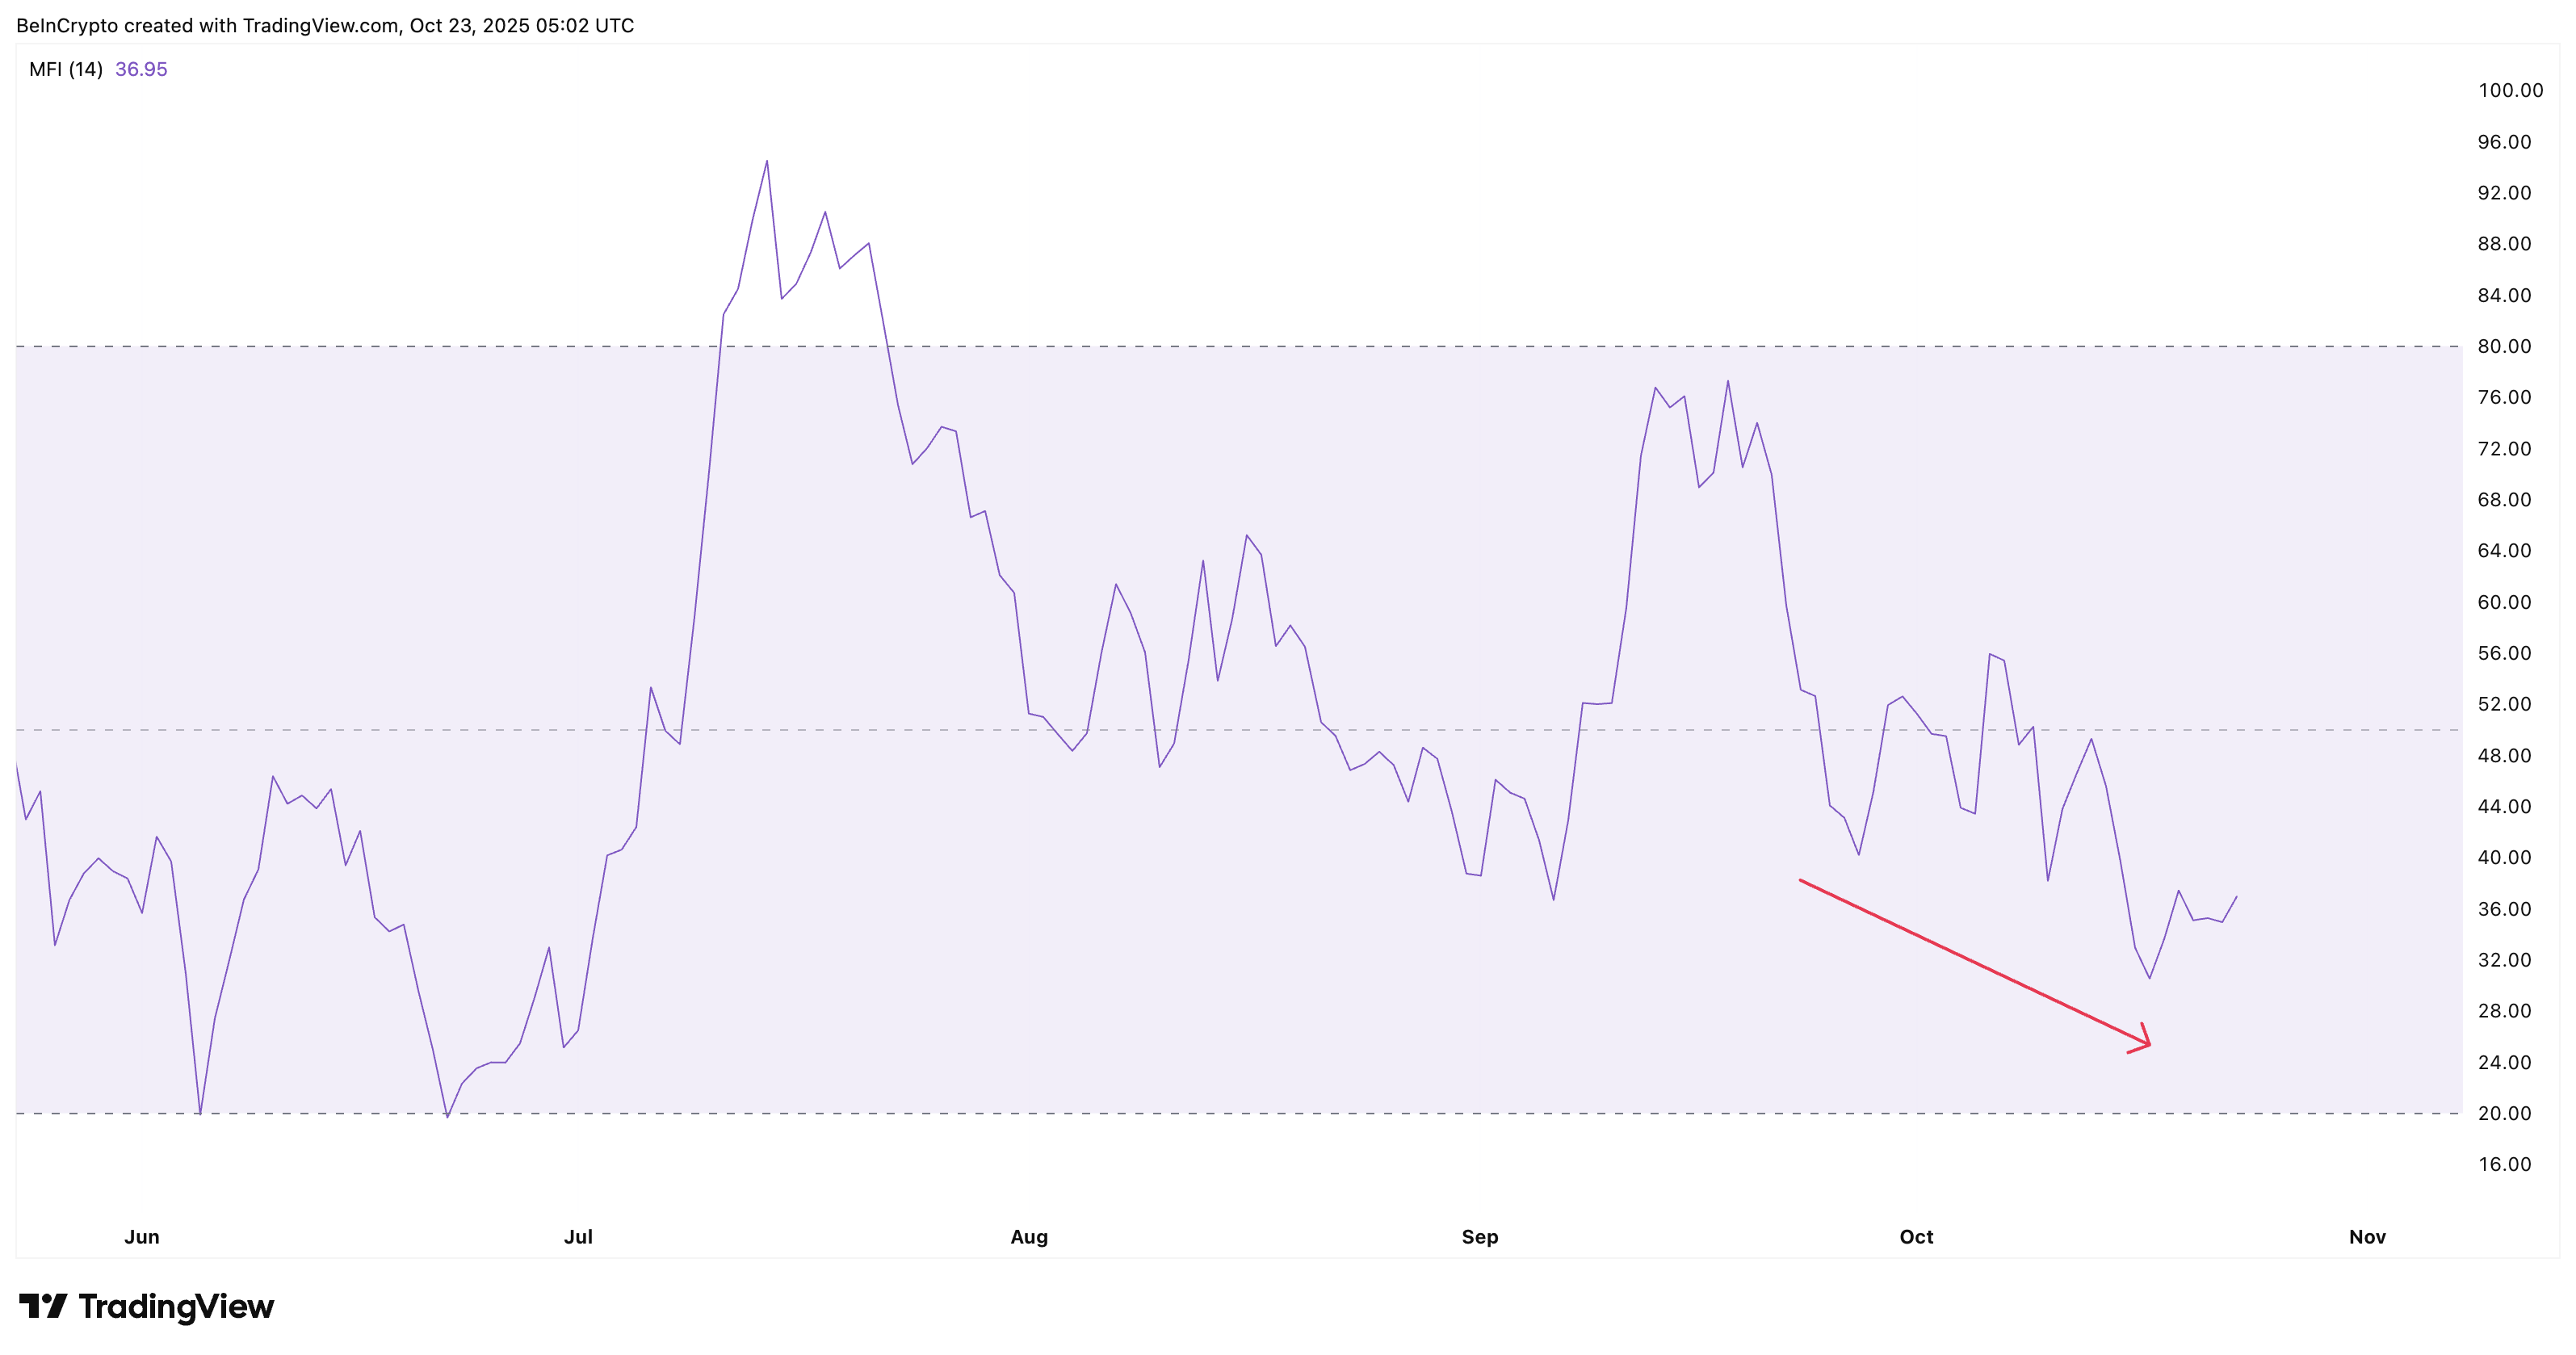
Money Flow Index (MFI), which tracks the flow of money in and out of an asset using both price and volume, supports the weakness. Since mid-July, MFI has been trending lower. It stood near 55 in early October and has now dropped to 36, showing that retail traders are no longer buying dips at a decent pace.
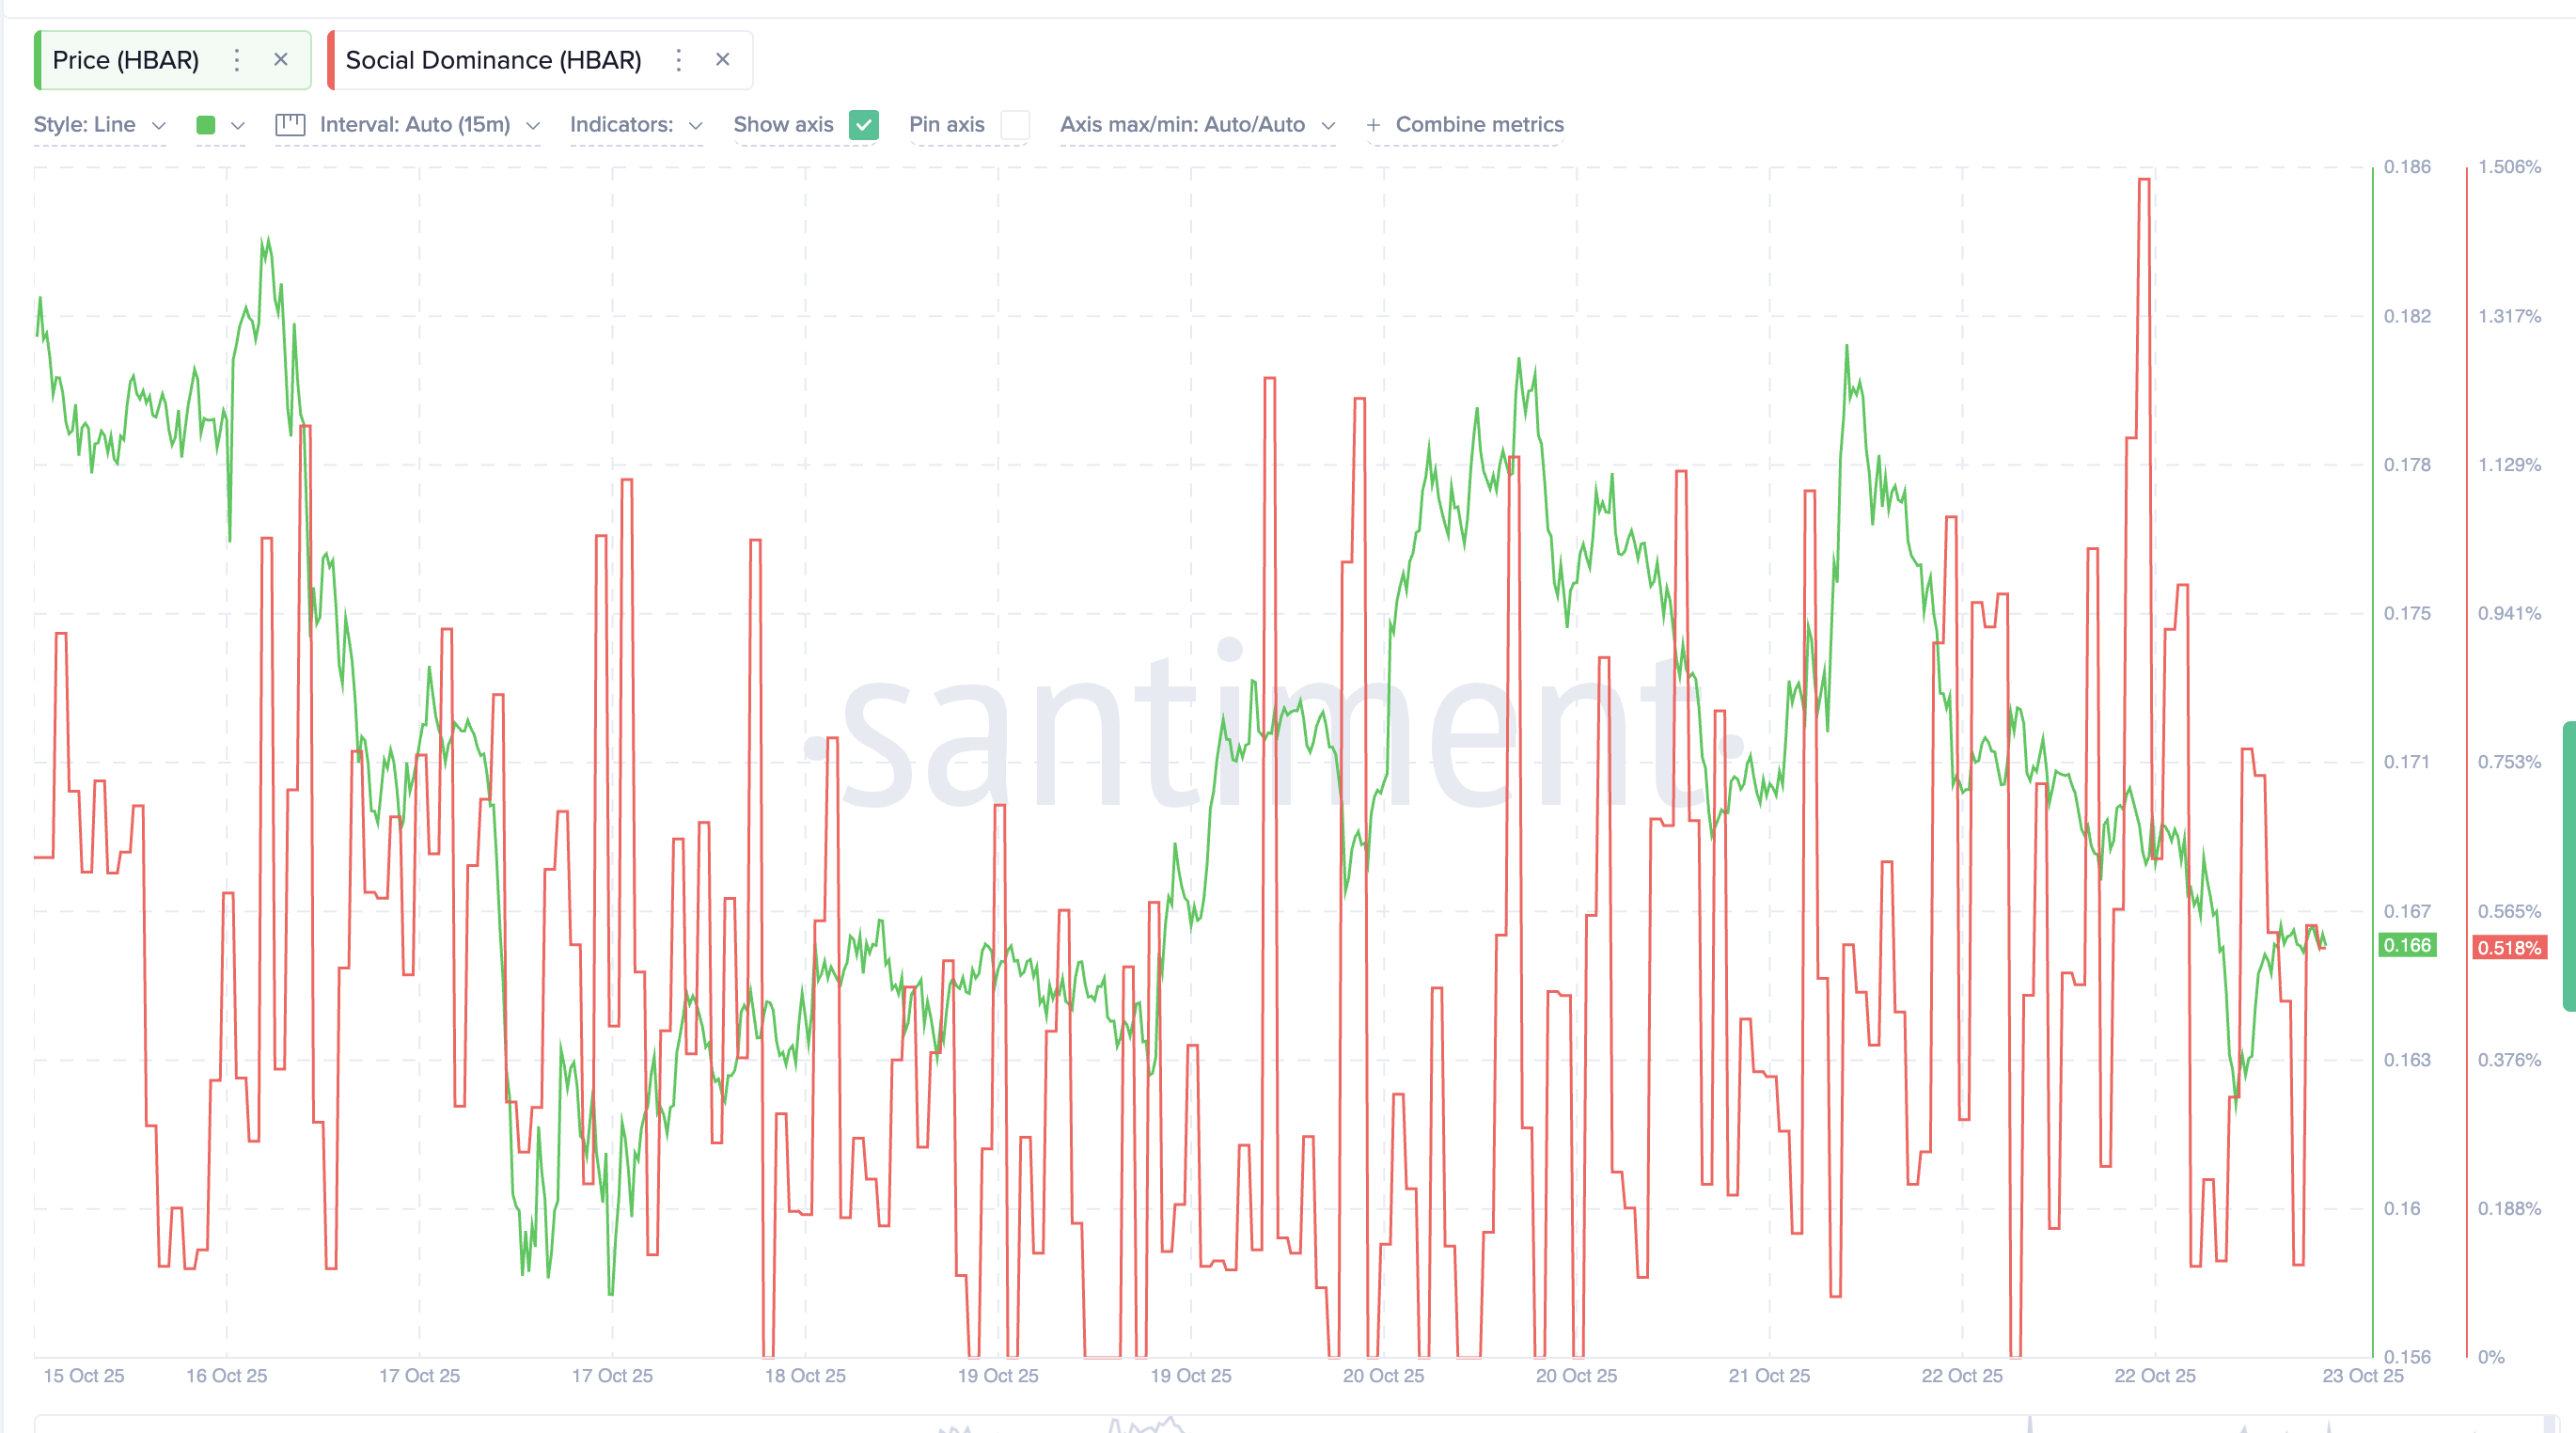
Social data adds to the slowdown. HBAR’s social dominance, which measures its share of total crypto discussions, hit a weekly peak of 1.49% on October 22 as excitement briefly spiked over ETF filings that featured HBAR.
But chatter cooled quickly to 0.51%, confirming that the buzz was short-lived.
Together, these metrics form a sea of bearish signals — weaker participation, fading social attention, and a technical structure that hints at further losses if buyers don’t step in soon.
One Hedera Price Rebound Hope: RSI Divergence Could Hold the Line at $0.16
Still, one indicator offers a small window of optimism. Between June 22 and October 10, HBAR’s price formed lower lows, while the Relative Strength Index (RSI) — a metric that measures the strength and speed of price movements — formed higher lows. This bullish divergence often appears when sellers start to lose control, and a reversal might follow.
If this plays out, the Hedera (HBAR) price could rise 10% to reclaim $0.18. It would be the first hurdle traders would want to see cleared. Above that, a close beyond $0.19 could open a path to $0.22.
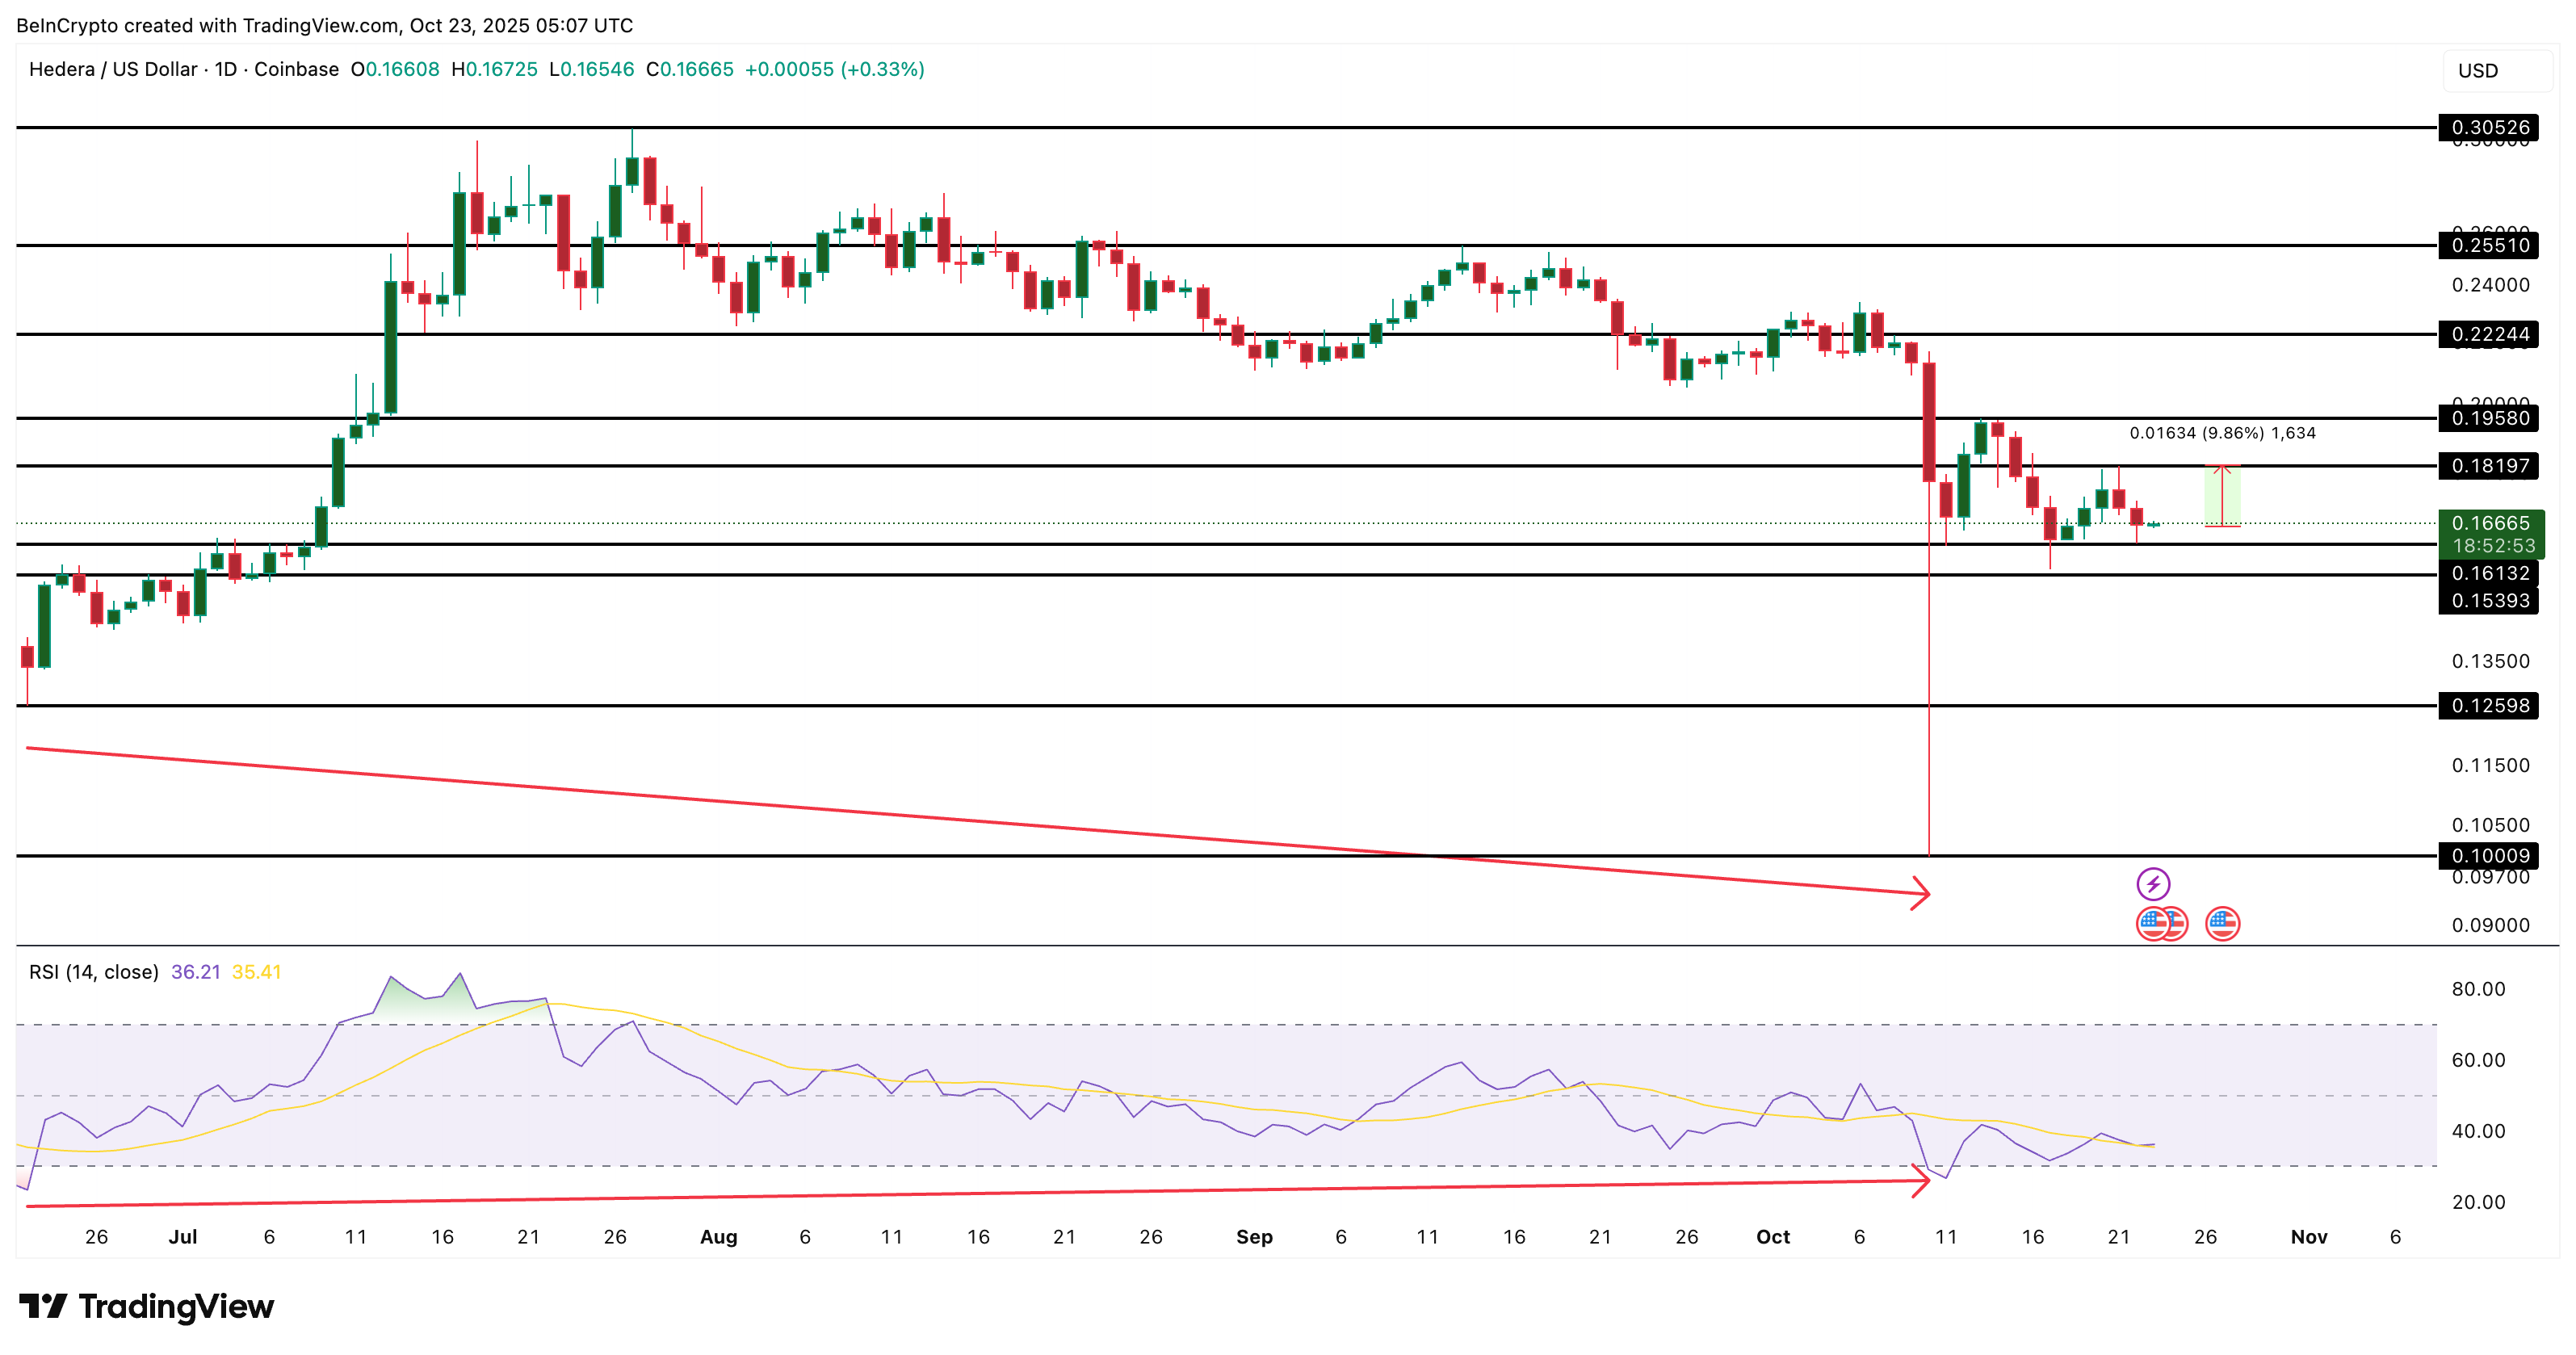
But the risk still outweighs the reward for now. $0.16 remains the key support. It is a line HBAR must defend to avoid sliding to $0.15 or even $0.12. If that happens, the ongoing death cross could push sentiment deeper into bearish territory.
