


Hedera Hashgraph (HBAR) has created a long-term bullish pattern but has yet to confirm it with a breakout from its short-term resistance.
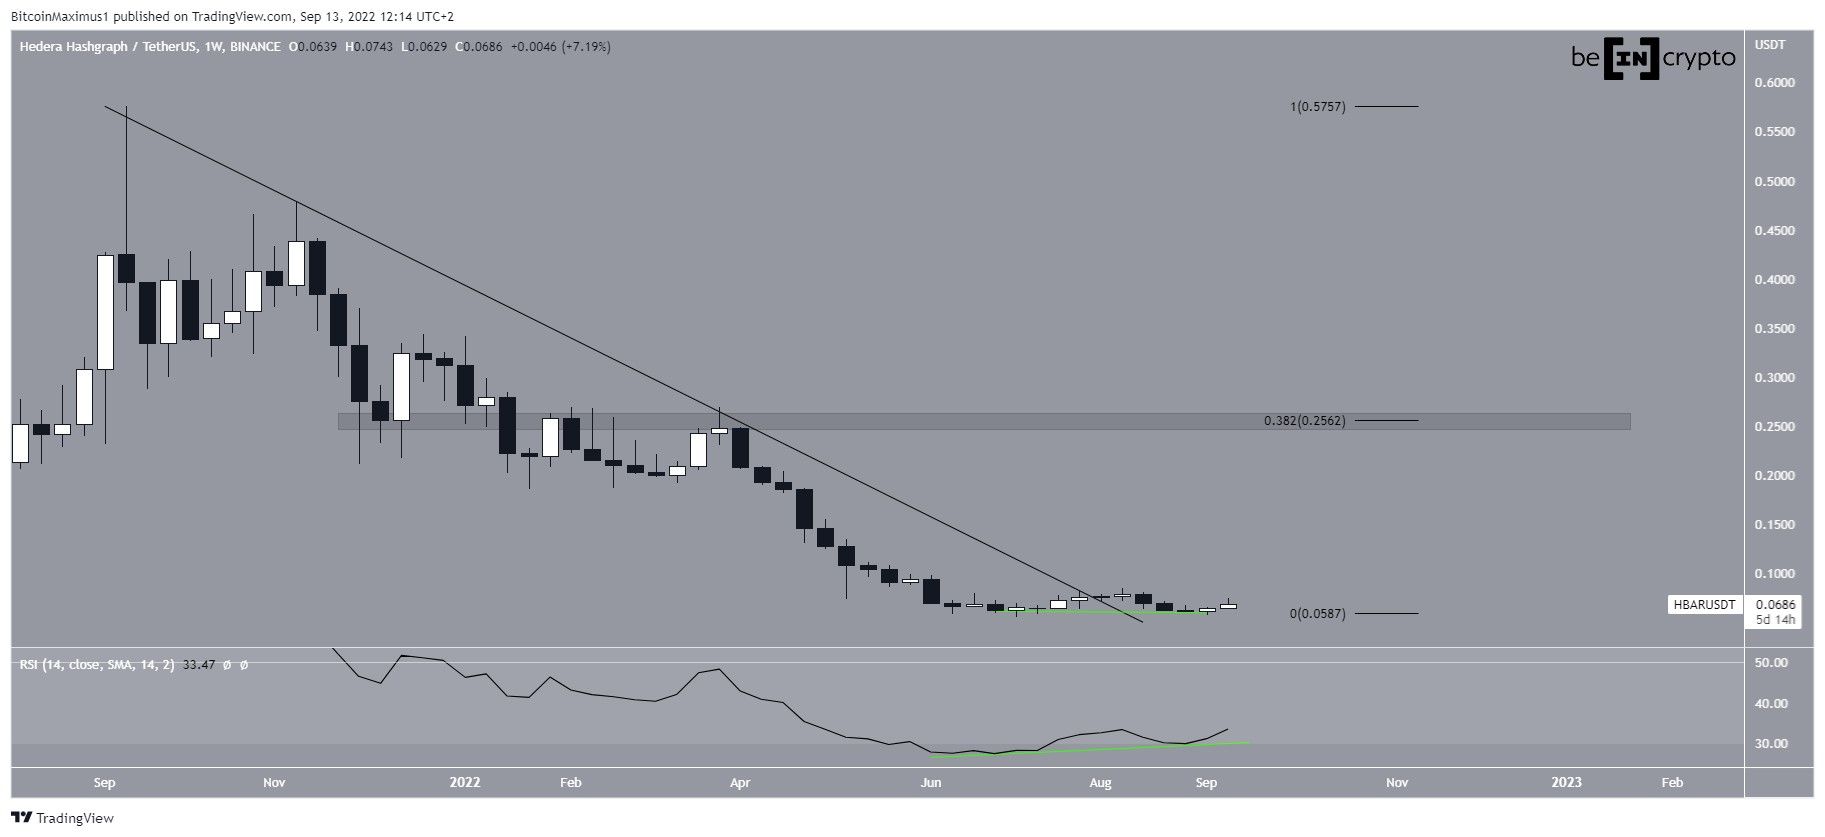
HBAR has been falling since reaching an all-time high price of $0.571 in Sept 2021. The downward movement has been contained inside a descending resistance line and has so far led to a low of $0.055 in July 2022.
Afterward, the price began an upward movement and managed to break out from the line later in July. Despite the breakout, the price failed to initiate any sort of upward movement and has returned to its pre-breakout levels since.
However, this movement created a double bottom, which is considered a bullish pattern. Additionally, the pattern has been combined with bullish divergence in the weekly RSI (green line), which has moved outside of its oversold territory. Both of these are considered strong bullish signs.
If an upward movement follows, the closest resistance area would be at $0.256, created by both a horizontal resistance area and the 0.382 Fib retracement resistance level.
Ongoing bounce
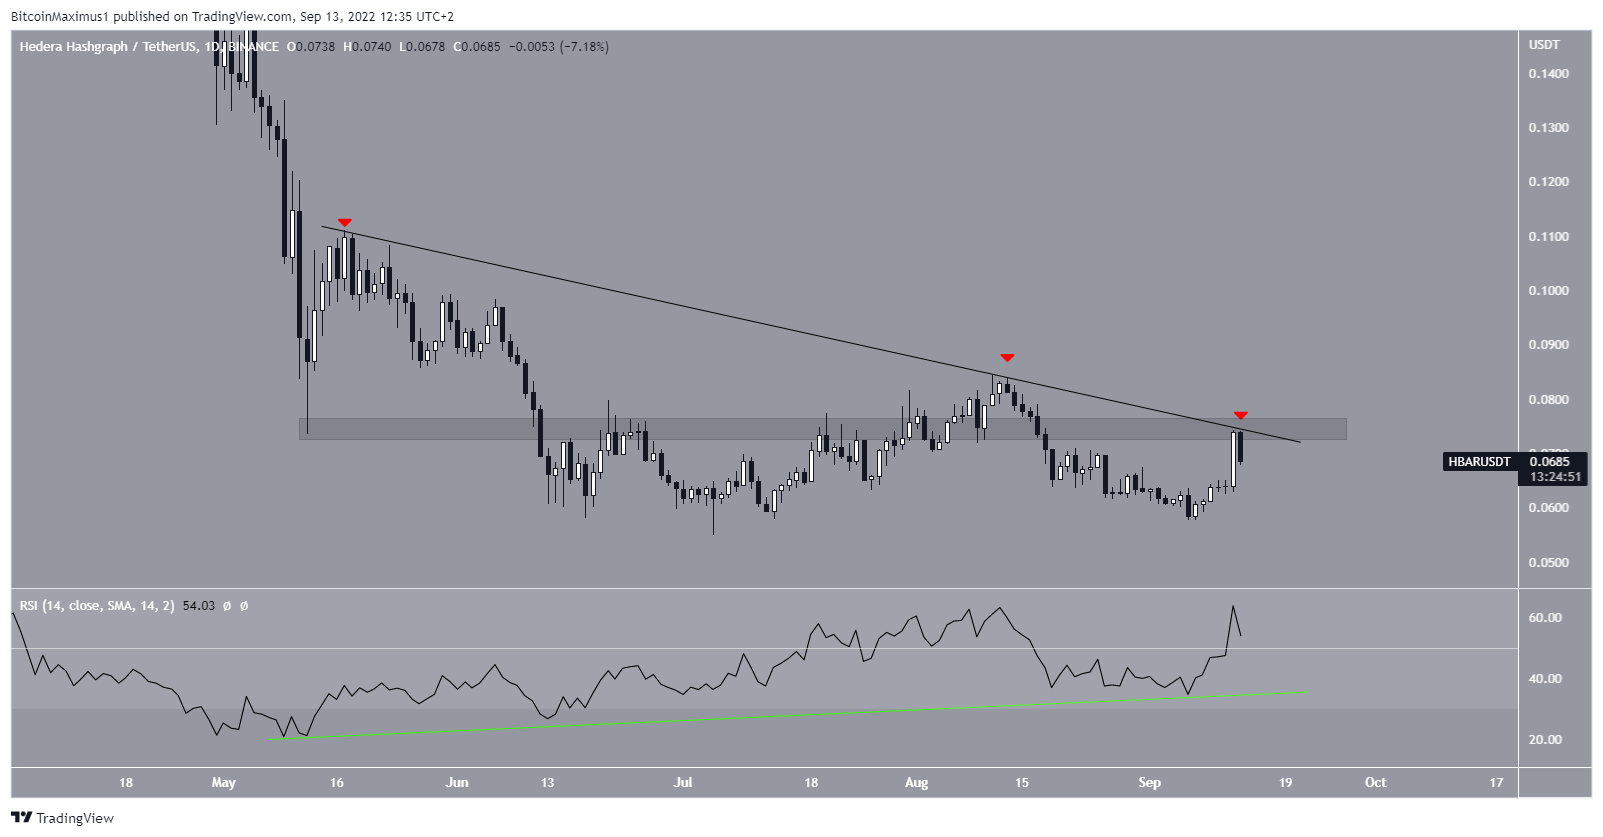
On Monday, Coinbase announced that it would support the USD and USDT pairs for HBAR starting the next day. The announcement was followed by a sharp pump in the price.
However, the pump failed to initiate a breakout from a descending resistance line, which has been in place since May. This was the third failed attempt at breaking out (red icons). The resistance line also coincides with the $0.072 horizontal resistance area.
Despite the failure to break out, the daily RSI has been generating bullish divergence since its May lows and is now above 50.
Therefore, while the price action gives mixed signs, technical indicators suggest that an eventual breakout from the line is likely. This would also confirm the long-term double bottom pattern.
Conversely, a decrease below the Sept lows of $0.057 would invalidate this possibility.
For Be[in]Crypto’s latest Bitcoin (BTC) analysis, click here


