
Hedera (HBAR) price has slipped about 1.2% in the last 24 hours, trading near $0.186. Despite the daily drop, it’s still up 7.7% this week and nearly 9% this month. On paper, it appears steady — but beneath the surface, the chart still indicates bearish pressure.
Yet, volume and positioning data hint that this setup might be close to turning.
Buying Pressure Quietly Builds Beneath the Surface
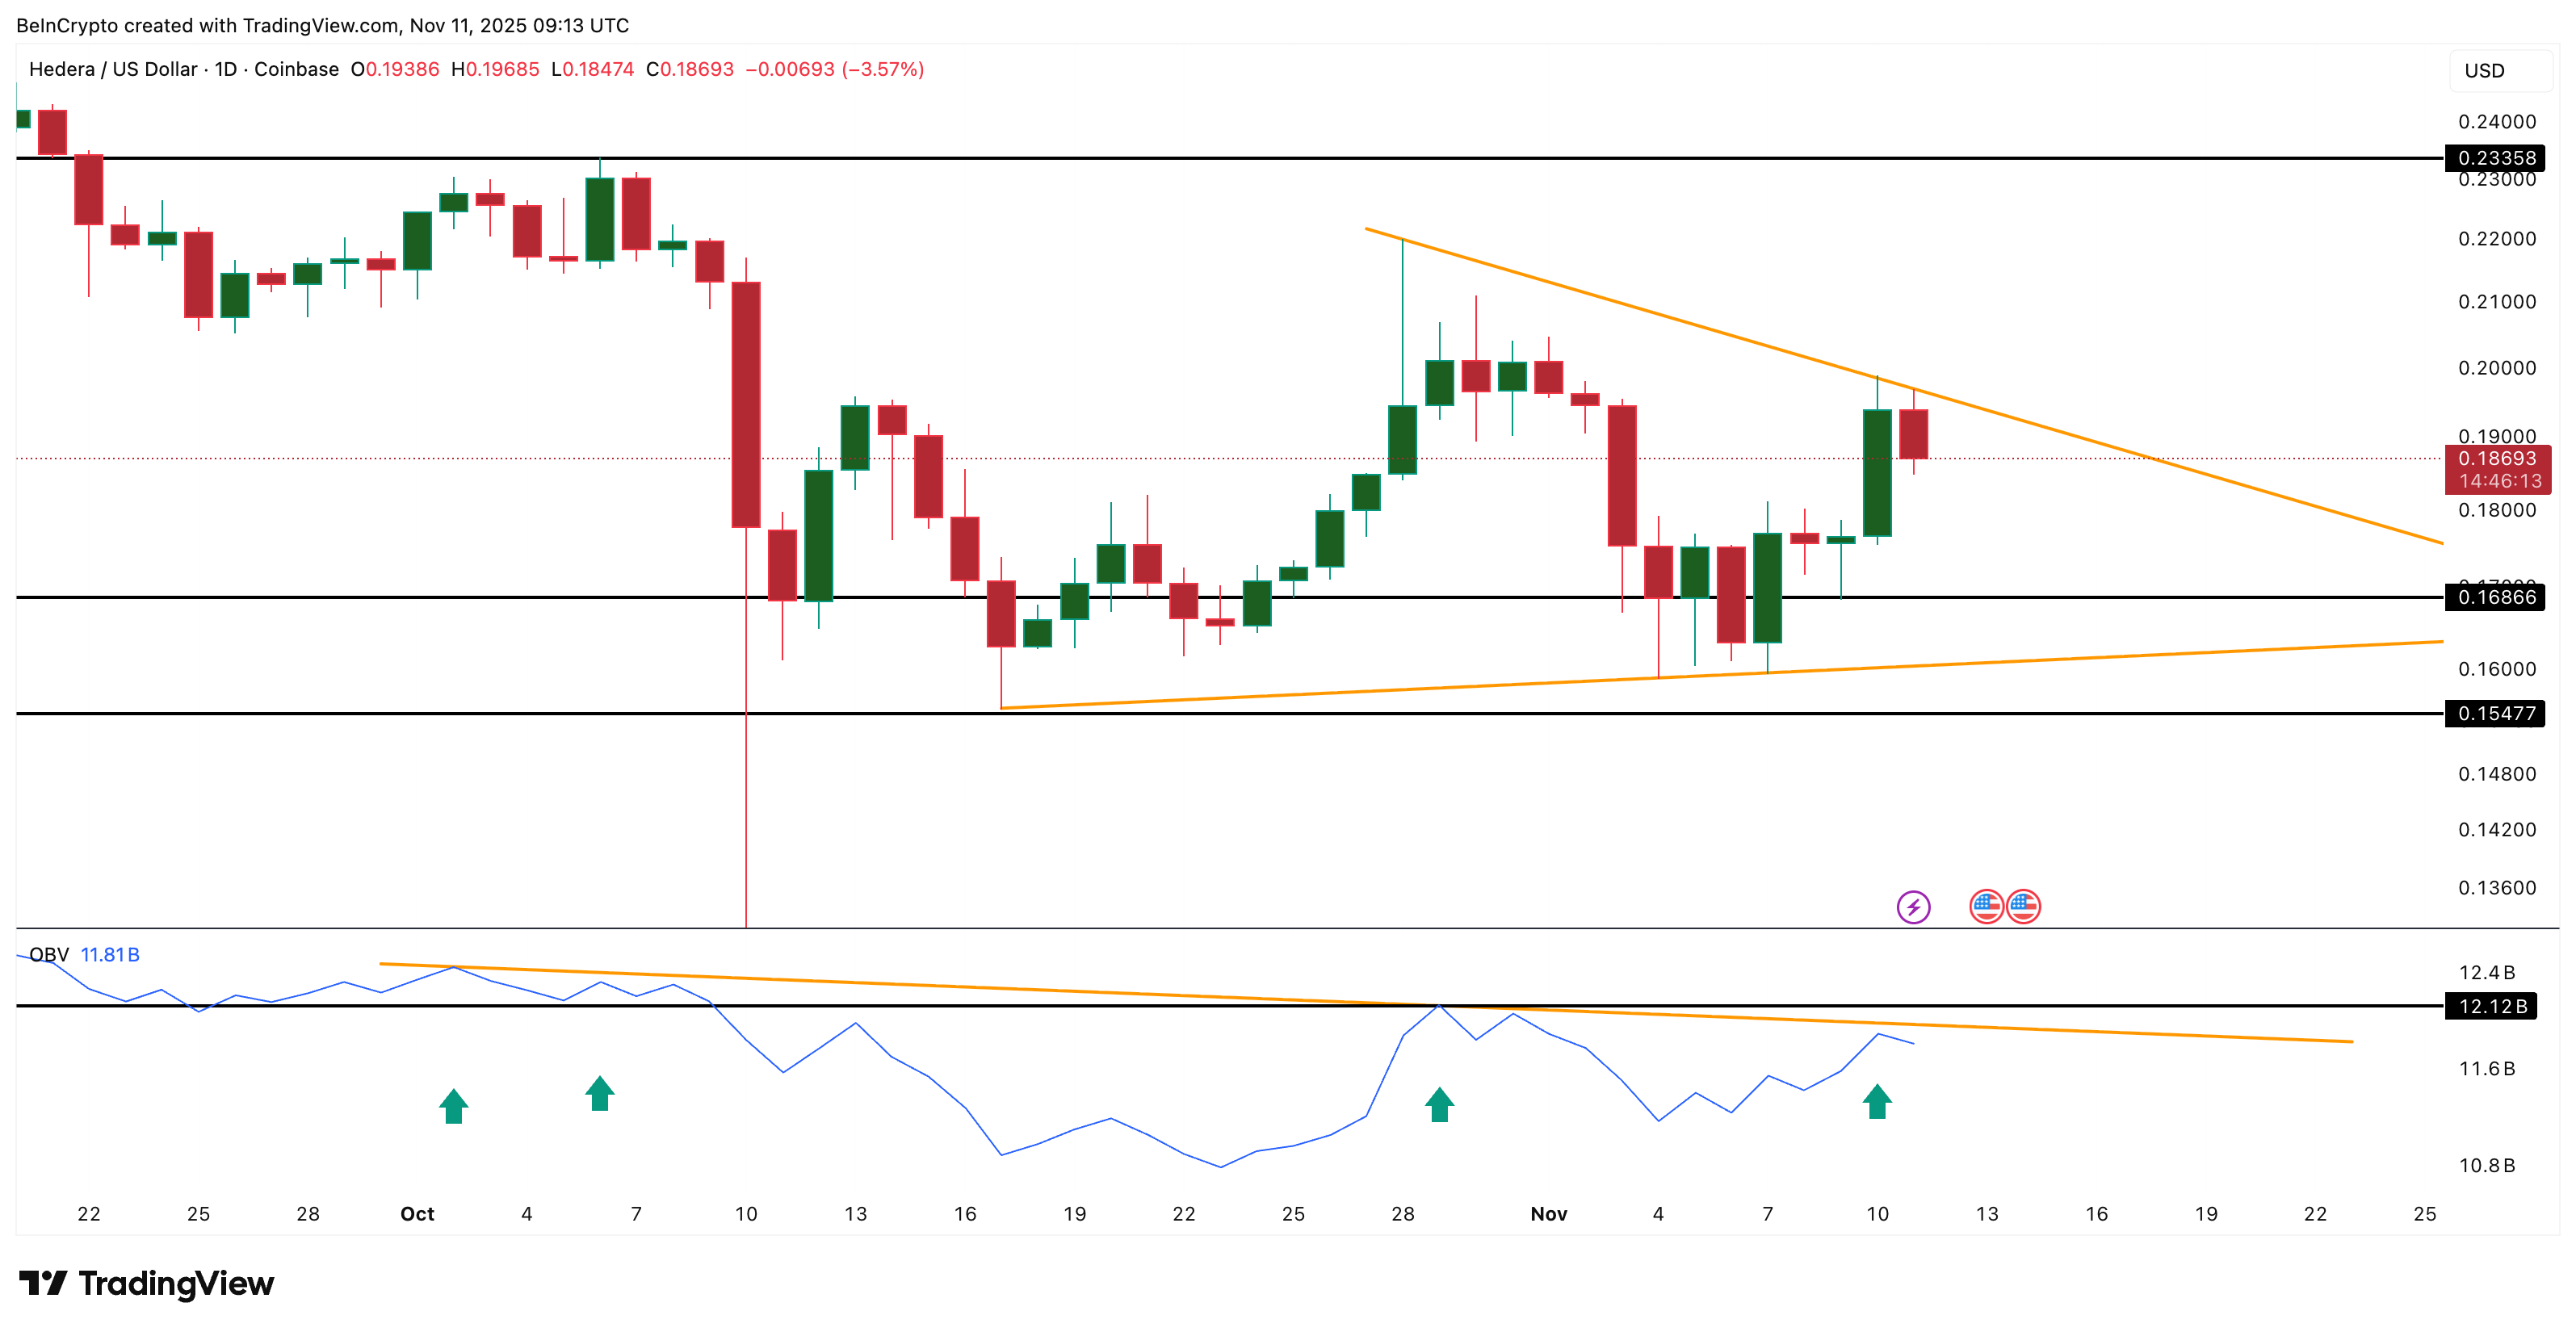
While HBAR’s structure remains under pressure, courtesy of the descending triangle pattern, two key signals indicate that buyers haven’t stepped away.
The On-Balance Volume (OBV) — a metric that tracks whether trading volume supports price direction — has repeatedly led to a price bounce every time it closed in on its descending trendline since early October. These rebounds on October 1, October 29, and November 10 indicate that buyers continue to enter on dips, even though breakouts have failed so far.
If OBV climbs past 12.1 billion, it would mark the first clean trendline breakout in weeks. That would confirm real buying strength returning to HBAR.
Want more token insights like this? Sign up for Editor Harsh Notariya’s Daily Crypto Newsletter here.
The Smart Money Index (SMI) — which follows early investor behavior — also supports that view. The SMI’s green line still sits slightly above the signal line, meaning activity and money flow haven’t vanished. The SMI even managed to break its descending trendline on November 10. Yet, it failed to trigger a strong HBAR price bounce.
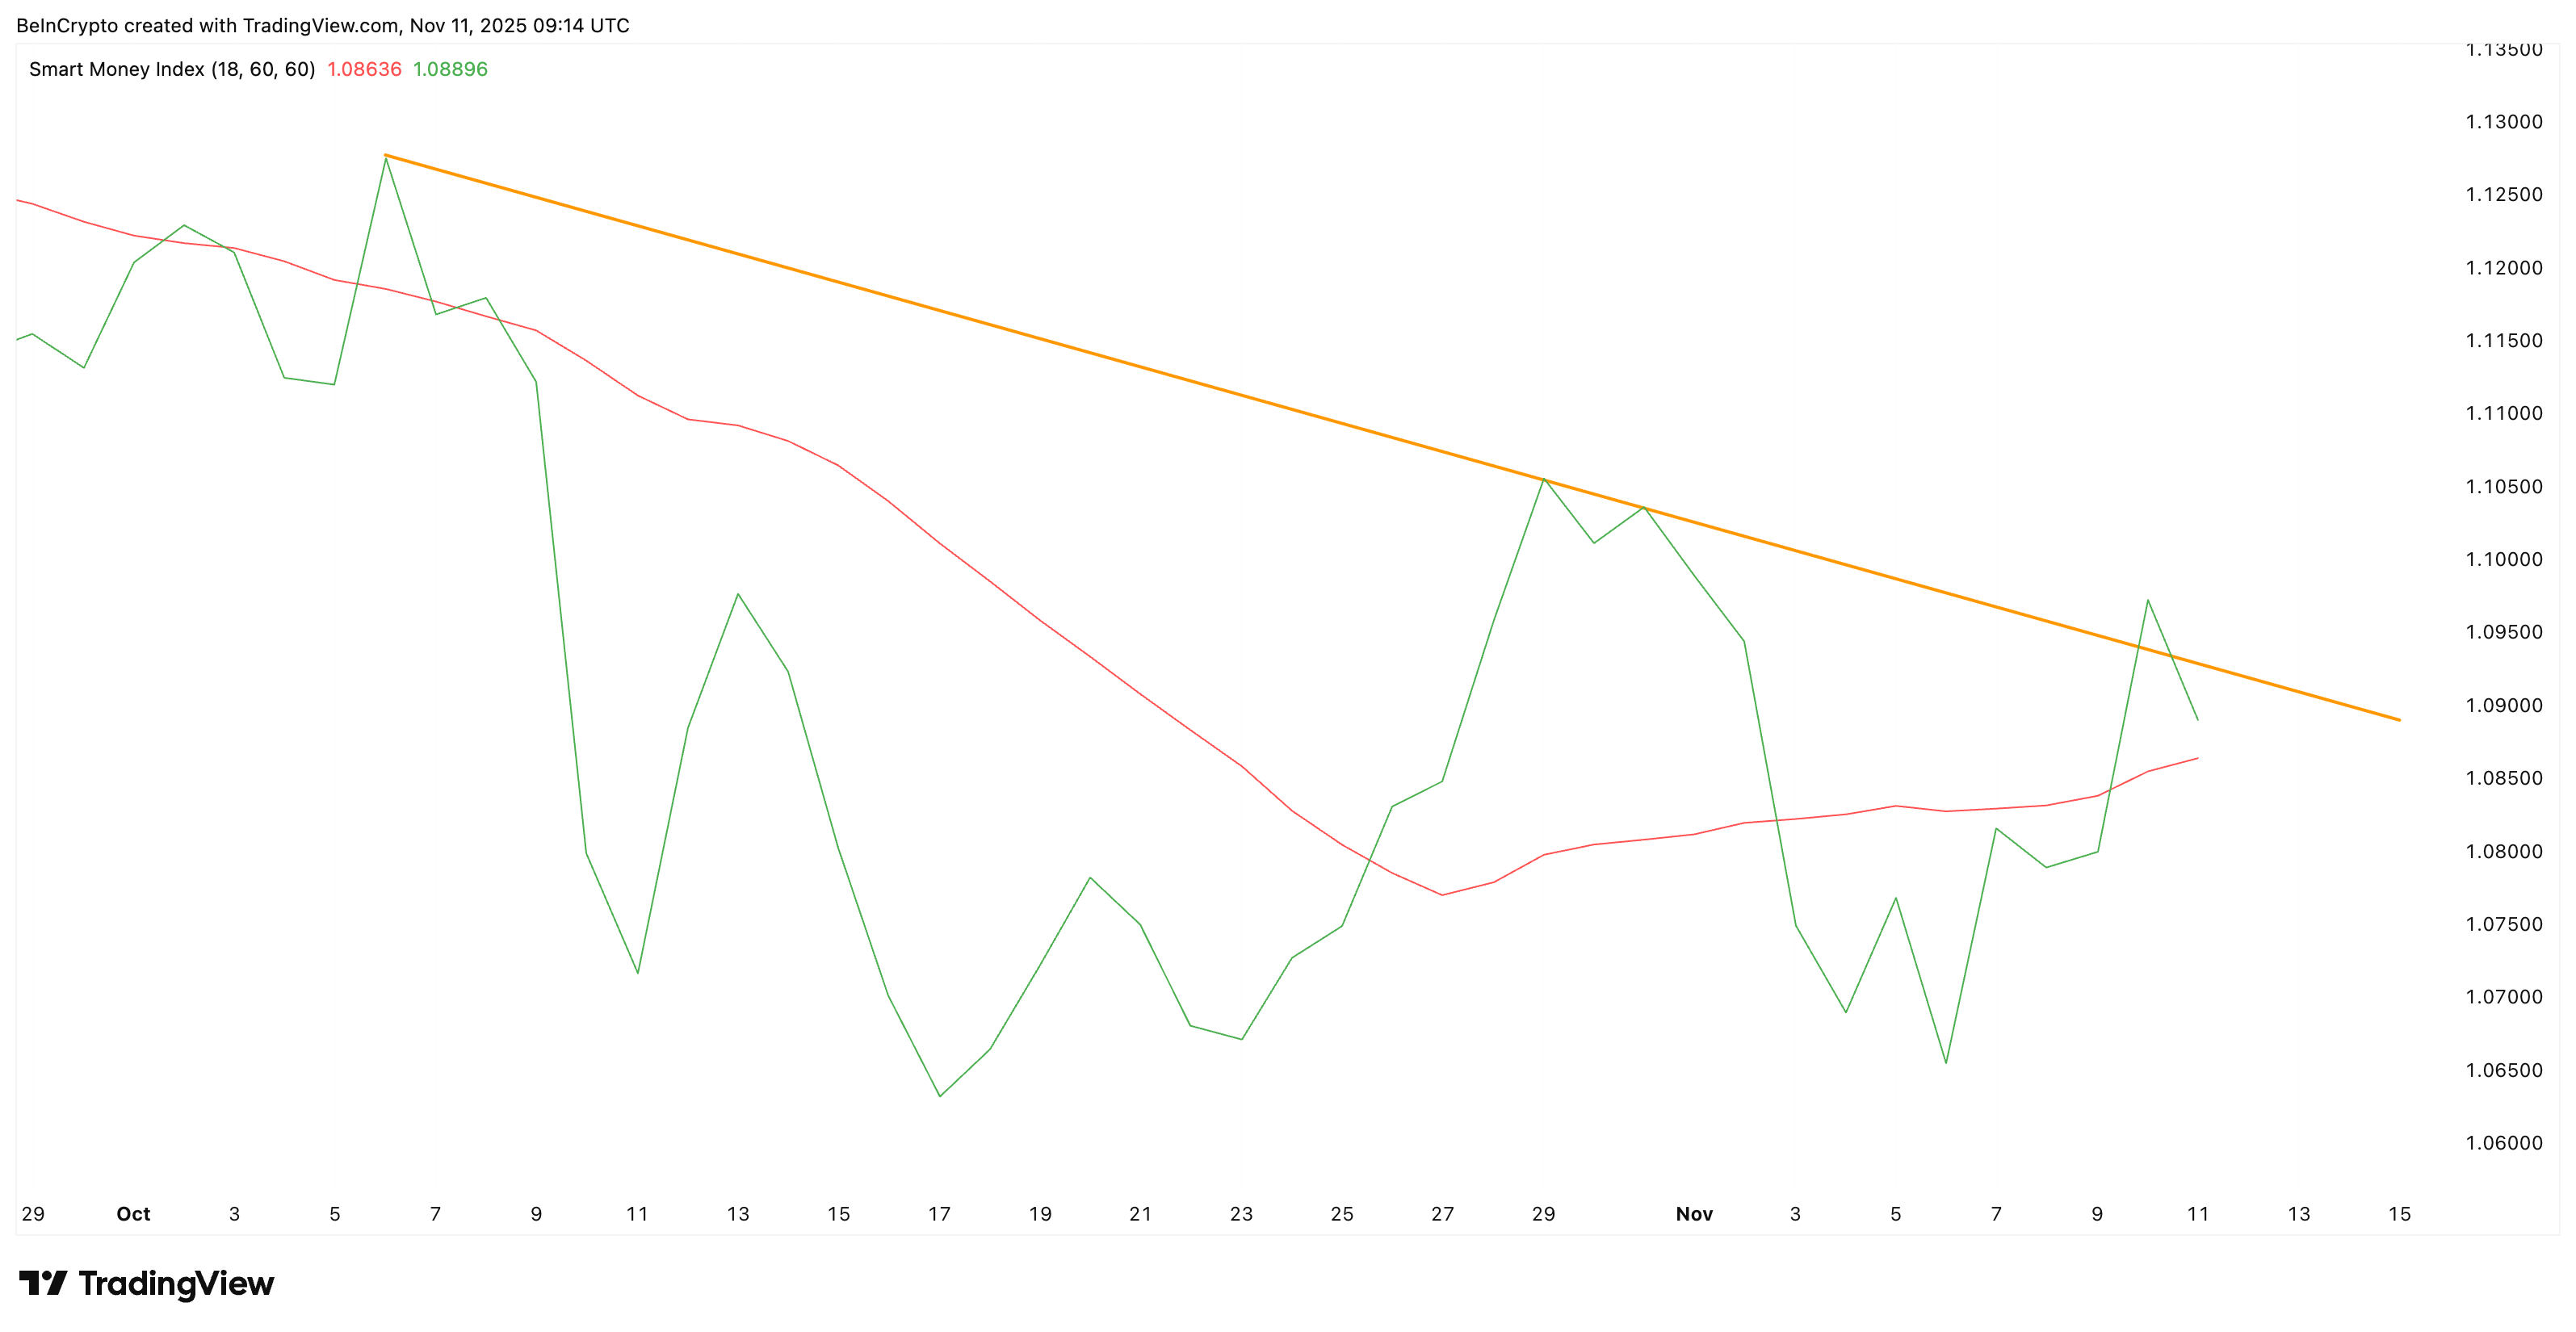
If both OBV and SMI break and stay above their respective trendlines together, it would confirm that informed traders are rebuilding positions. That would be a key sign that HBAR might be preparing for its squeeze moment, explained next.
Short Bias Sets the Stage for a Potential Squeeze
The Bybit 30-day liquidation map shows just how unbalanced the market has become. Short liquidations total nearly $14.41 million, compared with only $6.81 million in longs — more than a 110% bias toward shorts.
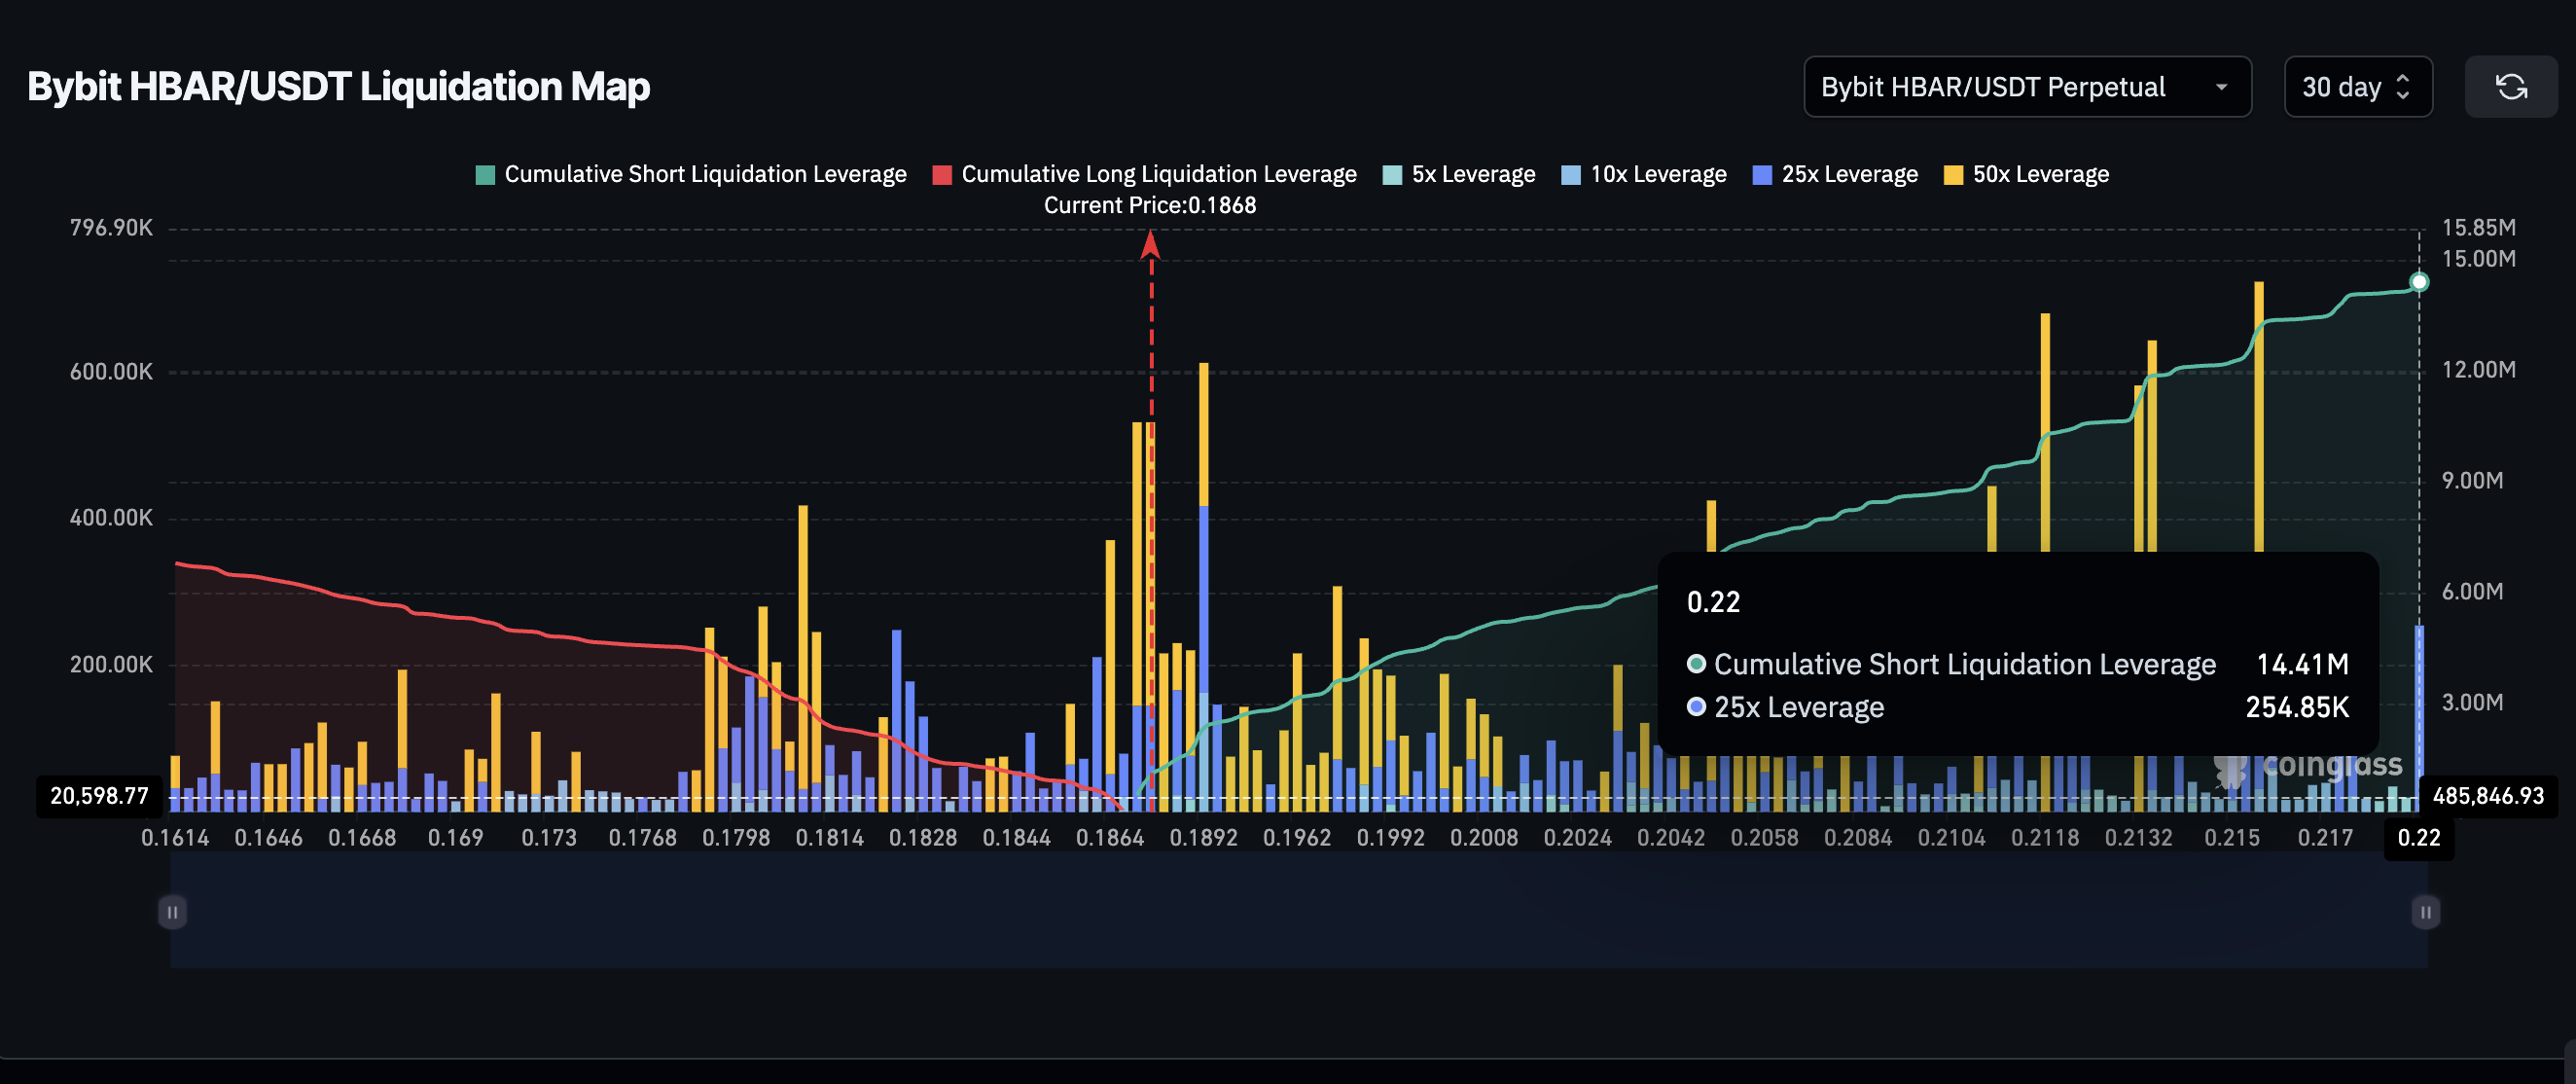
That one-sided positioning creates a classic short-squeeze scenario. If the HBAR price manages to move between $0.18–$0.22, traders on the short side could be forced to cover, adding even more buying pressure.
If this squeeze aligns with an OBV breakout, the move could gain speed fast — targeting the key resistance zones, explained in the next segment.
Key HBAR Price Levels That Could Define the Escape
For now, HBAR remains inside the same tight range it’s held since late October. Plus, the pattern that it trades in is bearish — the descending triangle.
The first key level to clear is $0.196, which has rejected every push since November 10. That would mean a bearish pattern invalidation.
Above that, $0.206 becomes the breakout pivot — a close beyond it could flip the short-term bias to bullish and open the door to $0.233. Crossing $0.206 would even liquidate a sizable amount of shorts, furthering the squeeze hypothesis.
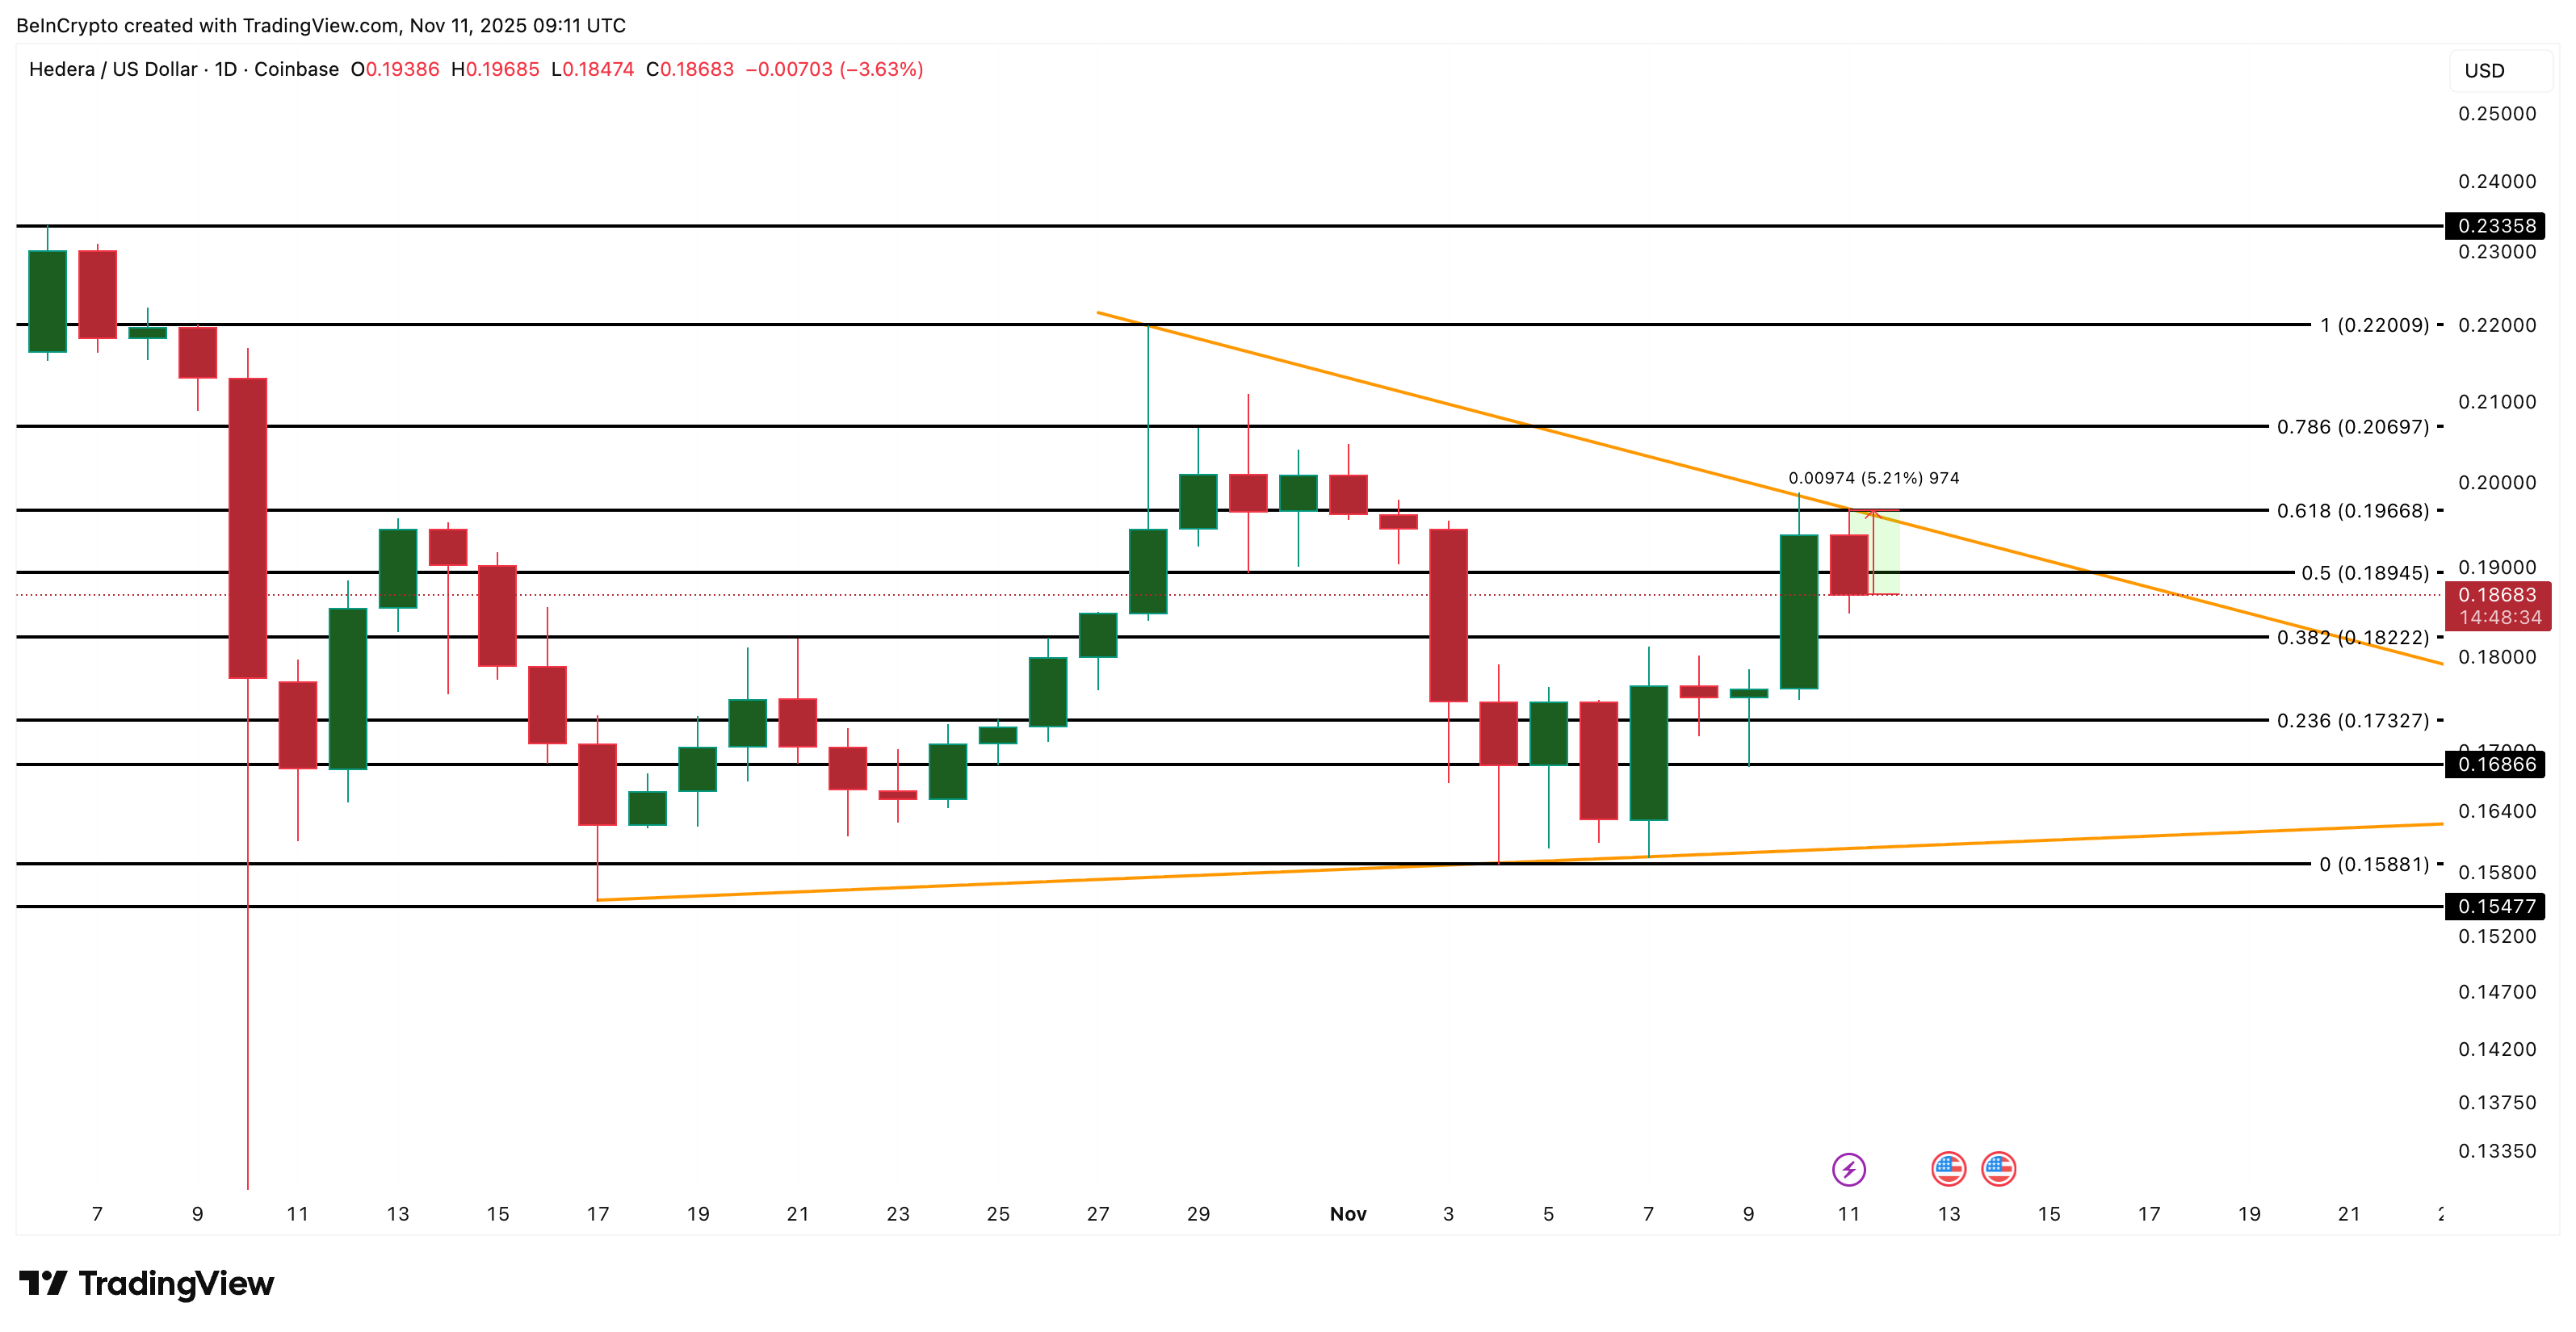
On the downside, $0.173 is the make-or-break line. A daily close below that would erase the squeeze setup and keep HBAR firmly in bearish territory. That would even expose $0.154.
For now, HBAR is still in the bear claws — but if volume, smart money, and short positions align, it might finally squeeze its way out.
