


Hedera is quietly setting up for a move that traders have been waiting months to see. After repeated failed bounces, the HBAR price action, ETF demand, and spot flows are finally starting to align. What makes this moment different is not just the chart pattern, but the timing.
The same level that killed previous rallies is back in focus. This time, it is being tested alongside the strongest ETF demand Hedera has seen in 2026.
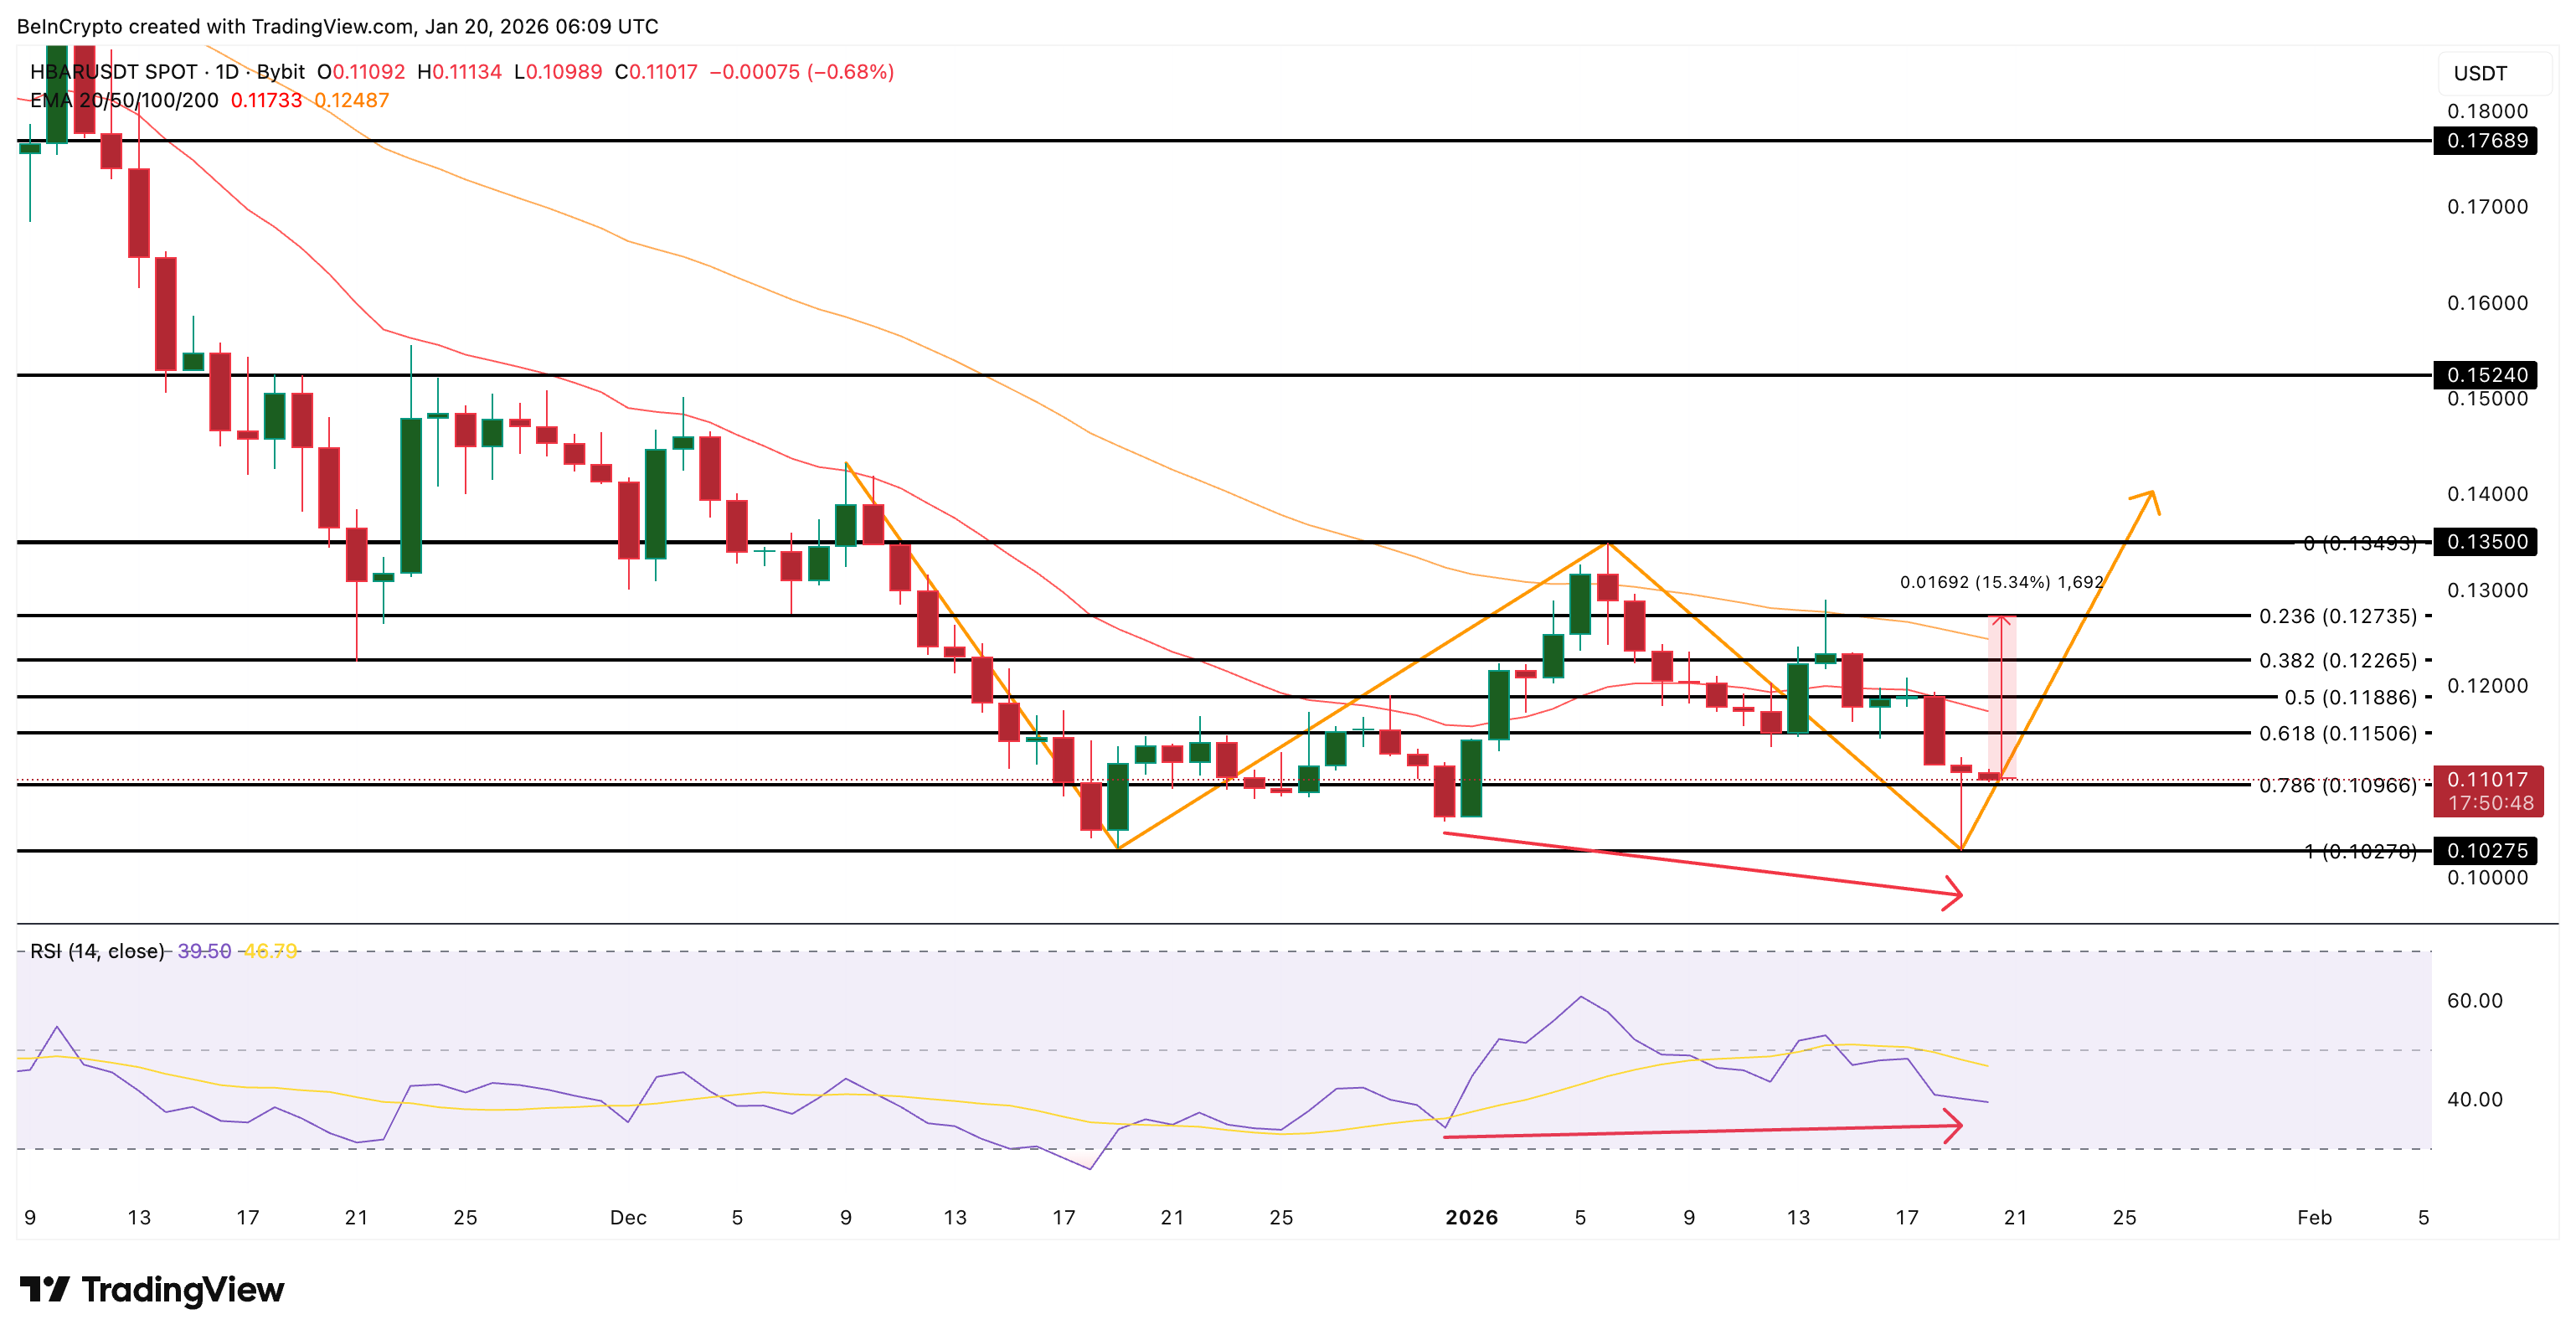
Hedera Forms a W Base as EMA Resistance Returns
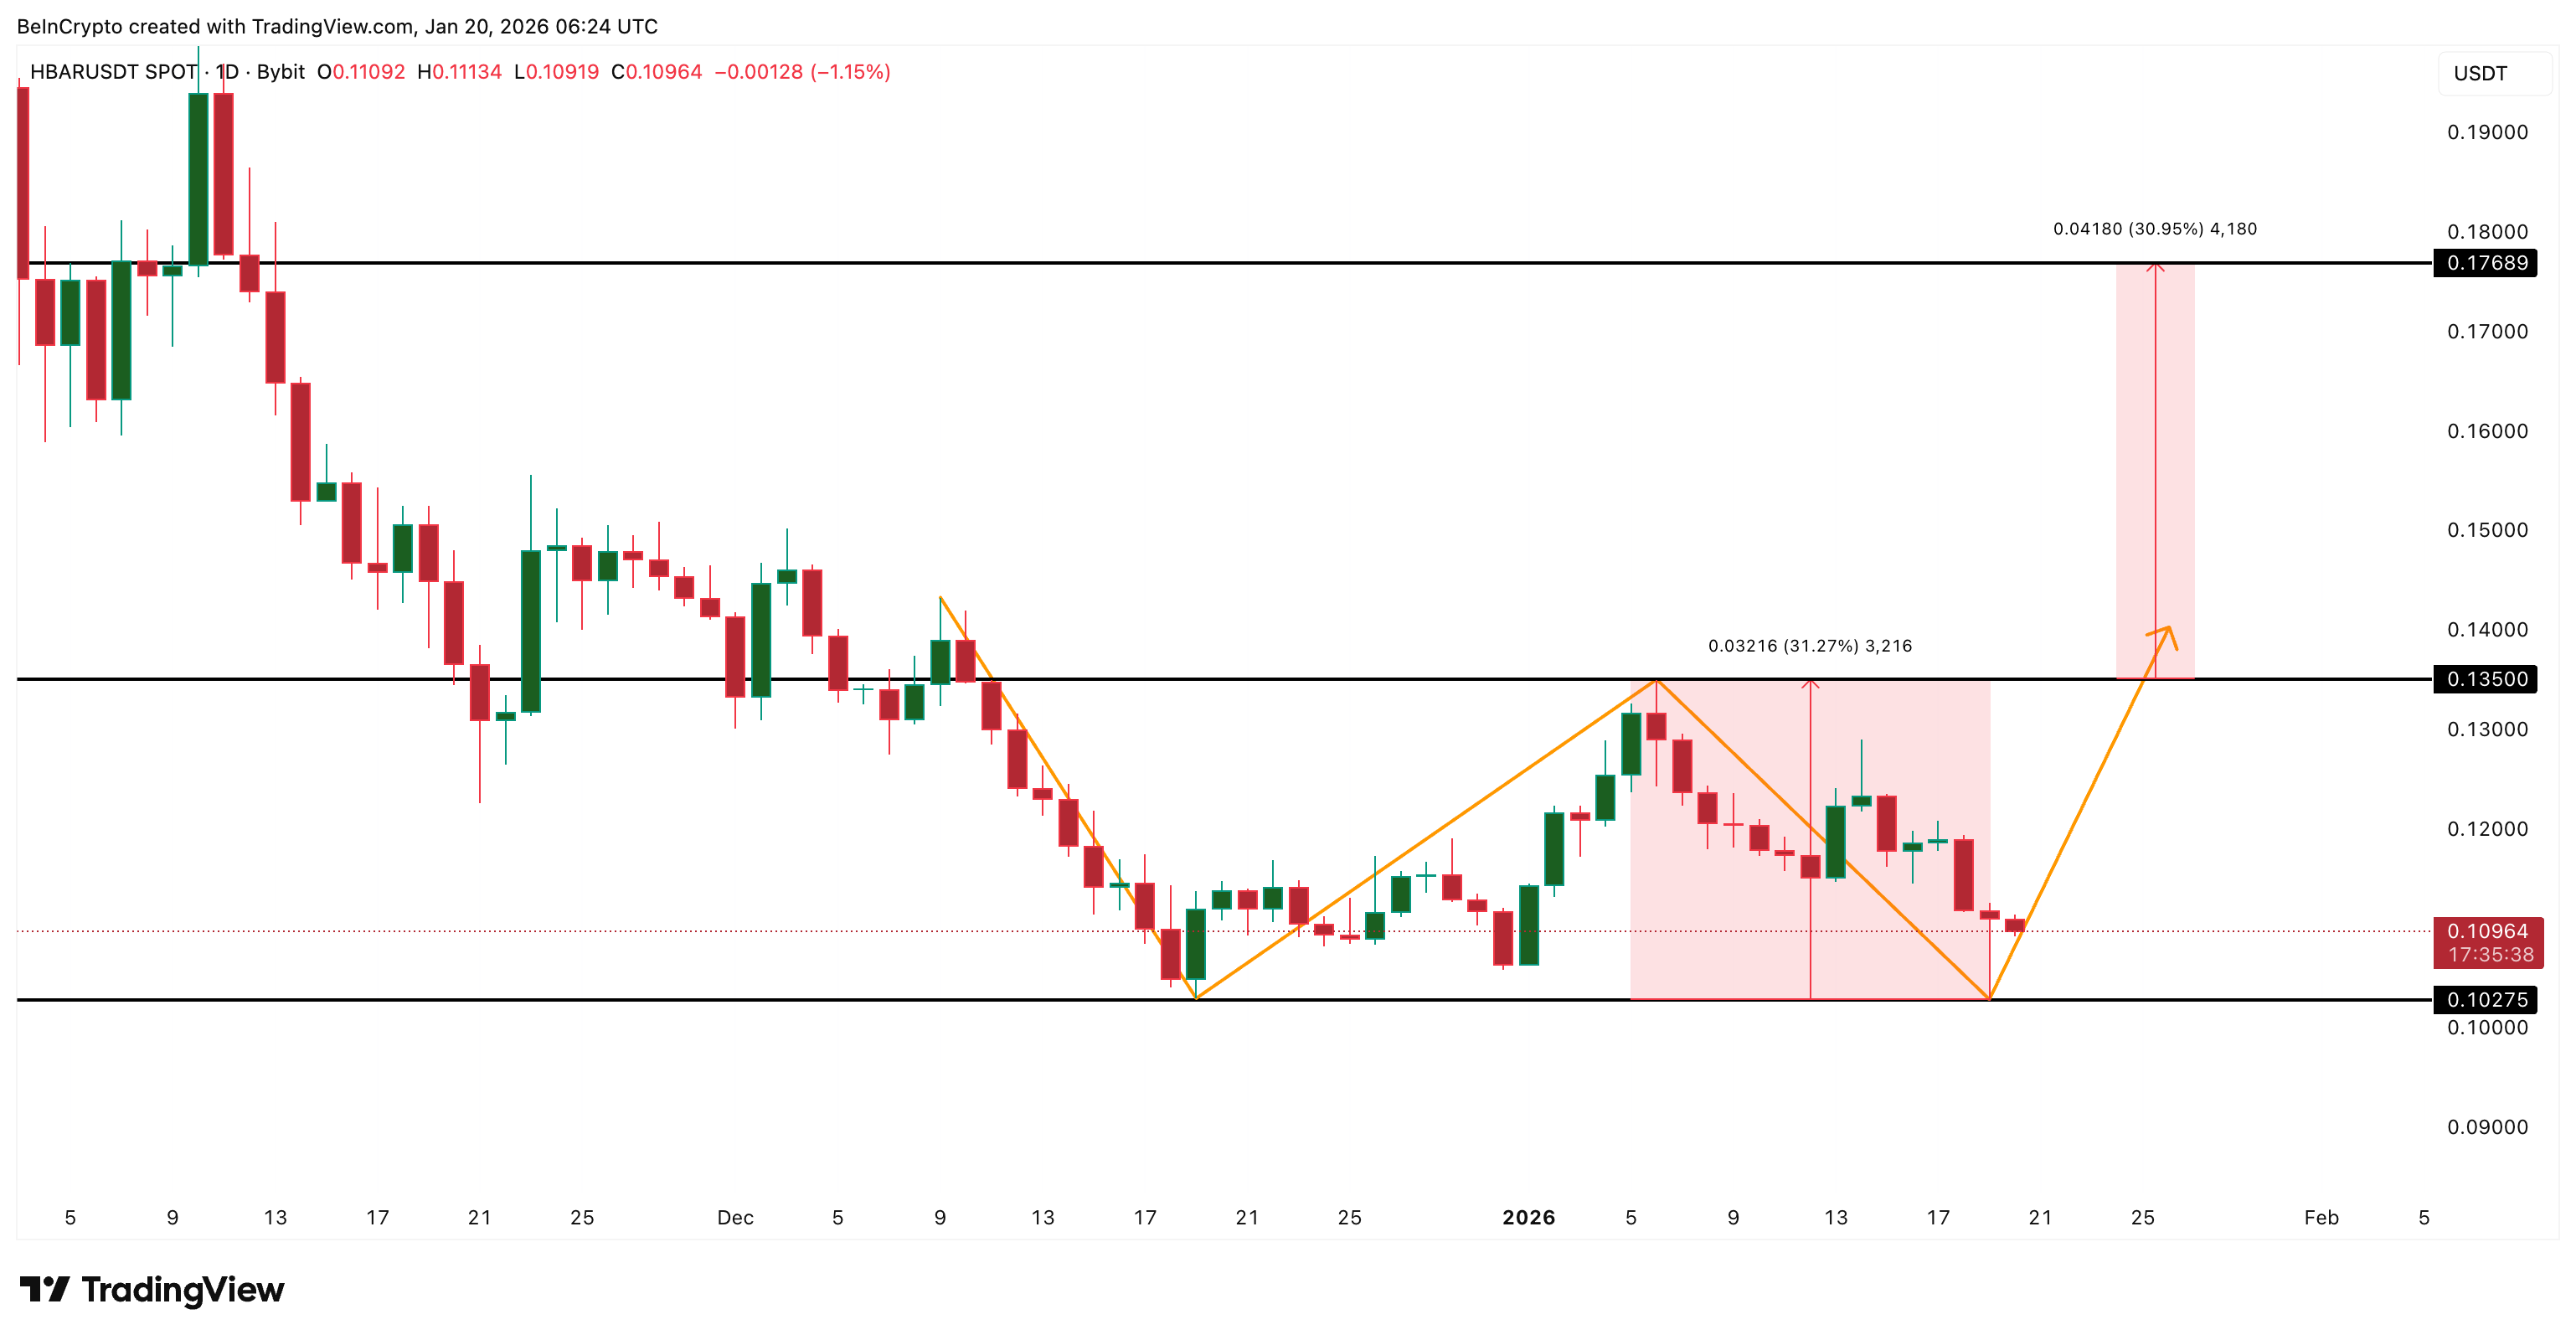
Hedera is forming a clear W pattern, also known as a double bottom, on the daily chart. This structure appears when price tests the same support twice and holds, signaling that sellers are losing momentum. In Hedera’s case, the $0.102 level has now acted as a floor on multiple occasions, drawing in buyers each time the price revisits it.
From that base, price has attempted to rotate higher toward the $0.135 area, which acts as the neckline of the W pattern. If that neckline breaks, the structure projects a potential 31% move, placing upside targets near the $0.176 zone.
Want more token insights like this? Sign up for Editor Harsh Notariya’s Daily Crypto Newsletter here.
But this is where past rallies failed.
Each rebound earlier this year stalled because Hedera could not reclaim its key exponential moving averages (EMAs). An EMA places more weight on recent price action and helps traders identify whether a move is corrective or trend-changing. In early January, Hedera reclaimed the 20-day EMA, triggering short rallies of roughly 8% to 16%. Those moves faded quickly because the price could not hold above the 50-day EMA.
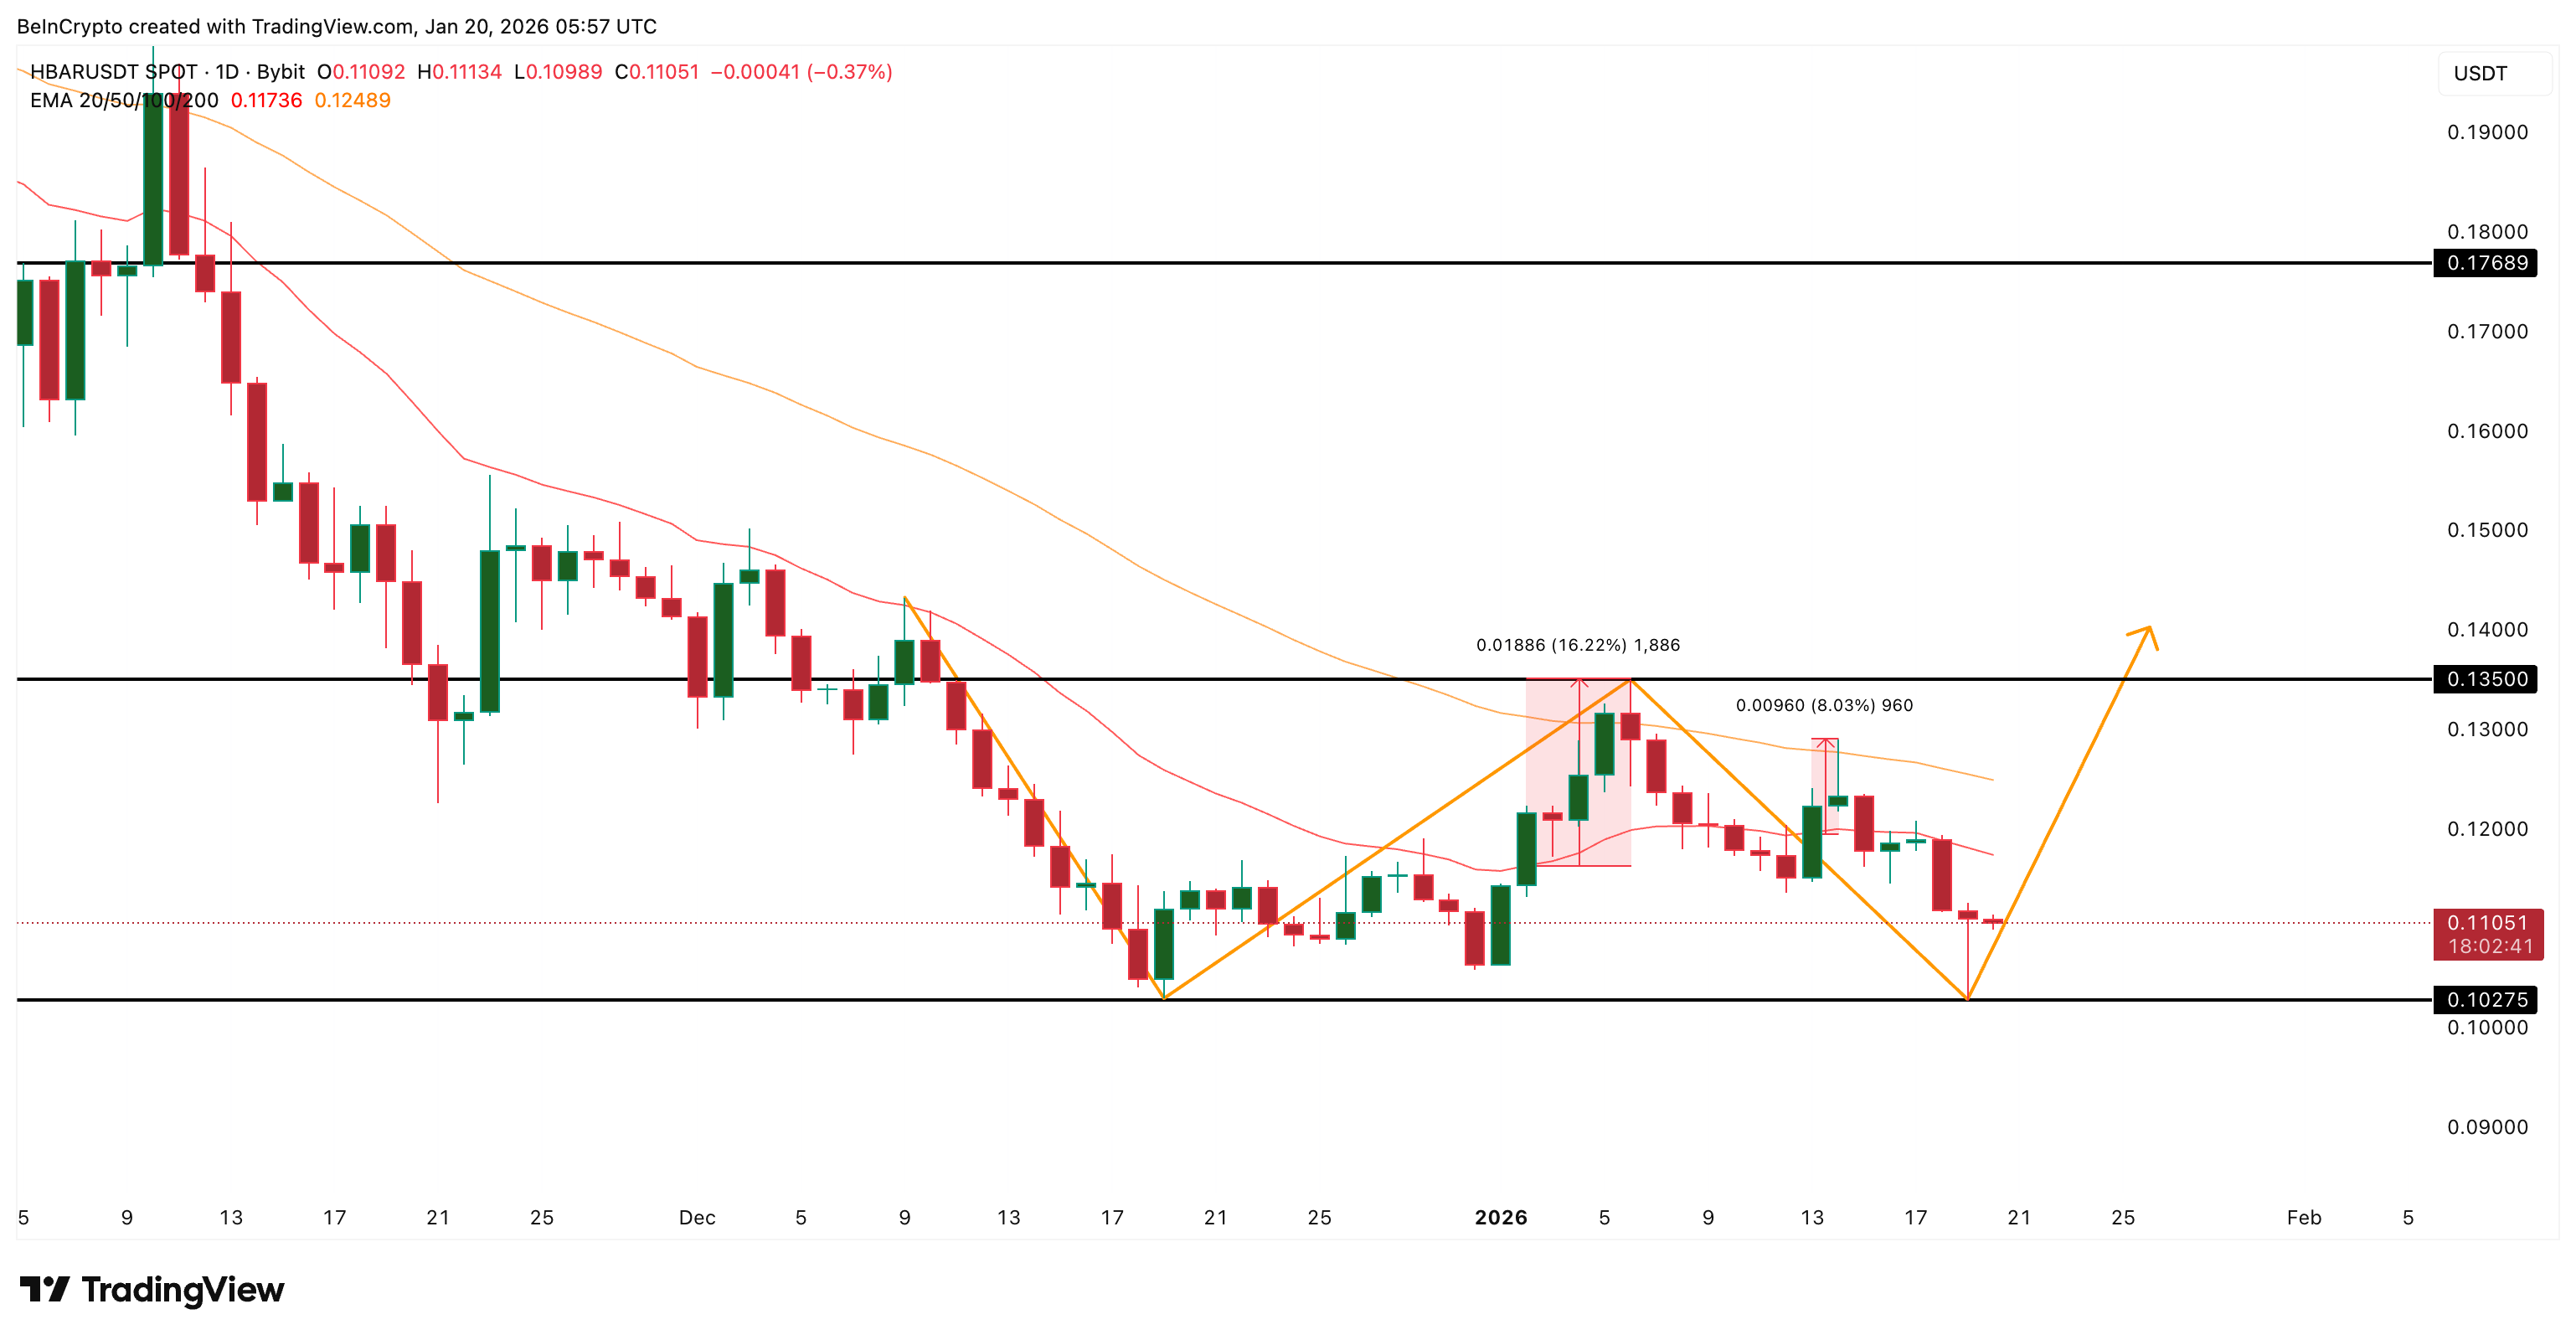
That same barrier now sits directly in the path of the W pattern neckline. This means the structure and the moving averages are converging at the same point. A break above $0.135 would not just complete the W pattern. It would also mark the first clean reclaim of the 50-day EMA in weeks.
That is why this setup matters more than previous attempts. And it is also why demand beneath the surface now becomes critical.
ETF and Spot Demand Are Rising Together as Supply Tightens
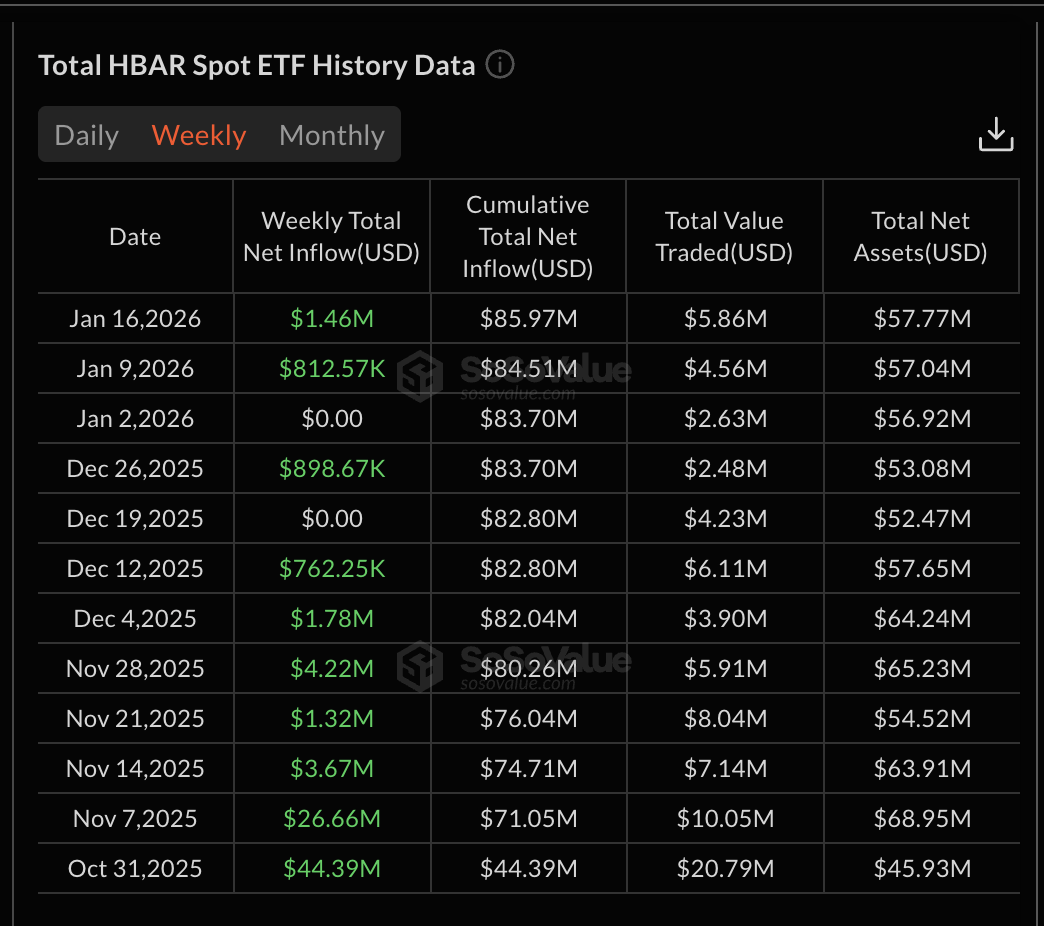
Hedera just posted its strongest ETF inflow week of 2026. For the week ending January 16, net inflows reached approximately $1.46 million, the highest weekly total this year. That matters because ETF demand represents slower, steadier capital that tends to absorb supply during consolidation phases rather than chase breakouts.
This ETF strength is now being mirrored in the spot market.
Between January 18 and January 19, Hedera’s net spot outflows increased from roughly $882,000 to $2.22 million. That is a jump of more than 150% in a single day, signaling that buyers are pulling tokens off exchanges rather than preparing to sell them.
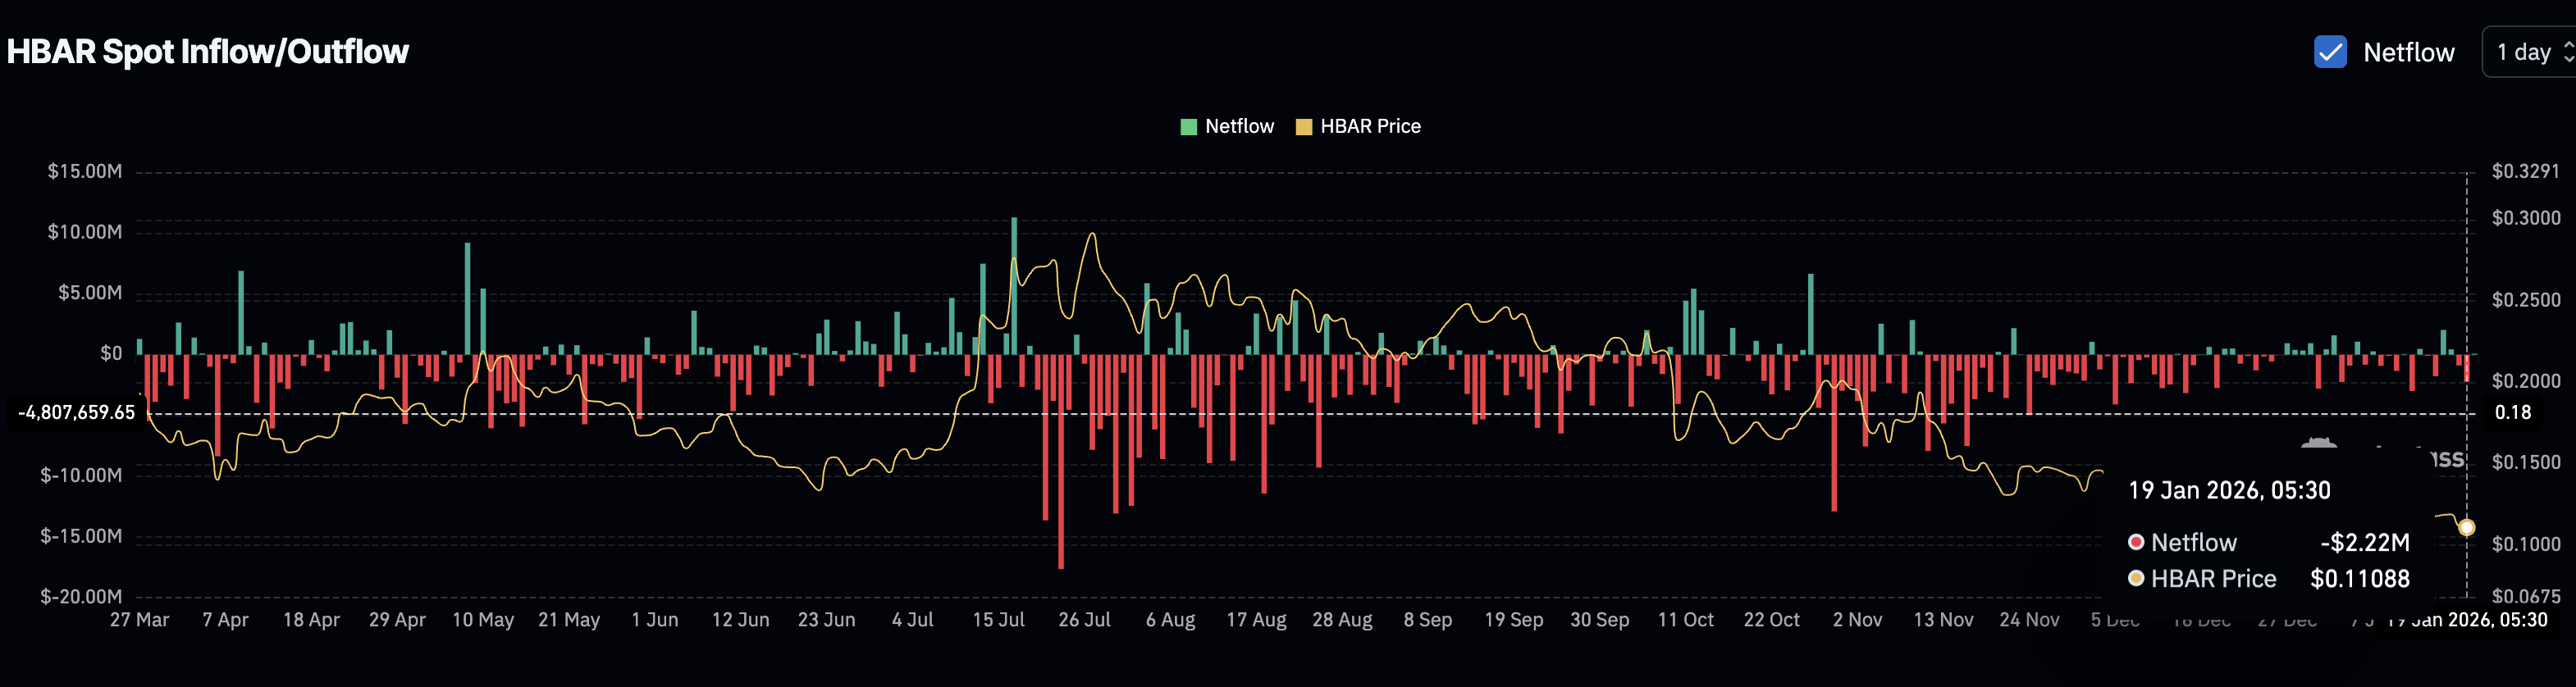
The alignment between ETF inflows and spot outflows is important. This time, demand is appearing before the breakout, not after it.
The next data point will be decisive. The current ETF week closes on January 23. If inflows remain positive into the end of the week, it would confirm that institutional-style demand is still building. If flows stall, it would suggest buyers are still cautious.
That uncertainty makes the next HBAR price reaction especially important.
One HBAR Price Level Decides the Breakout
Momentum indicators are quietly supporting the bullish case. Between December 31 and January 19, Hedera’s price is testing a lower low formation while the Relative Strength Index is close to printing a higher low. RSI measures the strength of recent gains versus losses, and this divergence usually signals that selling pressure is weakening.
The bullish divergence signal remains conditional.
As long as the current Hedera candle holds above $0.102, the divergence stays valid and supports the idea of a higher move. A sustained break below $0.102 would invalidate both the divergence for now and the W pattern, reopening downside risk.
If price moves higher, the key test is not the bounce itself, but how far it goes. Reclaiming the $0.118 area would mark a recovery of the 20-day EMA, something Hedera has already managed before. The real shift only happens above $0.127, where the 50-day EMA sits. Clearing that level would turn previous resistance into support and open the door for a move toward $0.135, followed by the projected $0.152 and $0.176 zones.
Hedera has spent weeks building a base while demand slowly improves. The chart is ready. The flows are improving. Now everything comes down to one level that has stopped every rally so far — the 50-Day EMA line.


