
![Have Hopes for an Altseason Faded Away? [Premium Analysis]](https://beincrypto.com/wp-content/uploads/2019/04/bic_hunter_altcoin.jpg.optimal.jpg)
The altcoin dominance rate is close to reaching a significant support area. Its movement inside this area will likely determine the direction of the future trend.
The altcoin dominance rate increased steadily beginning in September. However, on December 16, a rapid decrease ensued — which caused it to eradicate most of the gains made hitherto.
Cryptocurrency trader @rektcapital outlined the altcoin dominance chart while stating that the current decrease was easily predicted due to the breakdown of a long-term market structure.
When did the breakdown occur? Where will the dominance rate go to next? Continue reading below if you are interested in finding out.Altcoin Dominance – 1D
— Rekt Capital (@rektcapital) December 23, 2019
The drastic breakdown in market structure in Altcoin Dominance foreshadowed significant shedding of Altcoin valuations$BTC #Bitcoin #Crypto pic.twitter.com/5t7GHVxSXc
Altcoin Dominance Double Top
The altcoin dominance rate made a low of 28.7 percent on September 6. Afterward, it began a rapid increase that eventually led to a high of 34.4 percent. The rate made an Adam & Eve double top (sharp & gradual) inside this resistance area before decreasing. This decrease caused the rate to break down from the ascending support line it had been following since the September 6 low. The rate is currently inside the 31 percent support area. If the breakdown continues the entire height of the double top pattern, it will again reach the 28.7 percent low reached on September 6.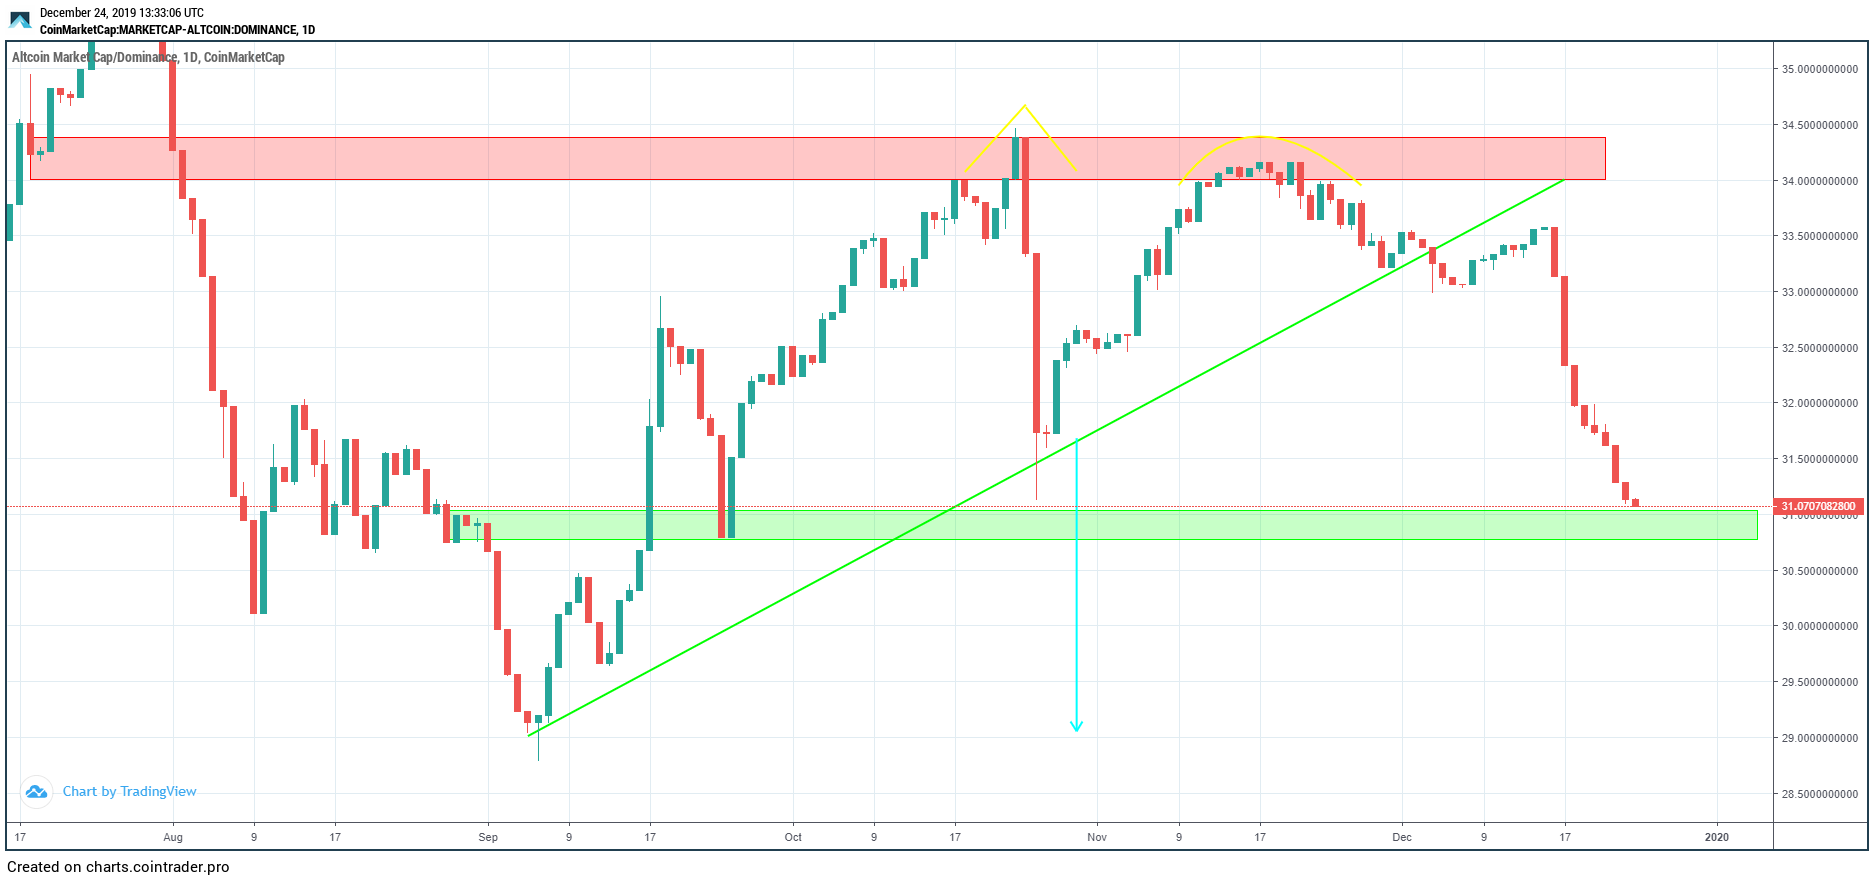
Long-Term
The long-term chart reveals an ambiguous outlook. First, the 34 percent resistance area previously acted as support. Once the rate broke down, it increased to validate it, creating the double top mentioned previously. Therefore, at first glance, this seems like a retest of a significant support area before the rate heads lower. The next support area is found at 22.5 percent. At the September 6 low, the weekly RSI was at 20.5 — the lowest value ever recorded. Also, the MACD tried to move above the 0 line, which it has not done since 2018. Therefore, the signs are unclear. While rate movement suggests we will head lower, the RSI & MACD do the opposite.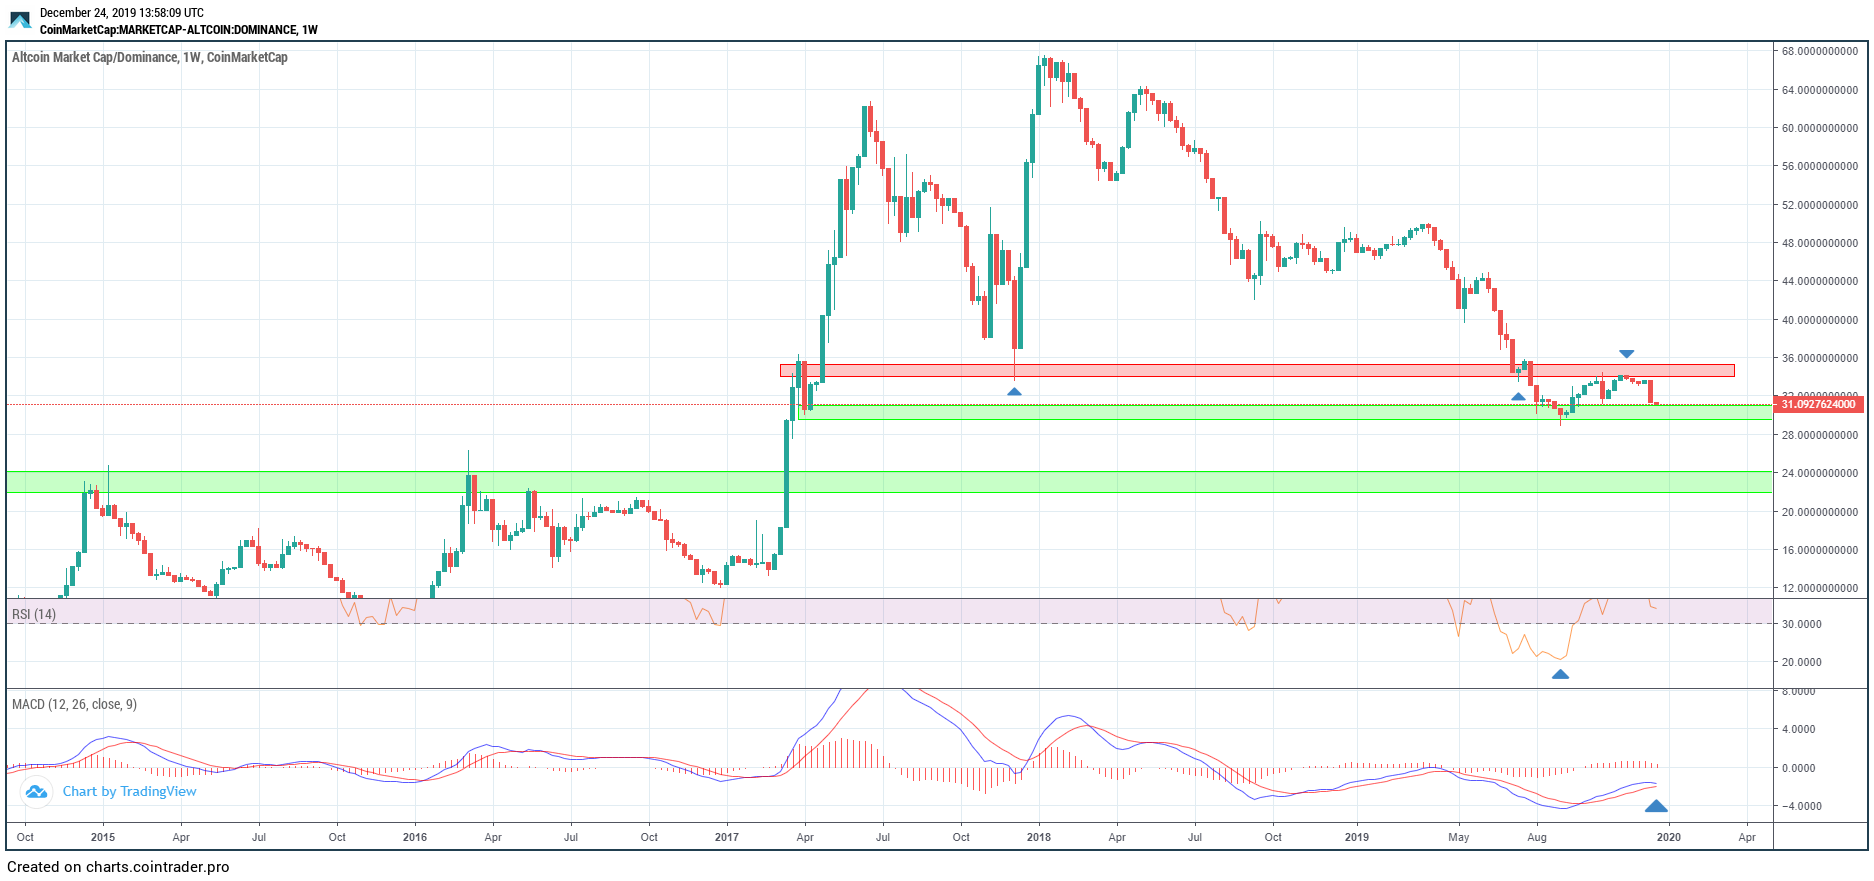 Since the rate is likely to retest the 29 percent lows, the reaction of the indicators there will go a long way in determining future movement.
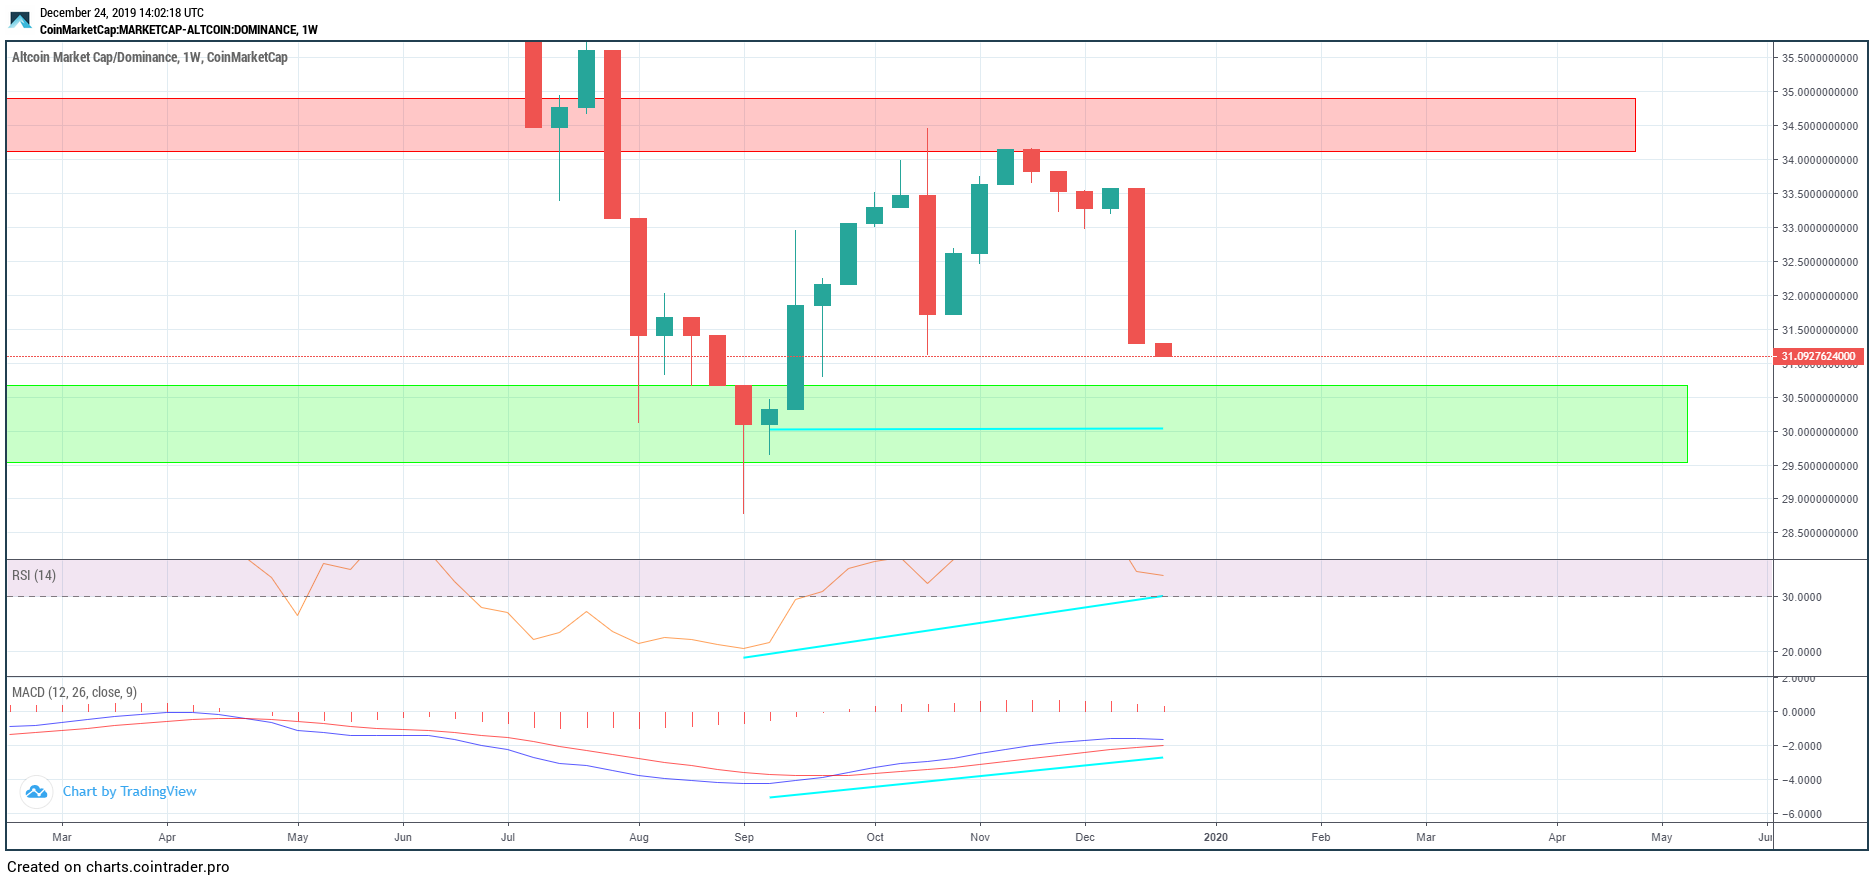
If the rate makes a double bottom, preferably with a long lower wick, it will have bullish implications — more so if the RSI and MACD generate bullish divergence, which is looking likely. If not, then we are heading lower towards the 24 percent support area.
While we are slightly leaning towards the bullish outlook, at the current time, there is not enough information to confidently predict either scenario.
Since the rate is likely to retest the 29 percent lows, the reaction of the indicators there will go a long way in determining future movement.
If the rate makes a double bottom, preferably with a long lower wick, it will have bullish implications — more so if the RSI and MACD generate bullish divergence, which is looking likely. If not, then we are heading lower towards the 24 percent support area.
While we are slightly leaning towards the bullish outlook, at the current time, there is not enough information to confidently predict either scenario.
 The altcoin dominance rate has failed to break out above a significant resistance area. The rate movement at the current support area of 29 percent will determine whether the rate will increase or head lower.
Top crypto platforms in the US
Disclaimer
In line with the Trust Project guidelines, this price analysis article is for informational purposes only and should not be considered financial or investment advice. BeInCrypto is committed to accurate, unbiased reporting, but market conditions are subject to change without notice. Always conduct your own research and consult with a professional before making any financial decisions. Please note that our Terms and Conditions, Privacy Policy, and Disclaimers have been updated.

Valdrin Tahiri
Valdrin discovered cryptocurrencies while he was getting his MSc in Financial Markets from the Barcelona School of Economics. Shortly after graduating, he began writing for several different cryptocurrency related websites as a freelancer before eventually taking on the role of BeInCrypto's Senior Analyst.
(I do not have a discord and will not contact you first there. Beware of scammers)
READ FULL BIO
Sponsored
Sponsored