


BeInCrypto takes a look at the eight altcoins that decreased the most over the past seven days, from June 25 to July 2
These altcoins are:
- Quant (QNT) : – 23.06%
- Theta Fuel (TFUEL) : -18.40%
- THETA (THETA) : -13.39%
- Nexo (NEXO) : -6.62%
- THORChain (RUNE): -6.37%
- The Graph (GRT) : -5.42%
- Polygon (MATIC) : -4.99%
- Near Protocol (NEAR): -4.09%
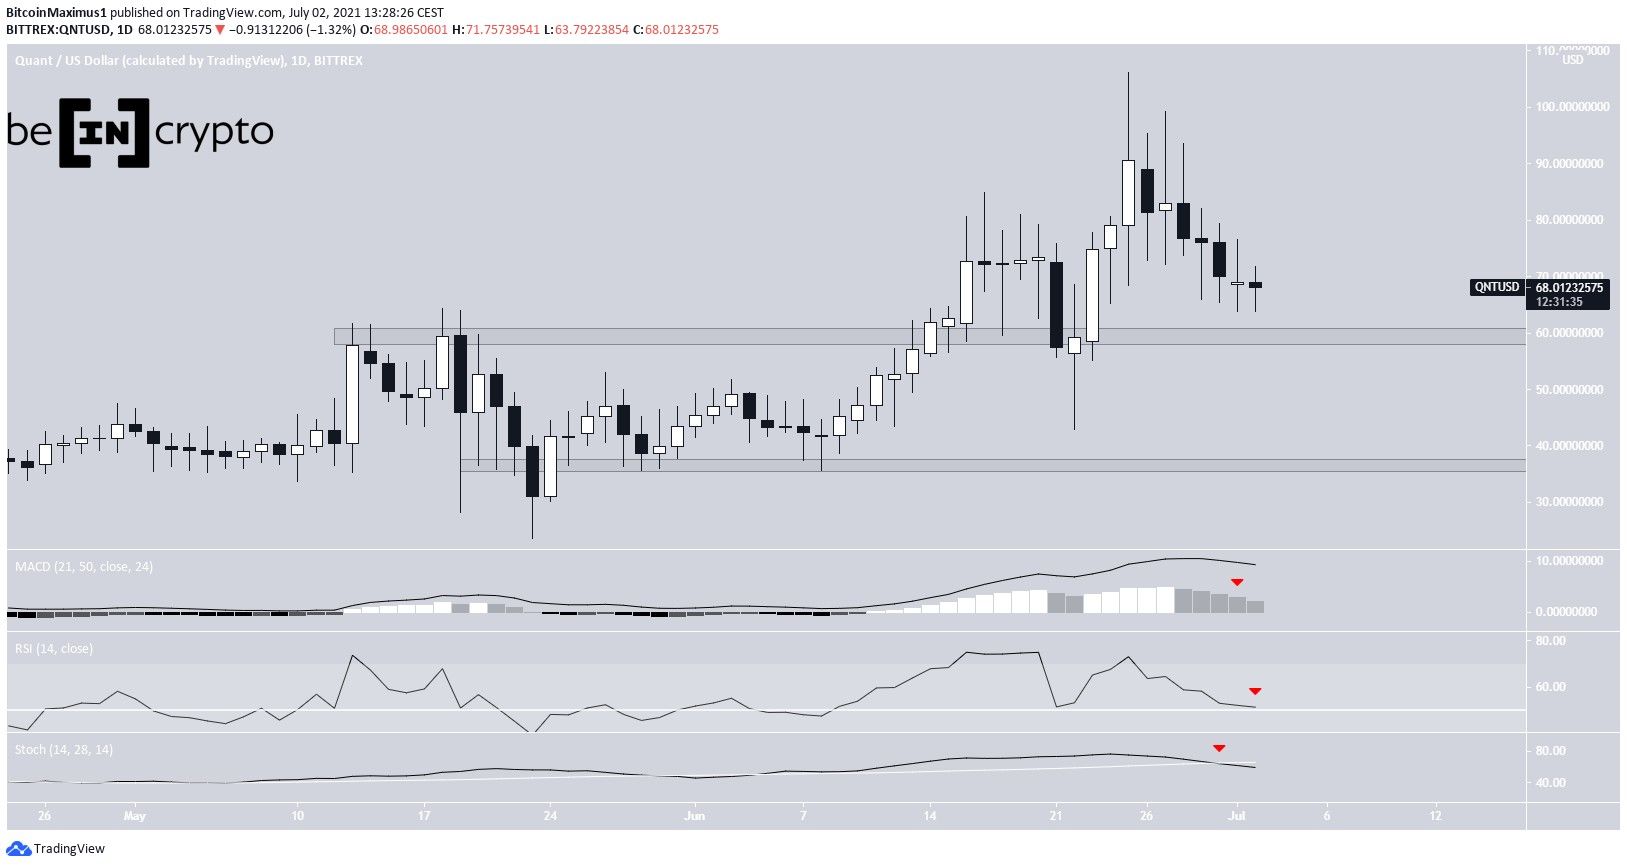
QNT
QNT has been moving downwards since reaching an all-time high price of $106.19 on June 25. So far, it has reached a low of $65.20.
The main support area is at $60, a level that previously acted as resistance, before being validated as support on June 22. QNT is quickly approaching it.
If a breakdown occurs, the next support would be at $36.60.
Technical indicators are bearish. The MACD has given a bearish reversal signal and the Stochastic oscillator has made a bearish cross. The RSI is close to decreasing below 50.
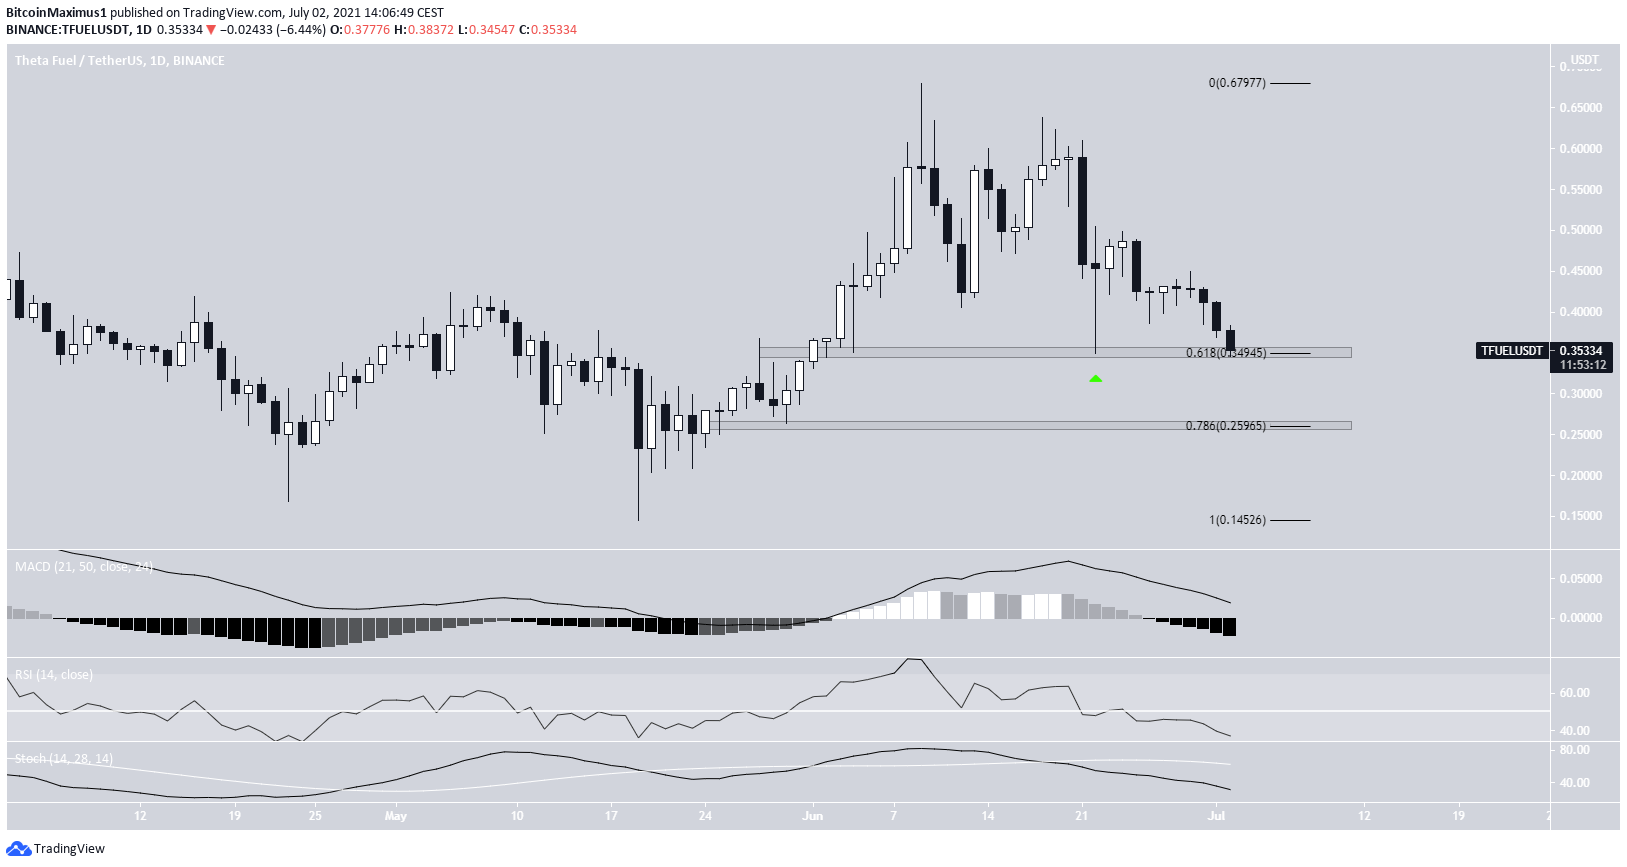
TFUEL
TFUEL has been moving upwards since May 19. It managed to reach a new all-time high price of $0.679 on June 9, but has been moving downwards since.
Currently, the token is trading right above the $0.35 support area, which is the 0.618 Fib retracement support level. Previously, TFUEL bounced at this level on June 22.
However, technical indicators are bearish. The MACD is negative, the RSI has crossed below 50 while the Stochastic oscillator has made a bearish cross.
The next closest support is at $0.259.
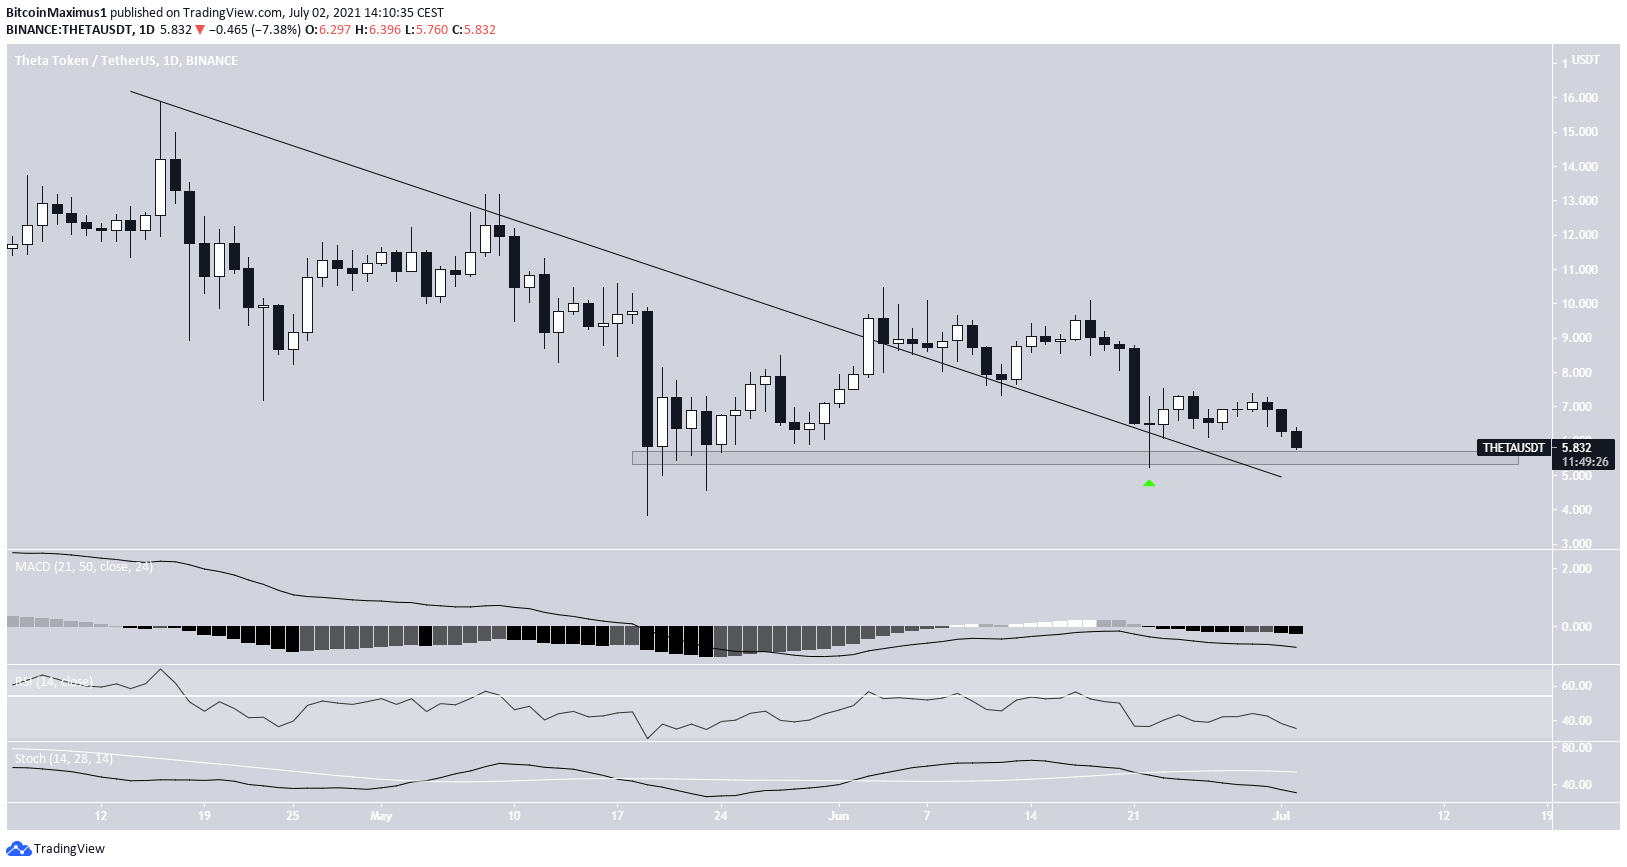
THETA
THETA had been decreasing alongside a descending resistance line since April 16. On June 3, it managed to break out. However, the upward movement could not be sustained and THETA decreased shortly afterwards.
On June 22, it validated the line as support. Alongside the $5.50 horizontal support area (green icon).
It has now returned to the $5.50 area once more, potentially creating a double bottom pattern.
However, there are no bullish reversal signs from technical indicators yet.
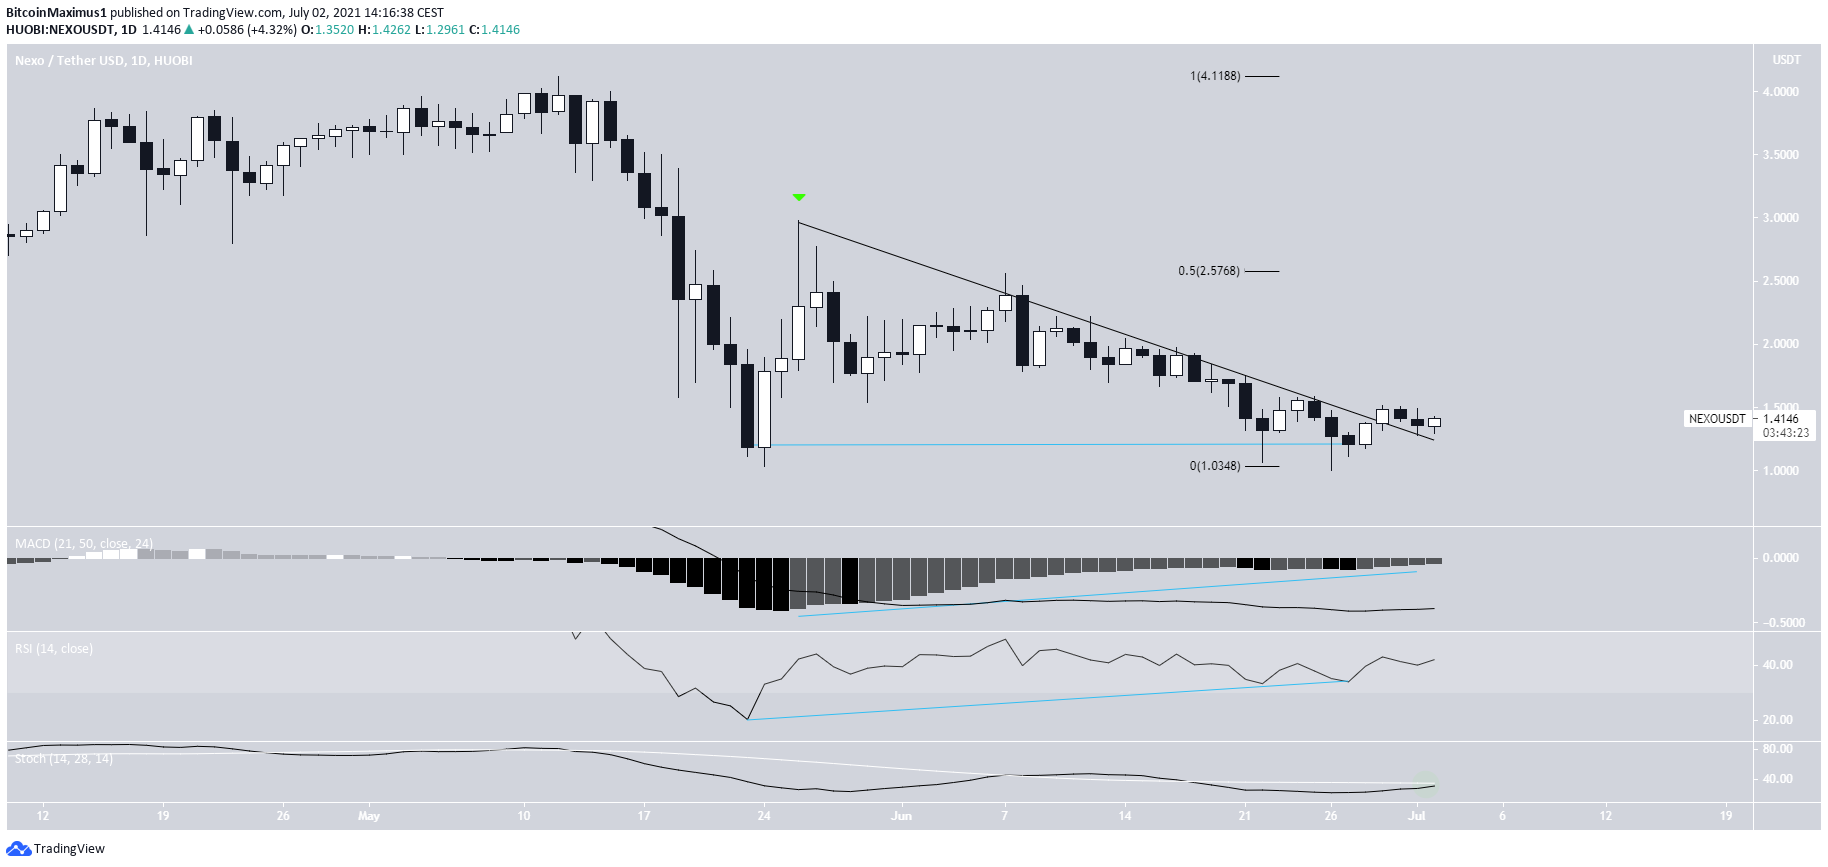
NEXO
NEXO had been decreasing alongside a descending resistance line since May 26. It made four unsuccessful breakout attempts before finally breaking out on June 29.
The breakout was preceded by a double bottom pattern that was combined with considerable bullish divergence in both the MACD & RSI. In addition to this, the Stochastic oscillator is very close to making a bullish cross.
The next closest resistance is at $2.60.
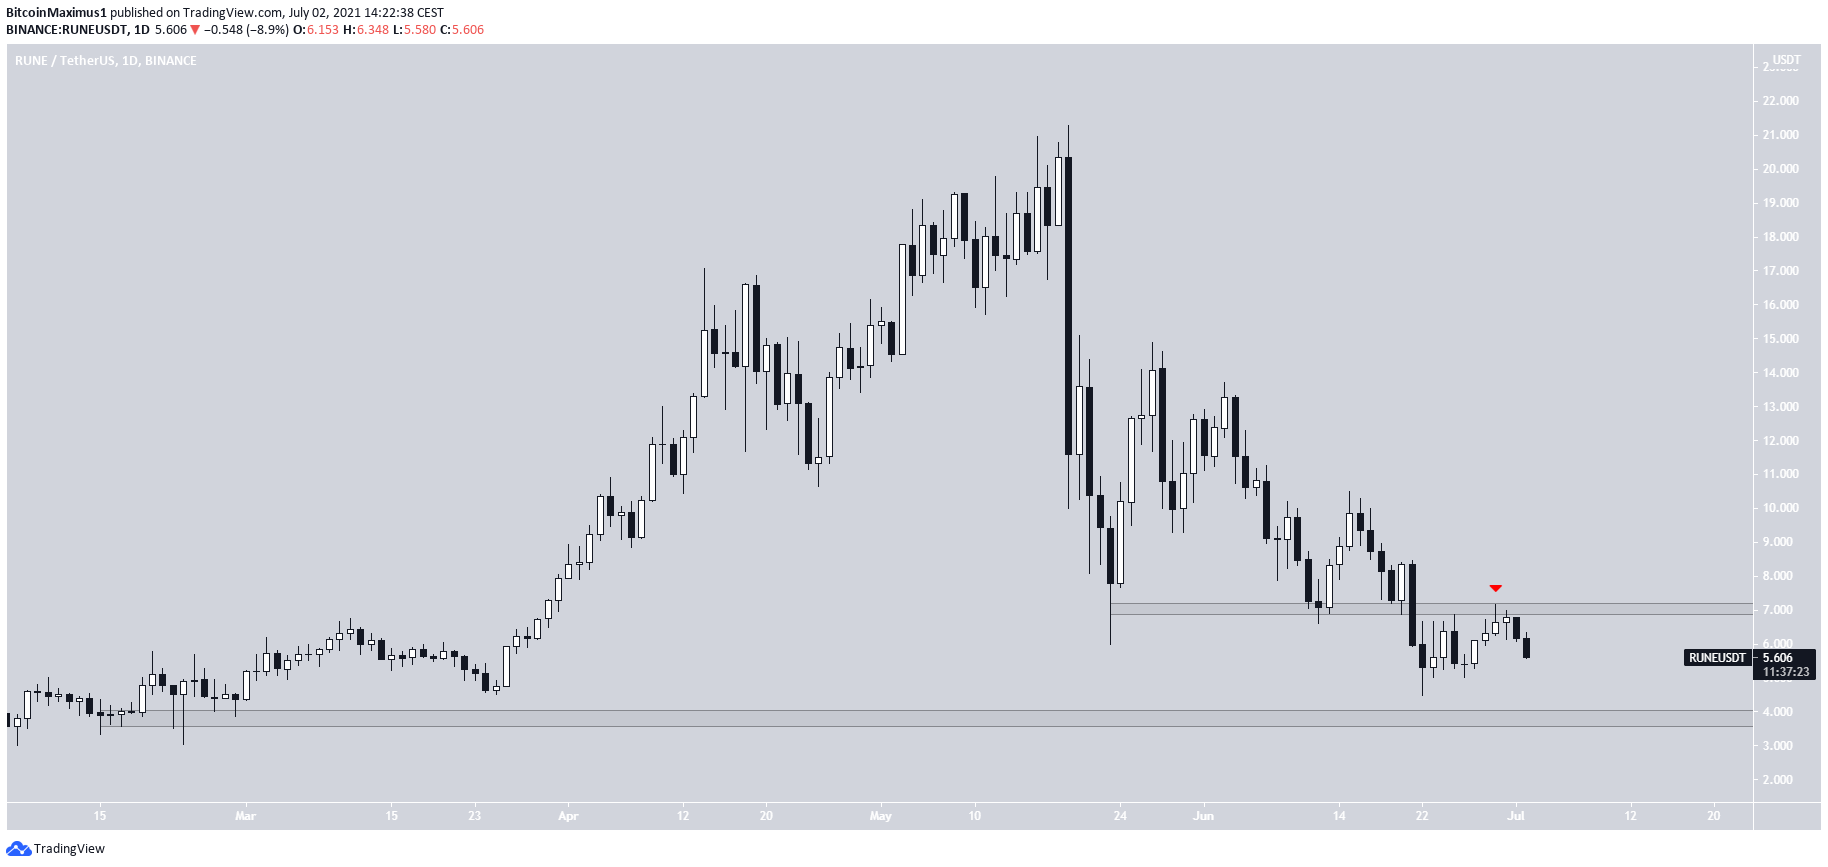
RUNE
RUNE has been falling since May 19, when it had reached a high of $21.28. While it bounced on May 23, the upward movement was short-lived.
On June 22, RUNE reached a lower low of $4.48. The ensuing bounce was rejected by the $7.05 area, which previously acted as support. It has now turned to resistance (red icon).
The closest support area is at $3.80.
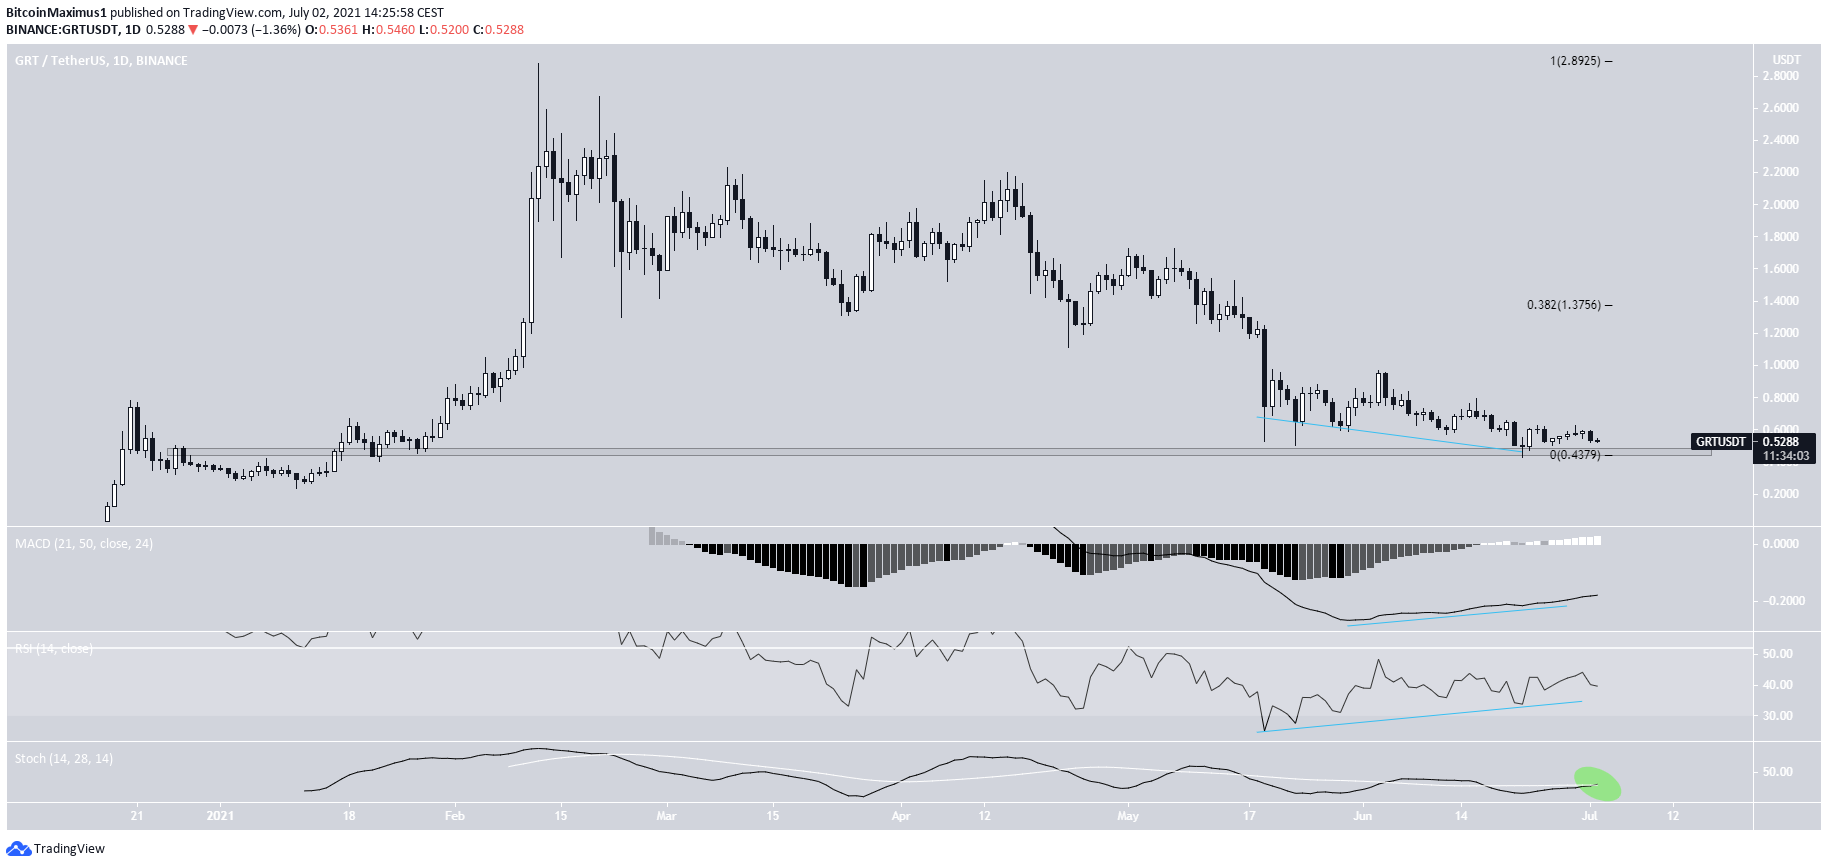
GRT
GRT has been gradually decreasing since Feb. 12. On June 22, it reached a low of $0.42. This was close to the yearly low of $0.233.
GRT has been increasing since, validating the $0.45 horizontal area as support.
The upward movement was preceded by significant bullish divergence in both the MACD signal line and the RSI. In addition to this, the Stochastic oscillator has just made a bullish cross (green icon).
The closest resistance is at $1.375.
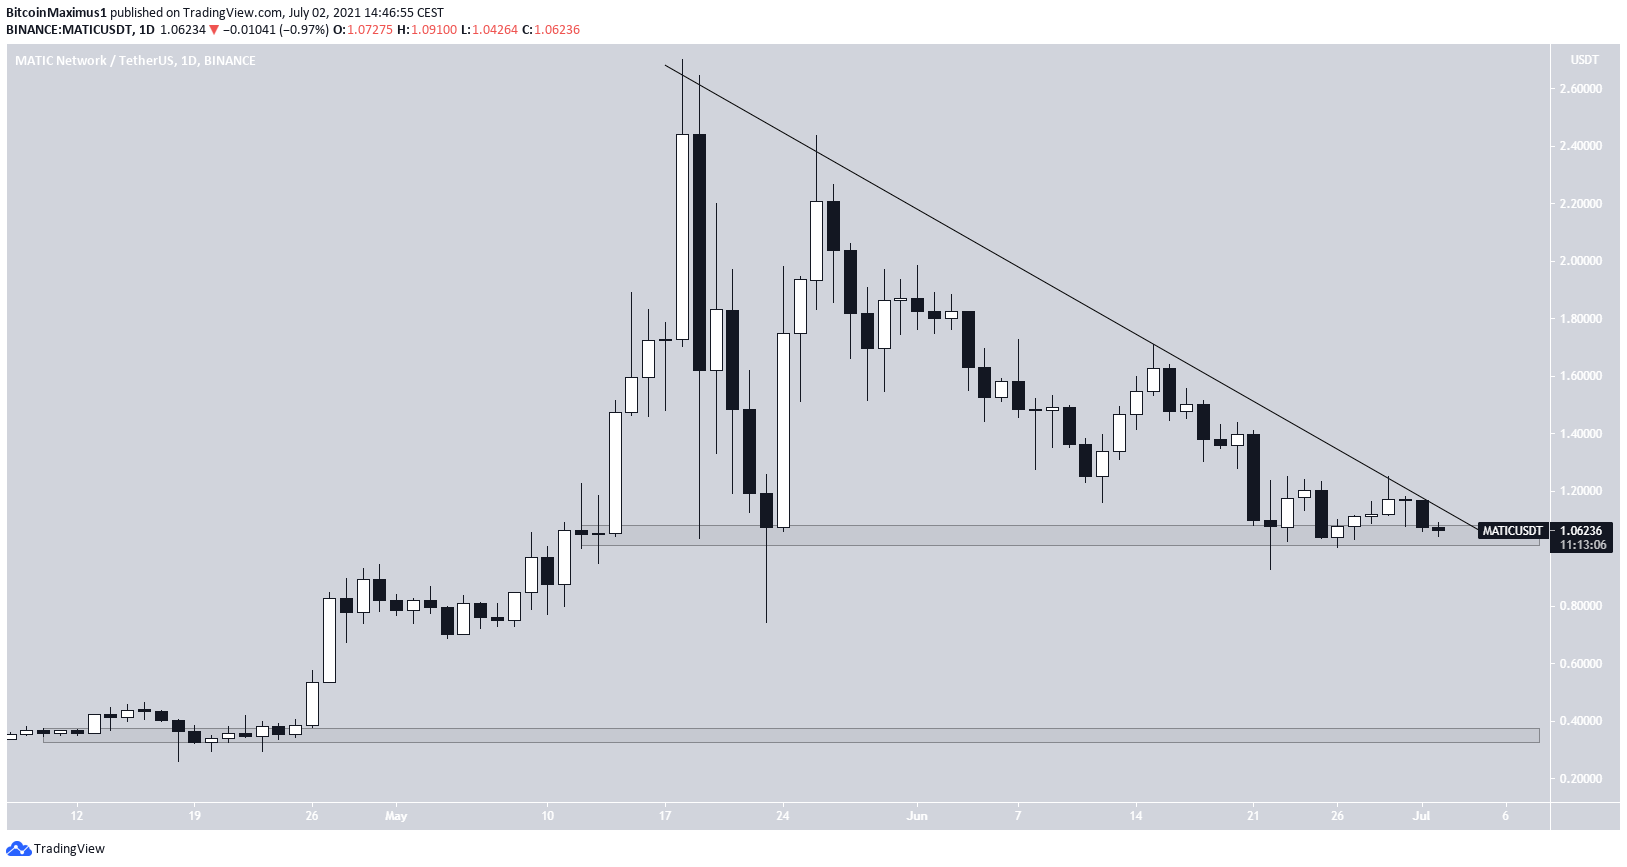
MATIC
MATIC has been decreasing alongside a resistance line since May 18. Throughout this decrease, it has thrice bounced at the $1.00 horizontal support area, most recently doing so on June 26.
However, the bounce has been weak and it seems that the token has created a descending triangle.
The next support area is at $0.38.
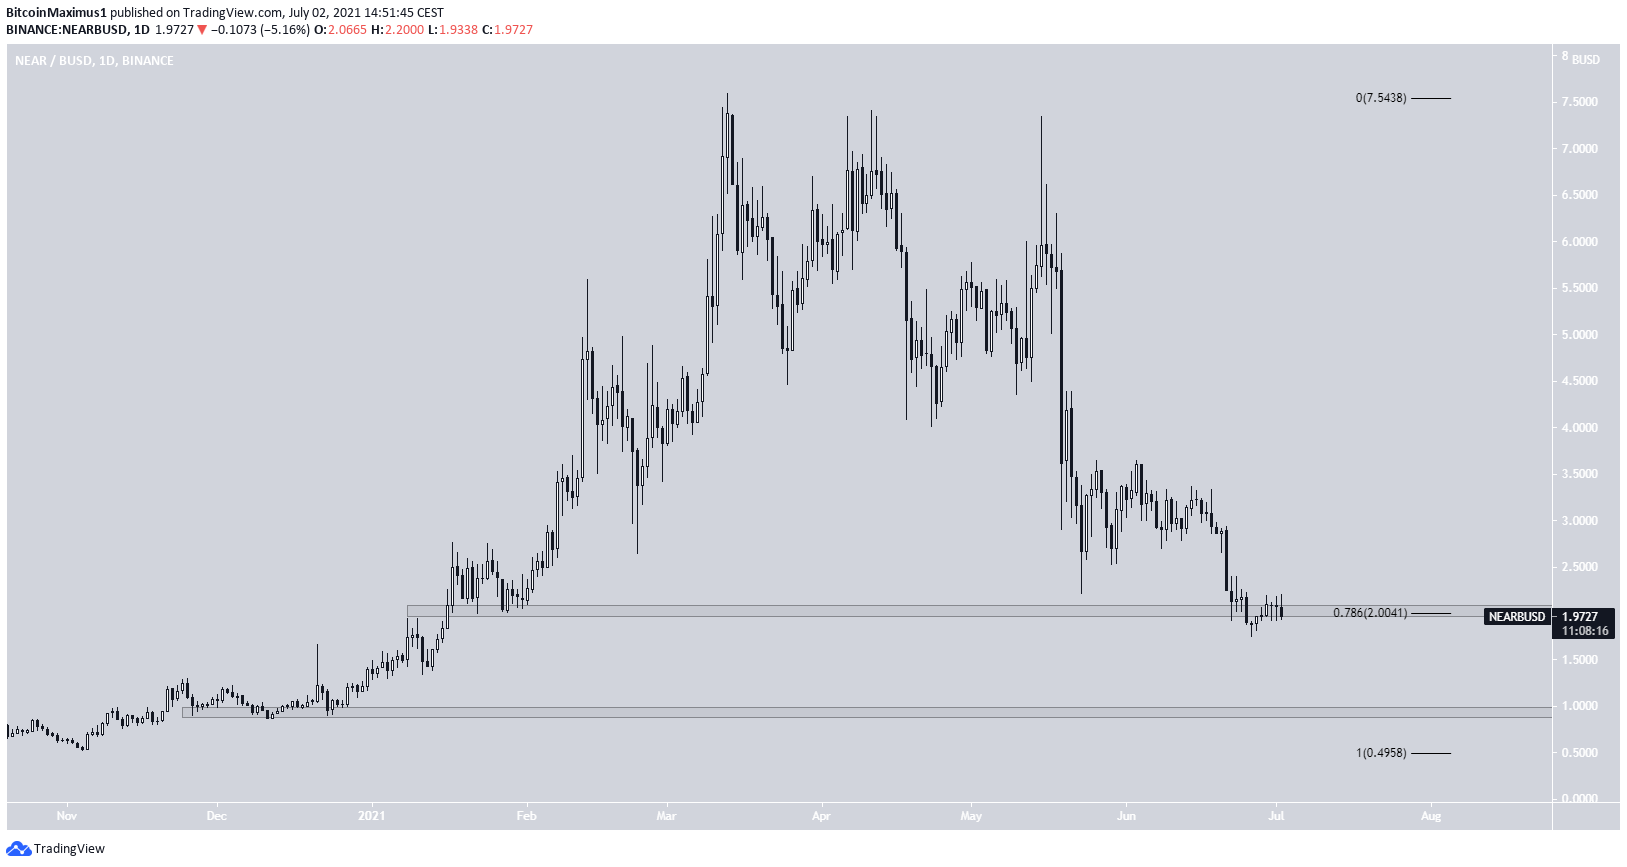
NEAR
NEAR has been moving downwards since March 13. On May 15, it created a lower high and accelerated its rate of decrease afterwards.
Currently, it is trading just above the $2.00 support area, which is the 0.786 Fib retracement support level.
If a breakdown occurs, the next support would be at $0.95.
For BeInCrypto’s latest bitcoin (BTC) analysis, click here.


