

BeInCrypto takes a look at the eight altcoins that decreased the most over the past seven days, from Aug 27 to Sept 3.
These altcoins were:
- Constellation (DAG) : -26.83%
- COTI Network (COTI): – 13.05%
- Enzyme (MLN) : -10.68%
- FUNToken (FUN) : -8.49%
- Swipe (SXP) : -7.84%
- PancakeSwap (CAKE) : -6.78%
- Klaytn (KLAY) : -0.71%
- Siacoin (SC) : -0.32%
DAG
DAG initiated an upward move on May 23 and it began to accelerate on July 20. This led to an all-time high price of $0.462 on Aug 26.
However, DAG has been moving downwards since. Currently, it’s trading just above the $0.382 Fib retracement support level at $0.294. If the level does not hold, there is strong support at $0.192. This is the 0.618 Fib retracement support level and a horizontal support area.

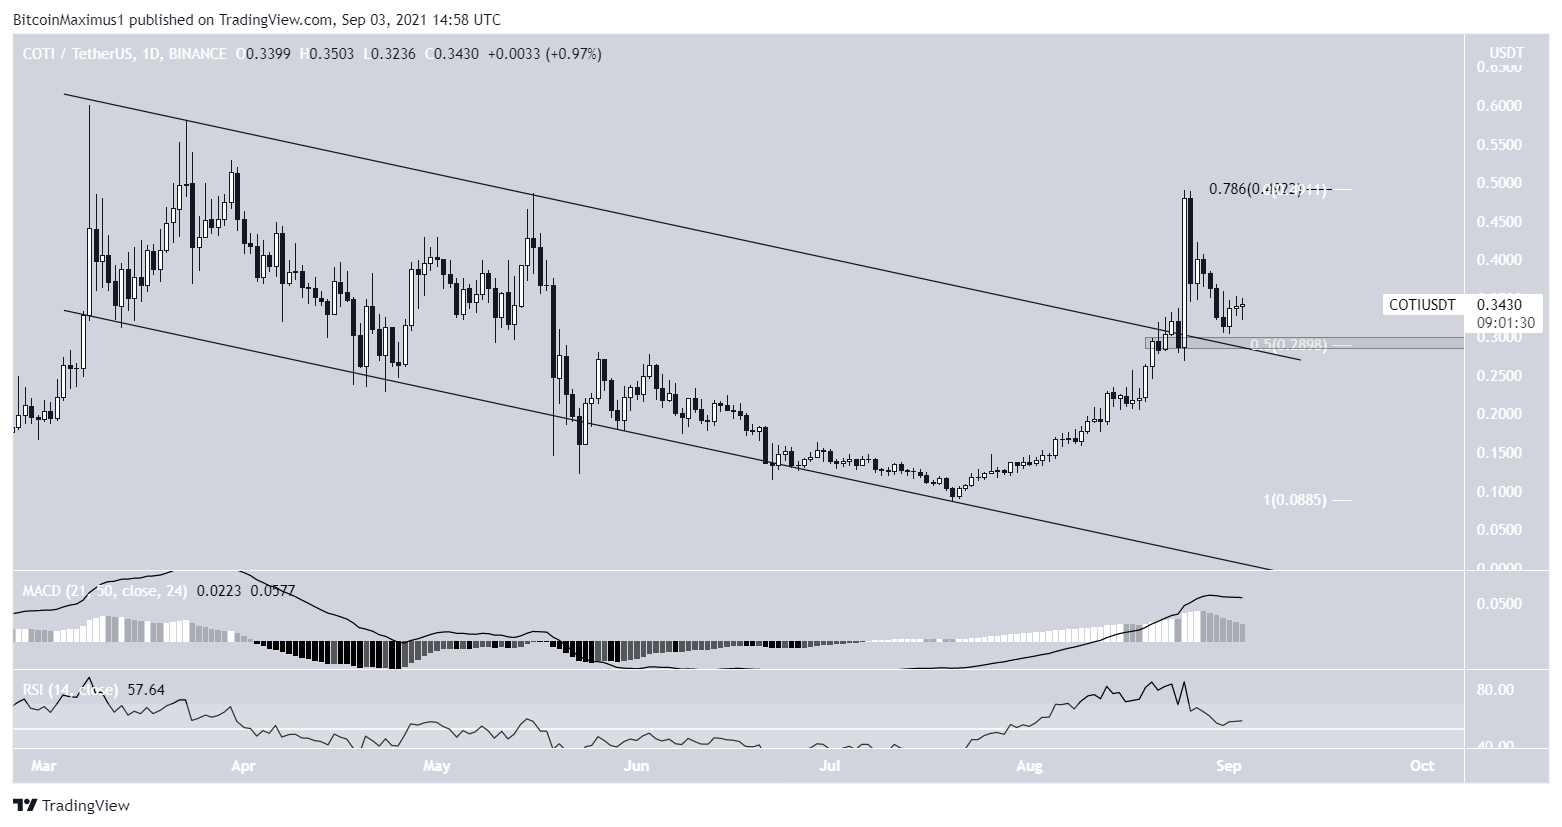
COTI
On Aug 25, COTI broke out from a descending parallel channel and proceeded to reach a high of $0.49 the same day.
However, it was rejected by the 0.786 Fib retracement resistance level and has been moving downwards since. It’s currently trying to find support above $0.29. This is the 0.5 Fib retracement support level when measuring the entire upward movement.
However, neither the RSI nor MACD are showing any bullish reversal signs.
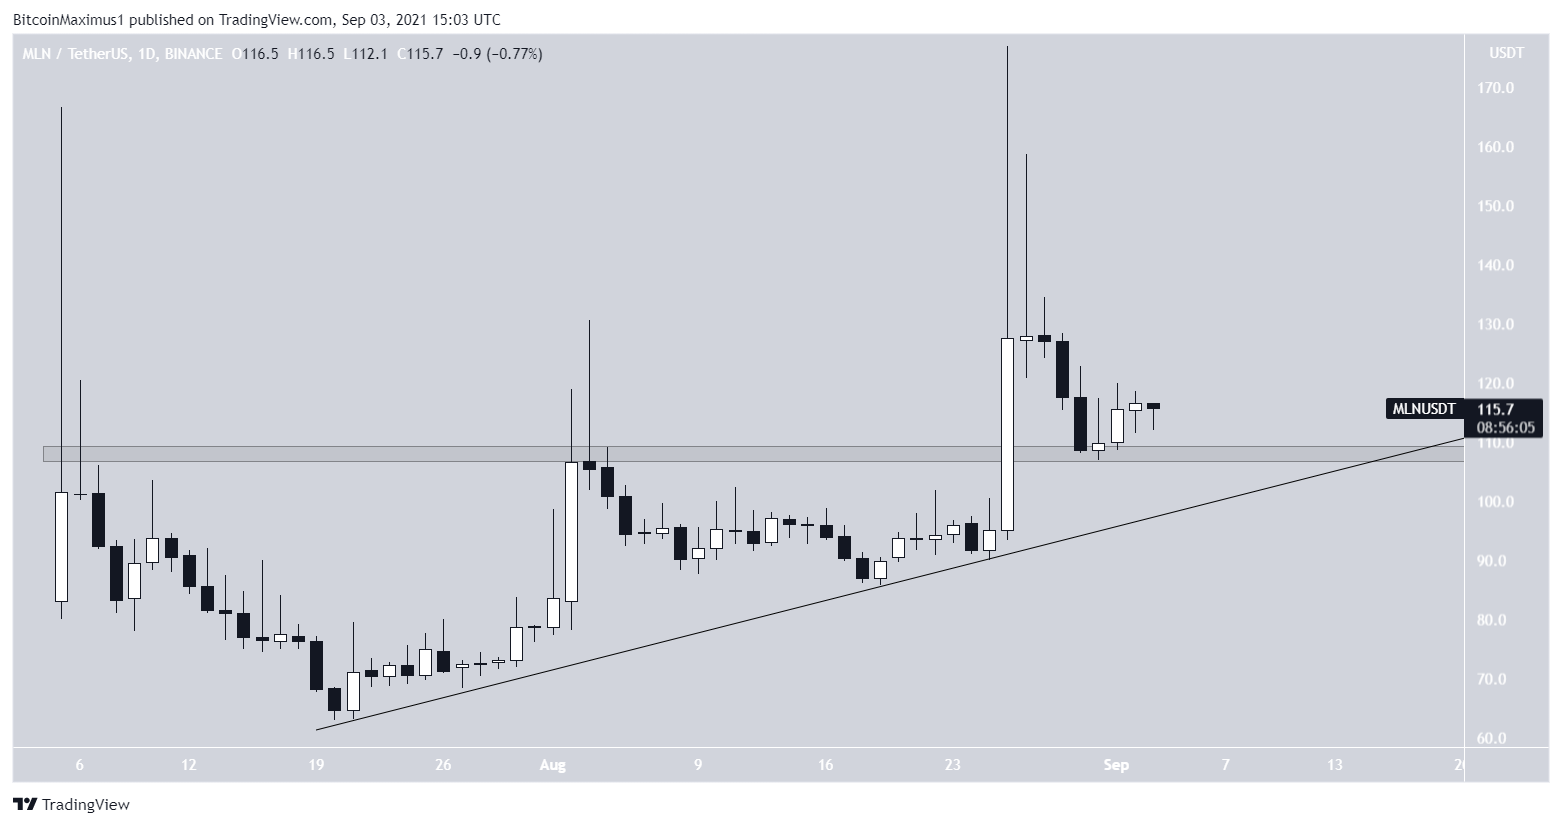
MLN
MLN has been increasing alongside an ascending support line since July 21. While it was initially rejected by the $108 resistance area, it managed to break out amid a large bullish candlestick on Aug 26.
The same day, it reached a high of $177 before creating a long upper wick (red icon) and falling sharply.
However, it’s still trading above both the $108 area and the ascending support line. As long as it’s doing so, the trend can be considered bullish.
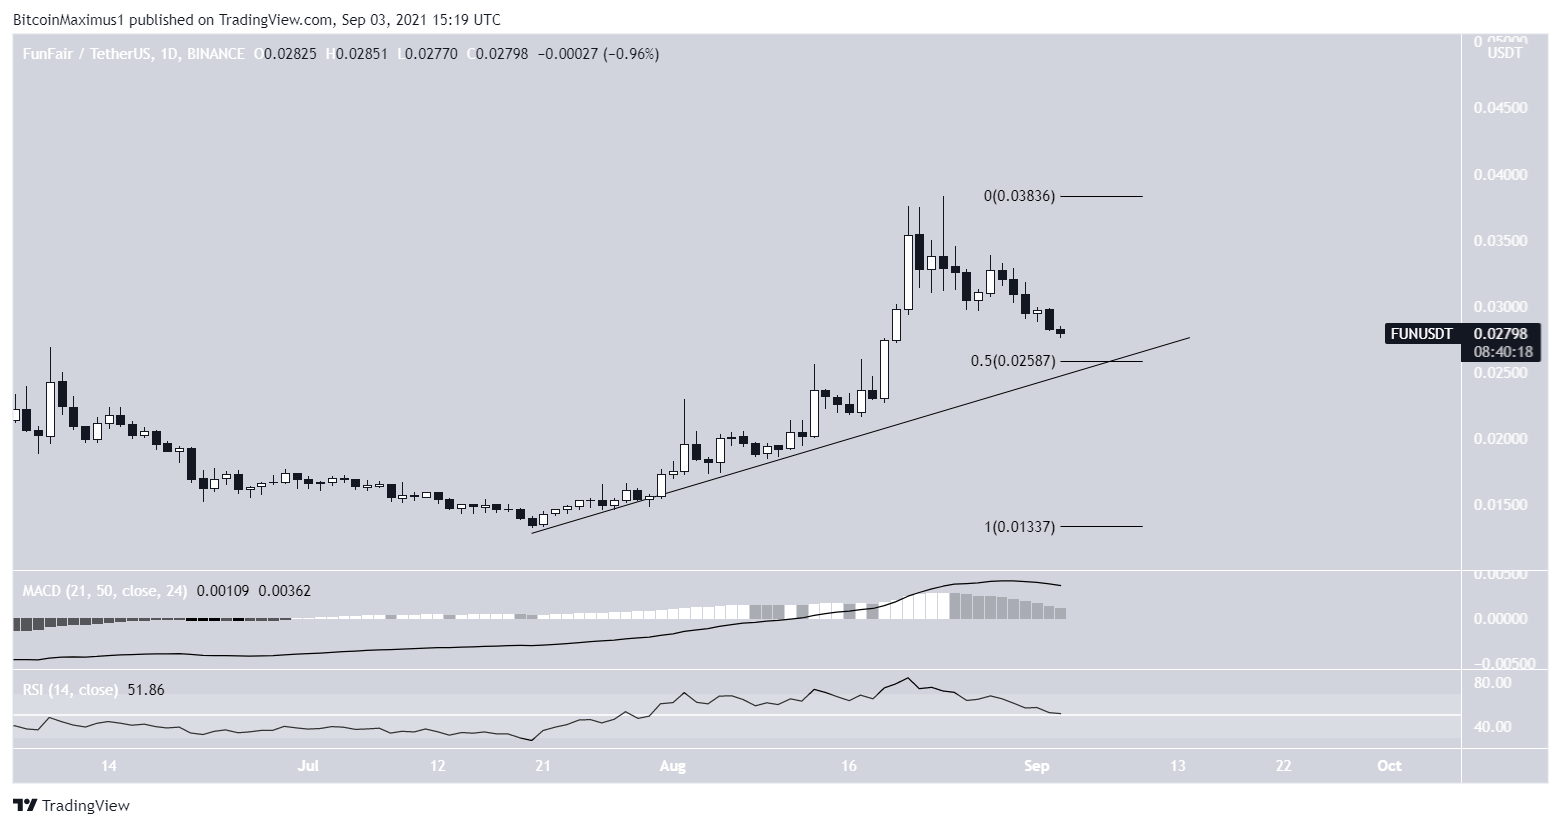
FUN
FUN has been increasing alongside a descending resistance line since July 20, when it was trading at a low of $0.013. The upward move continued until a high of $0.038 was reached on Aug 24.
FUN created a long upper wick the same day and has been moving downwards since. In addition to this, the MACD and RSI are both decreasing.
However, it’s approaching a strong support level at $0.026, created by the 0.5 Fib retracement level and the ascending support line.
Some type of bounce would be likely if FUN returns to this support.
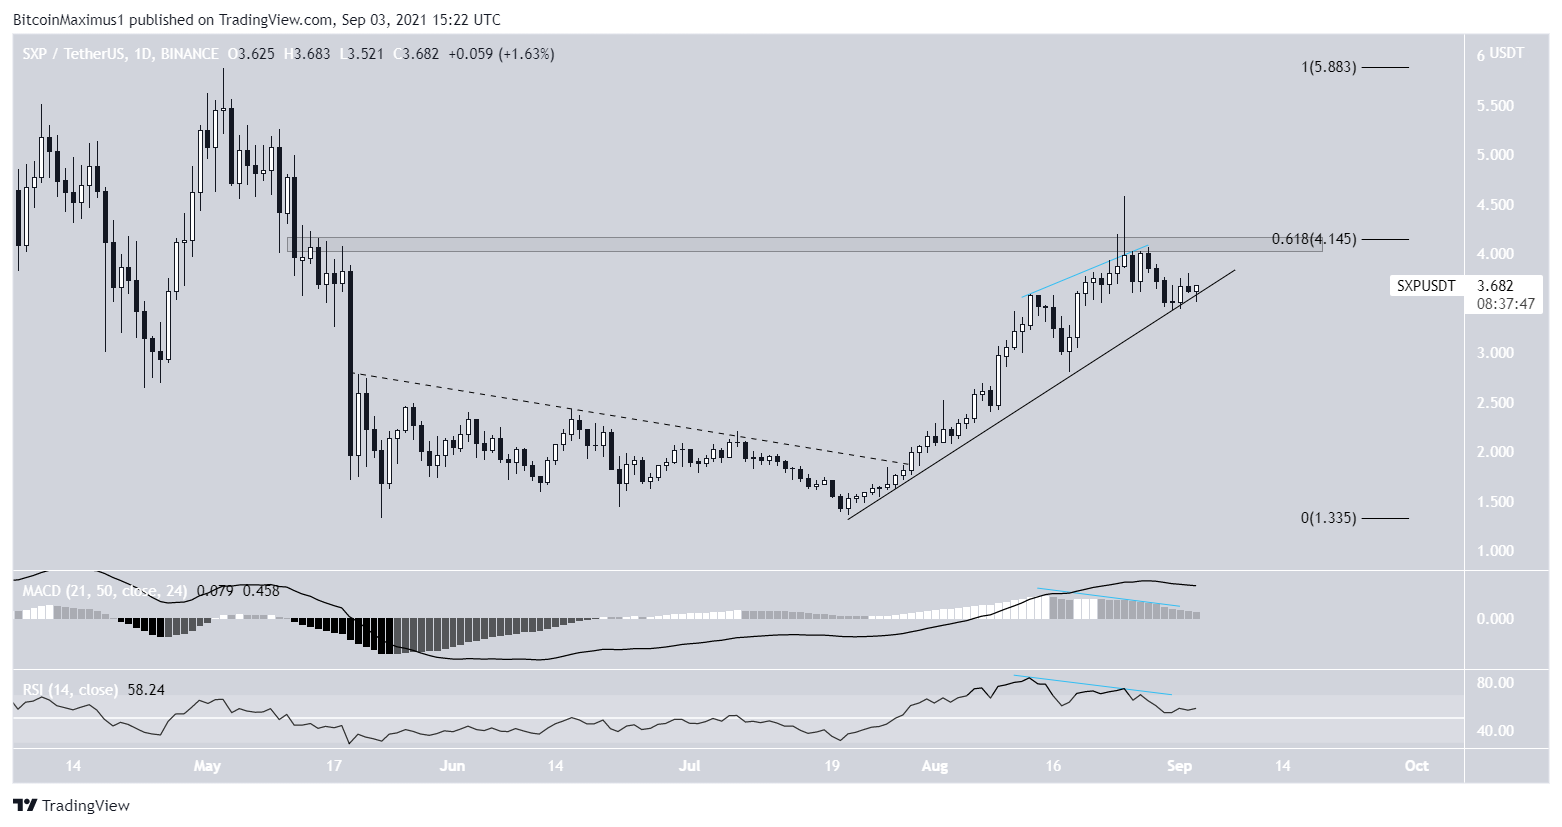
SXP
On July 29, SXP broke out from a descending resistance line and proceeded to increase until it reached a high of $4.58 on Aug 25.
However, it failed to break out above the $4.15 resistance area, which is the 0.618 Fib retracement level. After both the MACD and RSI generated bearish divergences, SXP started moving downwards.
Despite the drop, SXP is still holding on above an ascending support line. As long as the support line is in place, the bullish structure remains intact.
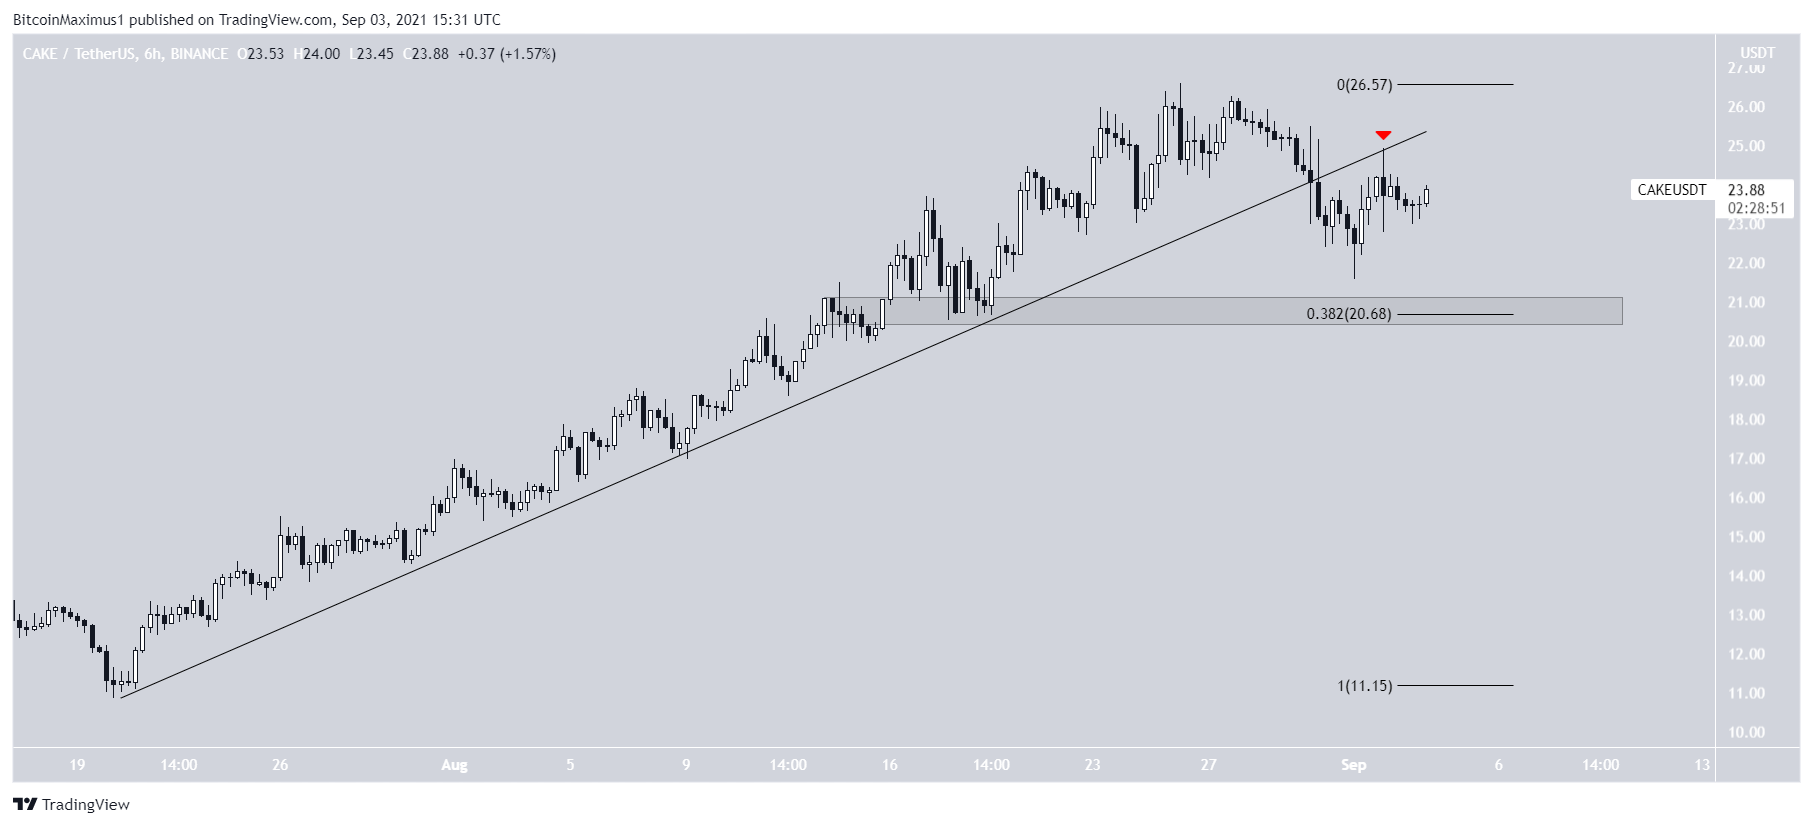
CAKE
In the time between July 20-Aug 26, CAKE had been increasing alongside an ascending support line. However, it broke down from the line on Aug 30.
Following this, CAKE validated the line as resistance (red icon) on Sept 2.
The main support area is found at $20.70. This is both a horizontal support area and the 0.382 Fib retracement support level.
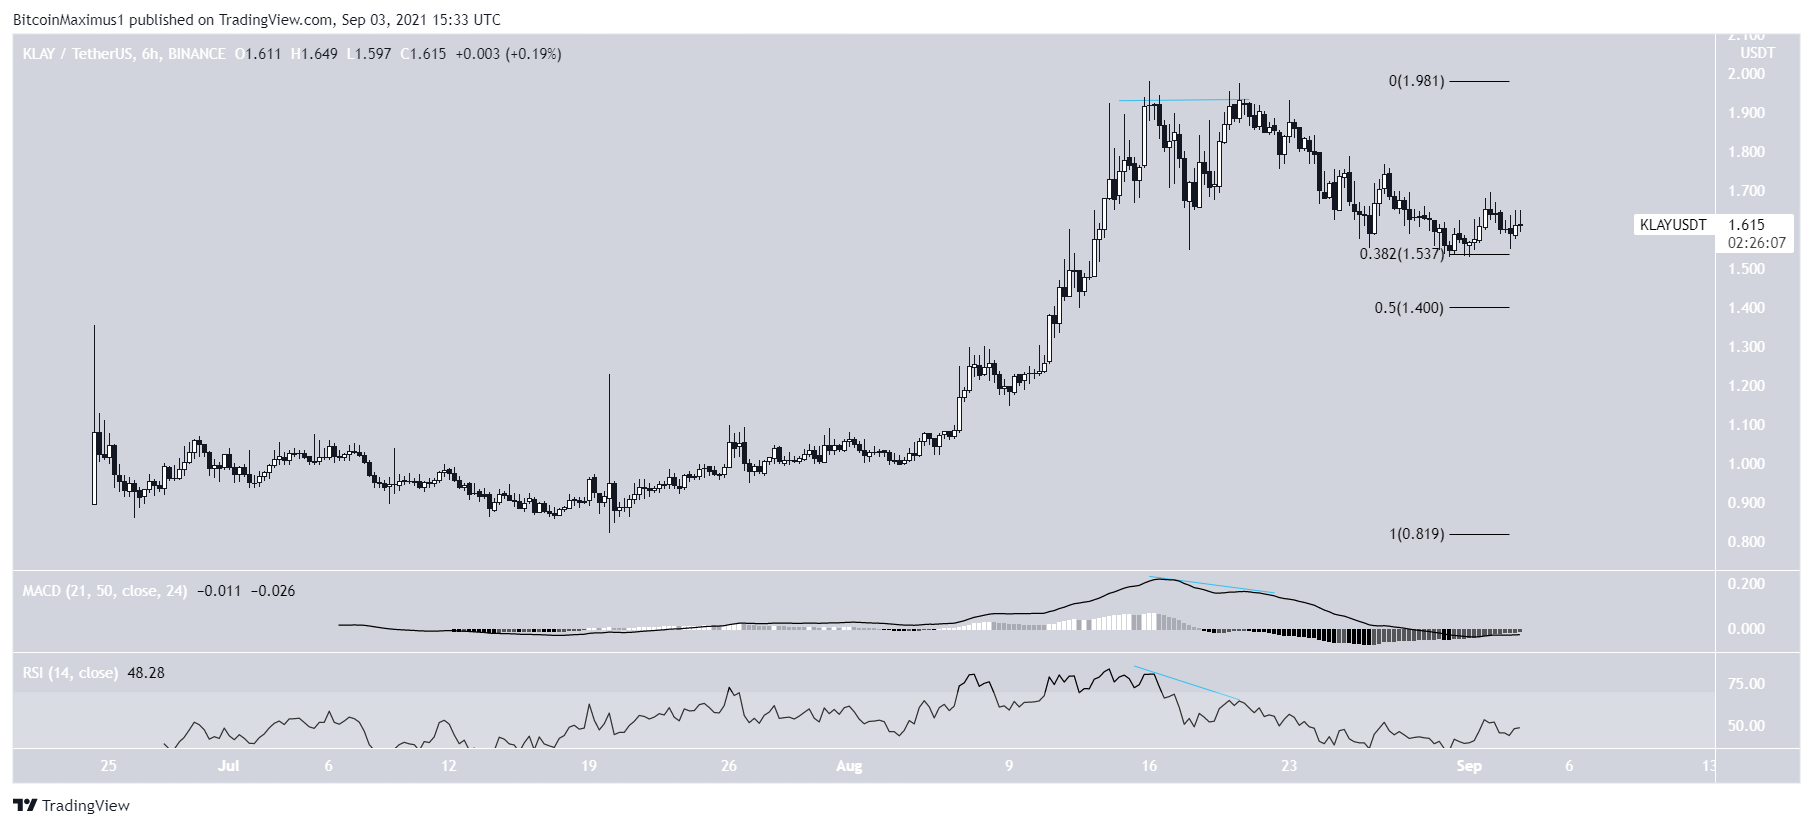
KLAY
KLAY has been moving downwards since Aug 16, after it reached an all-time high price of $1.98. It created a double top pattern on Aug 20 and has been moving downwards since.
The pattern was combined with bearish divergences in both the RSI and MACD.
The fall stopped once KLAY bounced at the 0.382 Fib retracement support level at $1.54. Currently, it’s consolidating above the level, potentially getting ready for another upward move.
Conversely, the next closest support area is found at $1.40.
SC
SC has been moving upwards since June 22. It created a higher low on July 20 and began to accelerate.
On Aug 23, it broke out from the $0.02 horizontal resistance area and validated it as support five days later (green icon).
If it continues moving upwards, the next resistance level would be found at $0.033.

For BeInCrypto’s latest Bitcoin (BTC) analysis, click here.
Disclaimer
In line with the Trust Project guidelines, this price analysis article is for informational purposes only and should not be considered financial or investment advice. BeInCrypto is committed to accurate, unbiased reporting, but market conditions are subject to change without notice. Always conduct your own research and consult with a professional before making any financial decisions. Please note that our Terms and Conditions, Privacy Policy, and Disclaimers have been updated.
